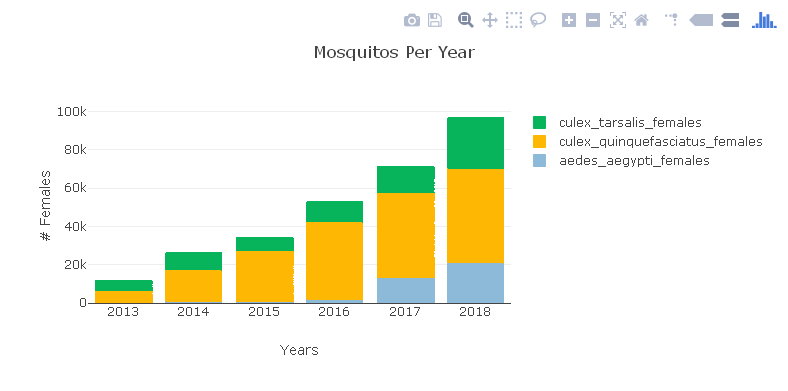
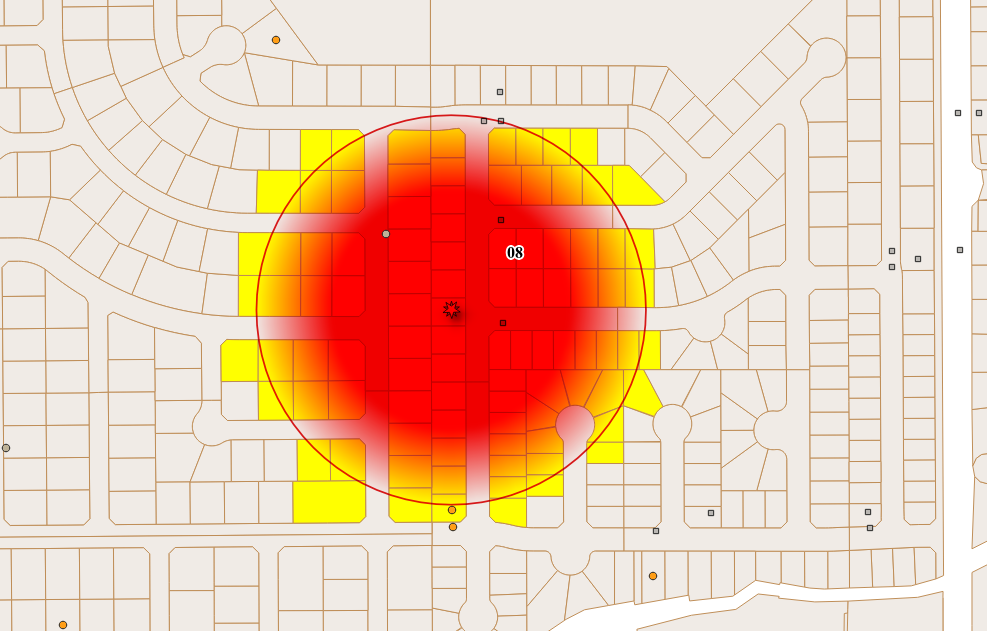
This spring, with funding provided by the Association of State and Territorial Health Officials (ASTHO), Kurt Menke developed a two day workshop that combines elements of the standard Community Health Maps workflow with vector borne disease surveillance analyses.The workshop begins with an introduction to Community Health Maps, and learning how to use Fulcrum to develop a data collection form and collect community GIS data with a smartphone. Participants will then be introduced to QGIS. They will learn how to add the field data just collected, and symbolize it. They will then download some open data and create a map.The second day focuses on a suite of mosquito trap data acquired from Madera County, CA, by Dr. Chris Barker at UC Davis. There are 5 years of mosquito trap data and mosquito virus testing data. There are also anonymized data for mosquito biting complaints, mosquito management zones, storm drain locations, parcels and roads.Collectively this provides a rich yet manageable dataset. With it participants will learn to use to create information such as:


 This workshop represents applied real-world workflows. These are many of the standard products needed by public health officials and typically produced by researchers. Having this sort of analysis and data visualization available via an open source package means anyone willing to take a few days to learn can produce them! This is especially true as the needed input data can be collected via Fulcrum if they don't already exist.This workshop will be taught twice in June. Both workshops will be part of the Community Health Maps project and are partly funded by the National Library of Medicine (funding for the workshop is provided under a sub-award from the National Library of Medicine to ICF International). The first iteration will be taught in conjunction with the Insular Area Climate and Health Summit in Honolulu, HI. This will be attended by public health officials from many of the Pacific Territories.The second workshop will be taught in Providence, RI at the GIS Surveillance Workshop. This will be attended by State based health officials.This material really showcases the analysis and data visualization capabilities of QGIS. It represents perhaps the greatest potential for applied use of Community Health Maps to date. This workshop will part of the suite of Resources available through the Community Health Maps program in the near future.If you are interested in having this taught for you or your colleagues contact Kurt Menke (kurt@birdseyeviewgis.com).
Fulcrum Community
Last year Fulcrum rolled out a new service named Community. They describe it as a, "no cost, short term crowdsourced data collection solution for qualified humanitarian projects." It works like Fulcrum, but you need to apply for a license. The application form is short and is right on the Community home page. In the application you need to describe your purpose and how long you will be collecting data. You also need to provide a project description. If approved you can invite any number of data collectors via email to share your App (data collection form). It is generally aimed at humanitarian agencies, non-profits, or government agencies. They restrict commercial use of this service. We used this last fall during King Tide data collection in Miami and it was a big success. In fact there are four main categories highlighted on the Fulcrum Community page: Hurricane, Tornado, Flood and Fire. If you click on Flood, the King Tide project is the first in the list. Clicking on it brings up a map with the data collected.
 One caveat is that the data collected falls into the public domain and can be downloaded freely by anyone. This is possible because the data are anonymized, meaning any private information is scrubbed. The data remain available for viewing and download after the event ends.
 It won't be appropriate unless there is some sort of disaster relief or environmental issue that demands it, but it is another tool to keep in your Community Health Maps toolkit!
Where To Look for Data
One of the initial stumbling blocks for Community Health Mappers post-workshop, is where to look for data. There is a lot of data available online. Most municipalities, counties and states will have some sort of GIS data portal. These are sites where publicly available mapping data can be downloaded and are best found with an internet search. Those are simply too numerous to list. However, the list below is a good starting point for commonly used national GIS datasets.OpenStreetMap: https://www.openstreetmap.org/ Metro Extracts: https://mapzen.com/data/metro-extracts/ National Extracts: http://download.gisgraphy.com/ GeoFabrik Continental Extracts: http://download.geofabrik.de/index.htmlQuickOSM QGIS PluginNational Map: http://viewer.nationalmap.gov/basic/Includes the following:
- Boundaries
- Elevation
- Topo Maps
- Hydrography
- Imagery
- Named Places
- Land Cover
U.S. Census TIGER Boundaries and Roads:https://www.census.gov/geo/maps-data/data/tiger.htmlCensus TIGER Boundaries
- State boundaries
- County boundaries
- Census Tracts
- Census Block Groups
- Census Blocks
U.S. Census Socioeconomic Data: American Fact Finder: http://factfinder2.census.gov/Includes data from both the Census 2010 and Census 2000 as well as, American Community Survey (ACS) data.Use the Advanced Search to build selections for a specific topic in a specific geographic location.Geospatial Data Gateway (USDS Natural Resources Conservation Service)https://datagateway.nrcs.usda.gov/GDGHome_StatusMaps.aspx
- Census geography
- Climate / Precipitation
- Elevation
- Hydrology (rivers and streams)
- Land Use/Land Cover
- Aerial Photography/Imagery
- Soils
Data.gov: Portal for the U.S. Government’s open data, some tabular, some geospatialCenters for Disease Control and Prevention (CDC) National Center for Health Statistics http://www.cdc.gov/nchs/hus/index.htm CDC Geo-Spatial Resources page: https://www.cdc.gov/gis/resources.htmNational Library of Medicine TOXMAP: Data from the EPA’s Toxic Release Inventory and Superfund programshttp://toxmap.nlm.nih.gov/toxmap/ NLM’s list of Data, Tools and Statistics:https://www.nlm.nih.gov/hsrinfo/datasites.htmlBig Cities Health Inventory Data: https://bchi.bigcitieshealth.org/
White House Announces the Opportunity Project
This week the White House announced the Opportunity Project. It is an open data initiative geared towards empowering communities with data and tools to improve economic mobility. Open data is the data equivalent of open source software. It is licensed so that it is freely available to use by anyone.The main page for the project can be found here: http://opportunity.census.gov/. It includes links to sources of open data and online tools built on open data, ,many of them map based. This looks to be a great resource for Community Health Mappers!
