Community Health Maps has long recommended the use of CartoDB for those interested in low cost online mapping and data visualization. In fact, CHM caught the beginning of this wave because CartoDB wasn't even launched until 2012! Early last month (July 2016) CartoDB was rebranded as Carto, which includes a new logo. However, once you get beyond the new logo your current account page including your data and maps remains unchanged. You can still build maps the way you always have in what is now known as Carto Editor.
 The main difference is that Carto now offers up a new interface named Carto Builder. The good news for Community Health Mappers is that their goal with Carto Builder is to introduce an updated interface. One that still does not require complex geospatial skills and programming. With Carto Builder they aim to make Location Intelligence (LI) more accessible to more people. This means it will give you point and click access to deeper analysis of your data. Builder will have all the functionality currently found in Editor along with the new tools.Eventually Carto Editor will be phased out and Carto Builder will be the interface everyone uses. You can request early access to Carto Builder here: http://go.carto.com/request-beta-access. New users of Carto will be given access the the Carto Builder in phases, over the next several months. All existing maps and data will be seamlessly migrated to the new interface. The following page answers Frequently Asked Questions about the migration from Editor to Builder: https://carto.com/docs/carto-builder/faqs/Once the migration is complete I will post about the new functionality. Stay tuned!
APTR: Teaching Prevention - Albuquerque, NM
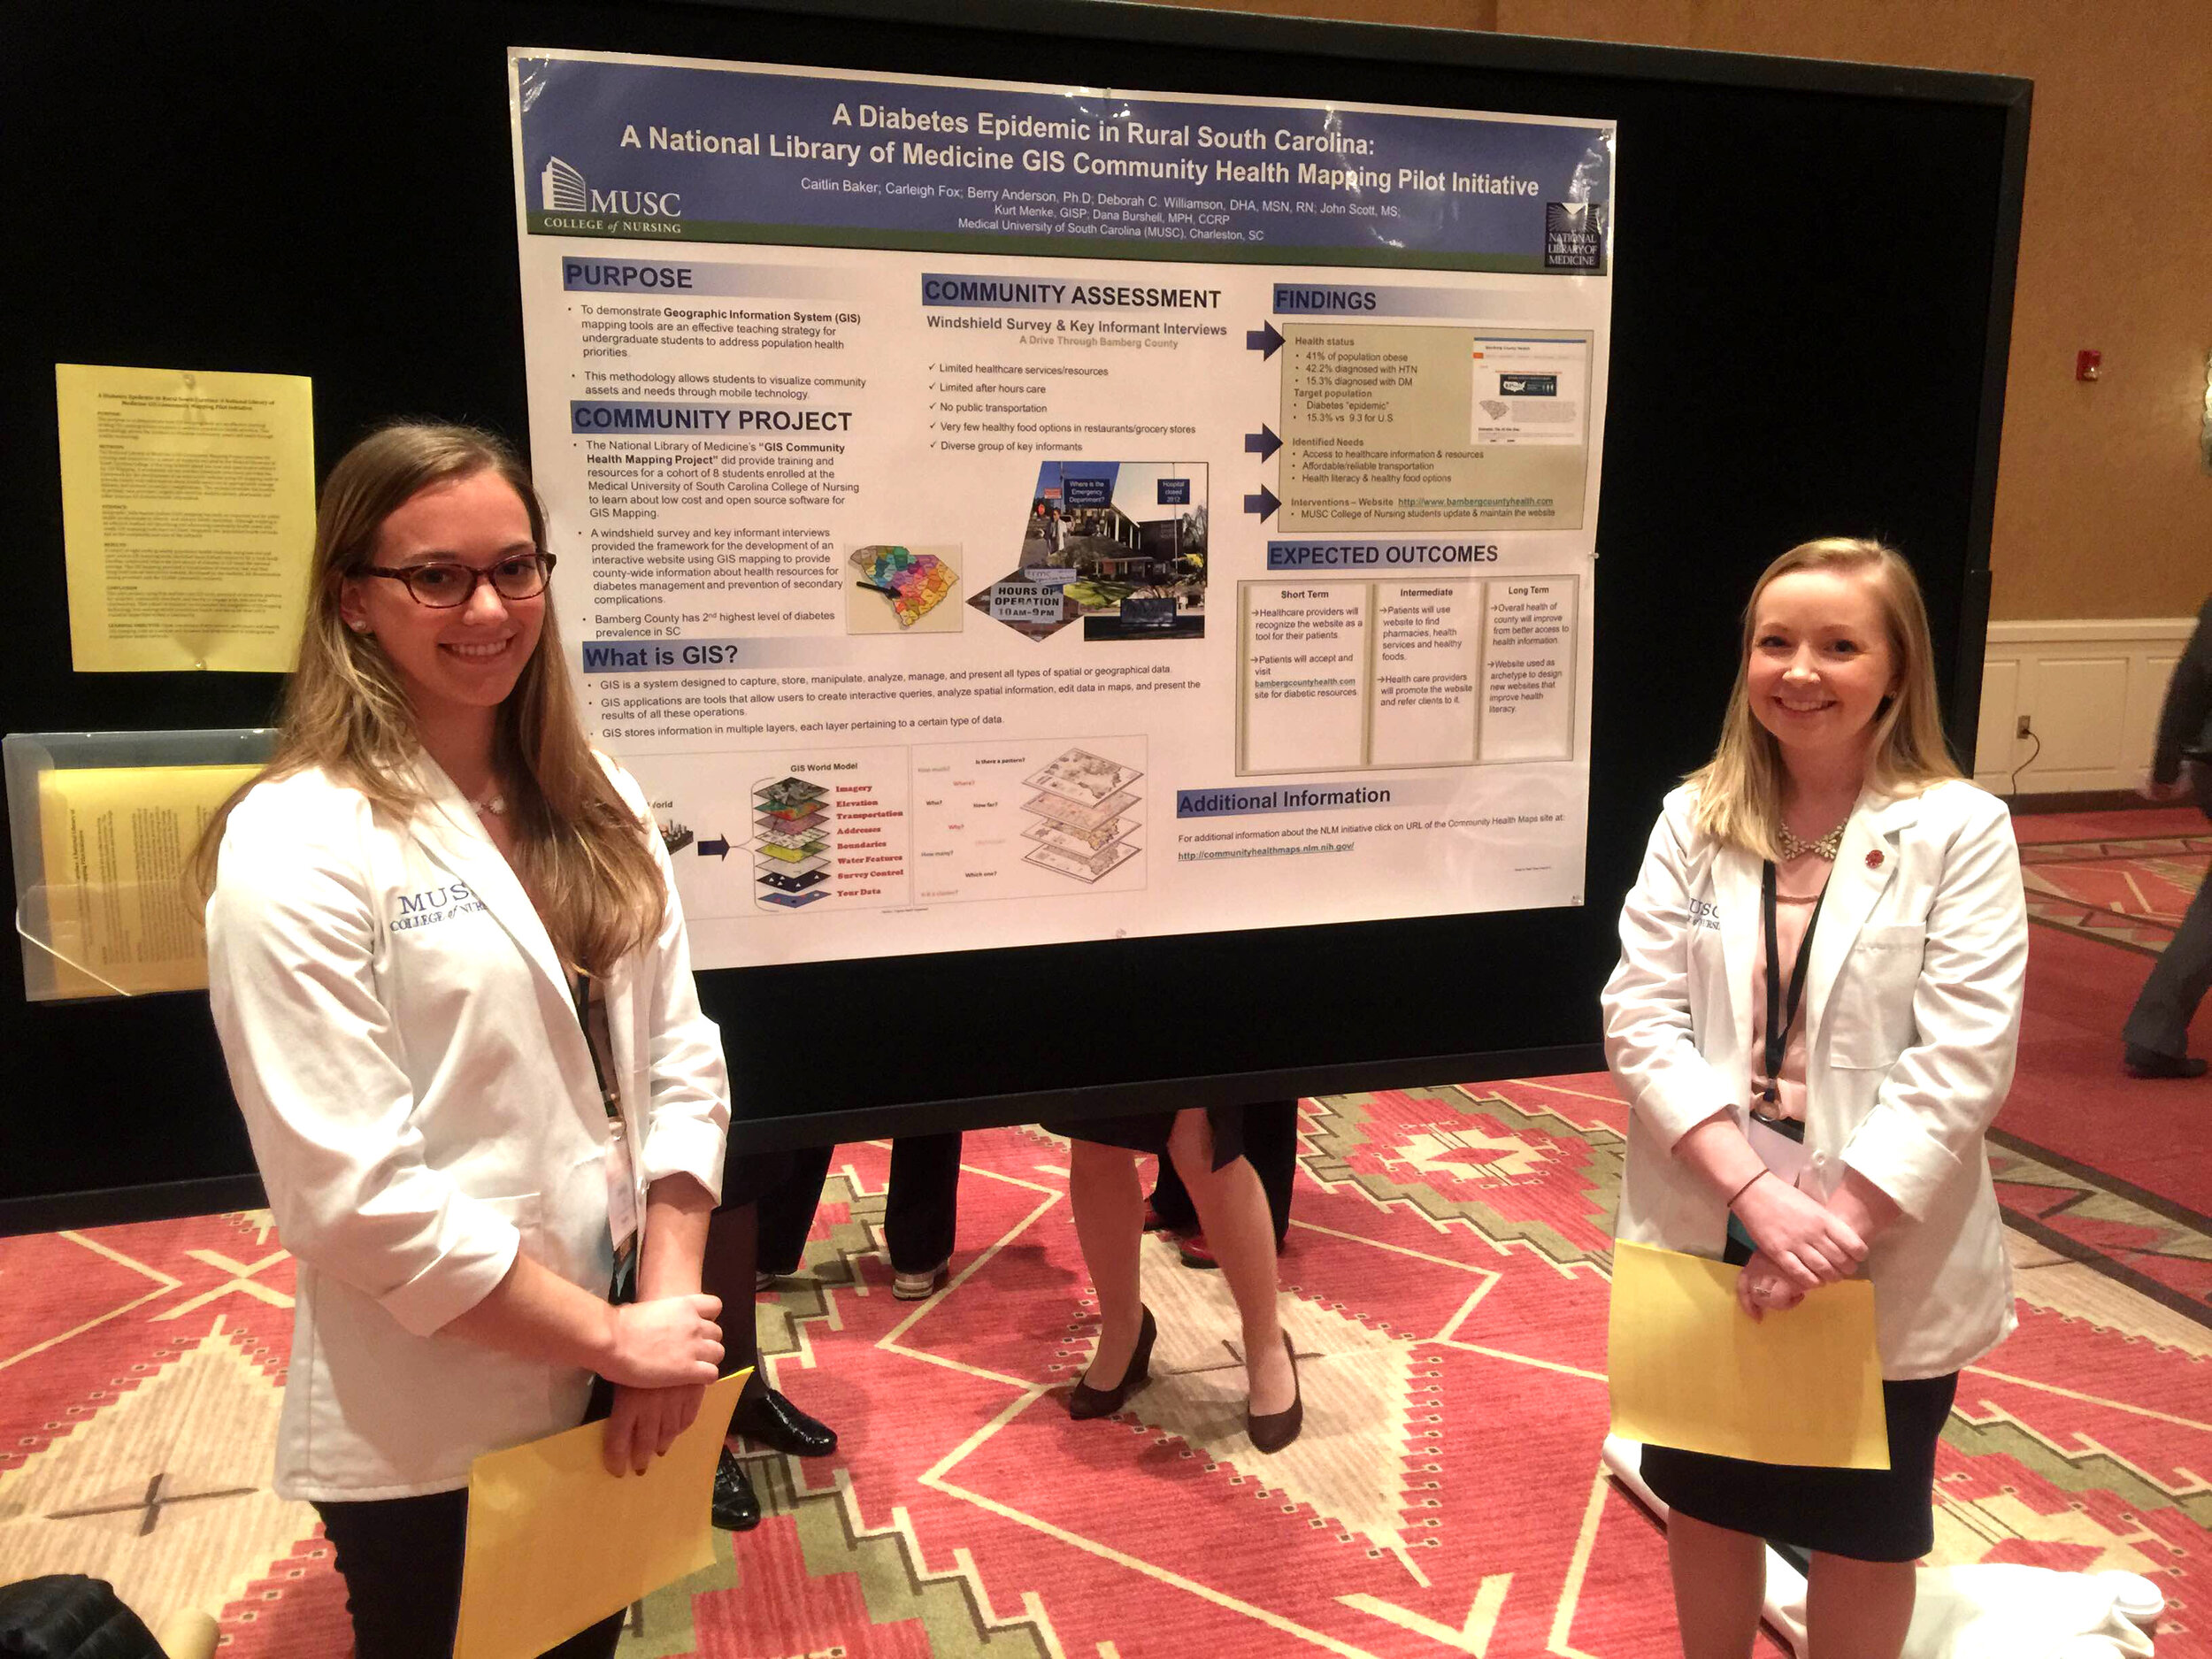
Community Health Mappers had a strong presence at the recent APTR Teaching Prevention conference held in Albuquerque, New Mexico last week. The theme of the conference was Preparing Students to Address Emerging Issues, and four students presented work incorporating the CHM mapping protocol. Medical University of South Carolina (MUSC) College of Nursing students Caitlin Baker and Carleigh Fox presented a poster on their project "A Diabetes Epidemic in Rural South Carolina." They used mobile devices to conduct a windshield survey of a rural South Carolina community to better understand the diabetes epidemic.
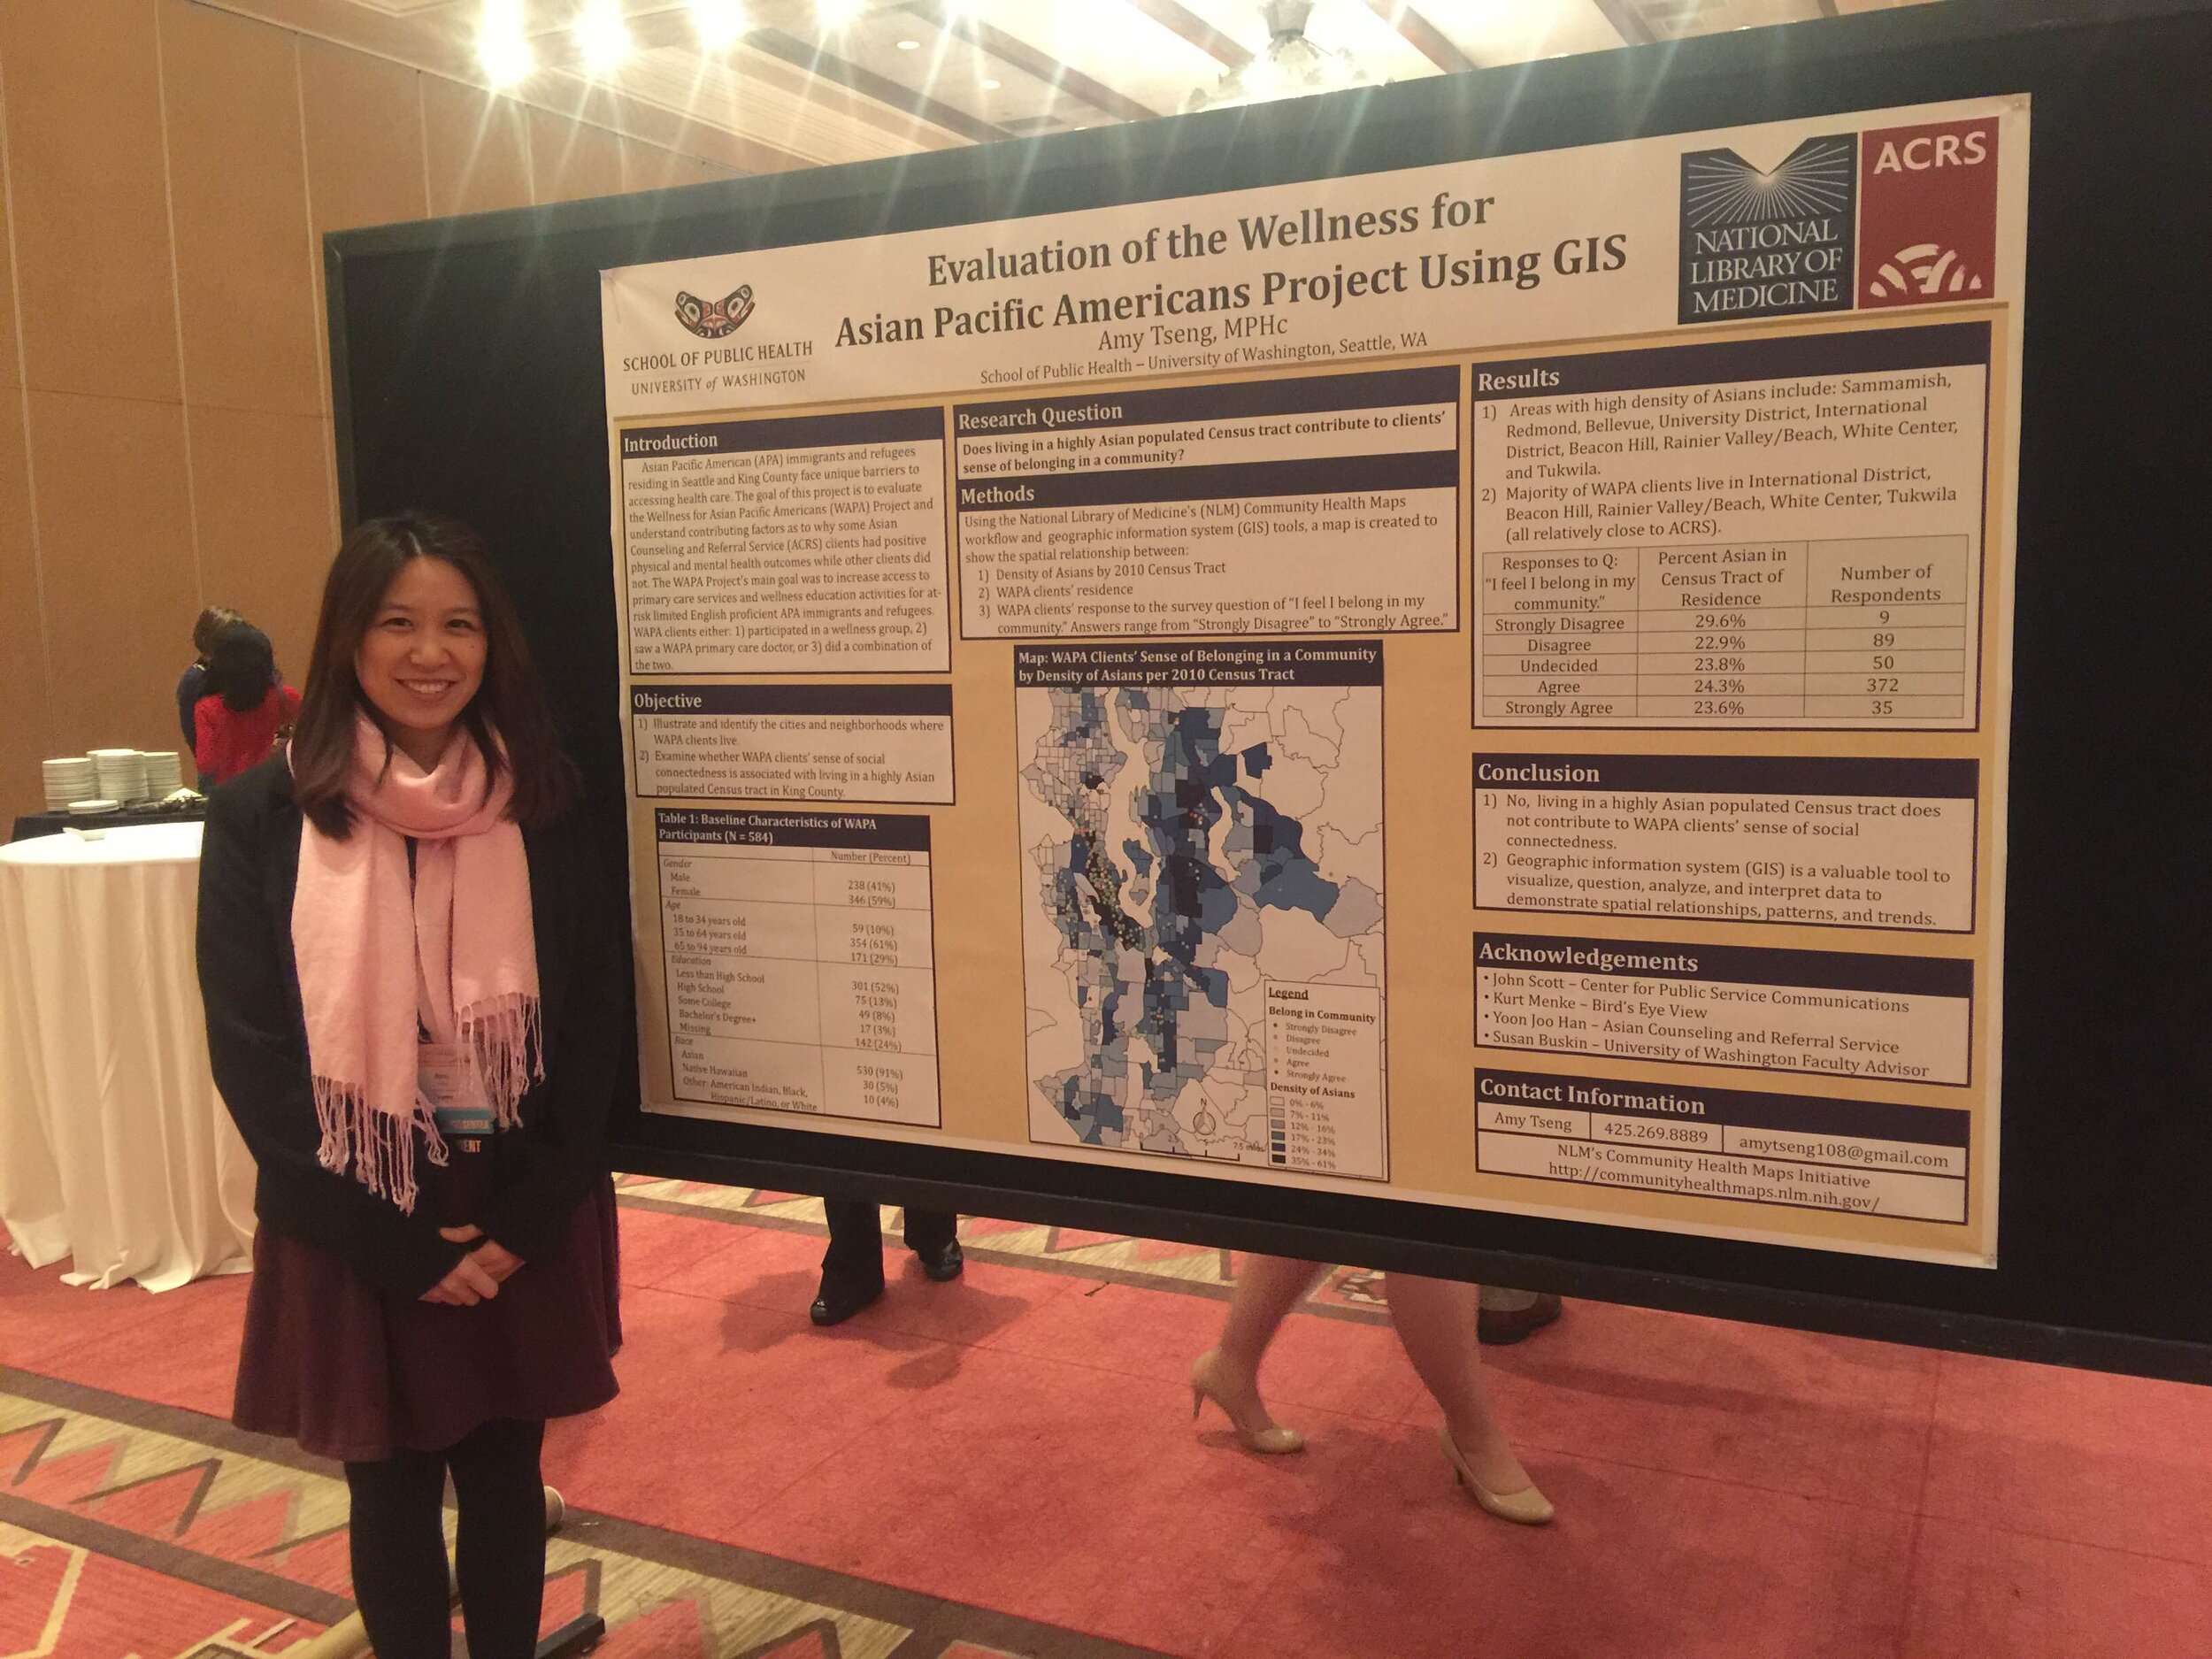
 Amy Tseng, a student at the University of Washington's School of Public Health, presented a poster outlining her project, "Evaluating of the Wellness for Asian Pacific Americans Using GIS." This is her capstone project in the Community Oriented Public Health Practice program . One question she is attempting to answer is whether there is a relationship between having a sense of community and the density of Asian Pacific Americans in a given neighborhood. She is utilizing QGIS and Fulcrum to help answer this question.
 Christina Yantsides, also in the School of Public Health at the University of Washington, presented her capstone project, "Bicycle Injuries and Fatalities: A GIS Mapping Project" in both a the Sunday afternoon lightning session, and the Sunday evening poster session. She is using QGIS to help identify clusters of bicycle accidents in Seattle and gain a better understanding of the causal factors.
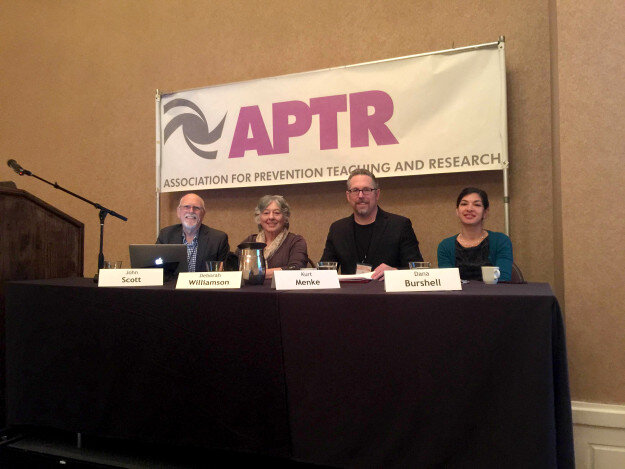
 The final morning of the conference myself, John Scott, Dr. Deborah Williamson (MUSC) and Dana Burshell (MUSC) presented the "National Library of Medicine (NLM) Community Health Mapping Project." Often conference attendees are tired by the final morning. However, we were excited to present to a standing room only crowd of about 75 attendees! Collectively we introduced the project and the National Library of Medicine, and went on to show how successfully the project has been implemented from Hawai'i to South Carolina. I heard several audible gasps from the audience as we presented examples. This caused me reflect on the fact that mapping and GIS is simply what I do all day long, however, to many it is still a new and exciting tool. We finished with a quick live demo of downloading data from Fulcrum and uploading it into CartoDB to show how quick and easy it is.
 Collectively it was a very successful demonstration of how Community Health Mapping can be used by community organizations, educators and students. APTR was a very interesting conference and a great fit for Community Health Mapping. Several conference organizers suggested we teach a Community Health Mapping workshop at next years conference! Looks like we will be back!
