Carto, the platform for making online maps, recently abandoned it's free license option. The reason they gave was that many users were creating accounts, sometimes several accounts, and simply not using them. This became expensive overhead for them to manage. As a result they now offer a Professional or Enterprise plan once your free trial expires. This new pricing scheme is shown below: Note that non-profit organizations receive a 20% discount off this Professional license. This license also affords you many more benefits than the previous free license. For example, the free license gave you 50Mb of cloud storage space while the Professional plan gives you 500Mb. It also allows you to set permissions on your datasets to make them private. It also gives you email and online support.If that price is beyond your organizations budget you will notice that directly below the pricing plan is a section covering FREE Plans for Students and Great Causes!
 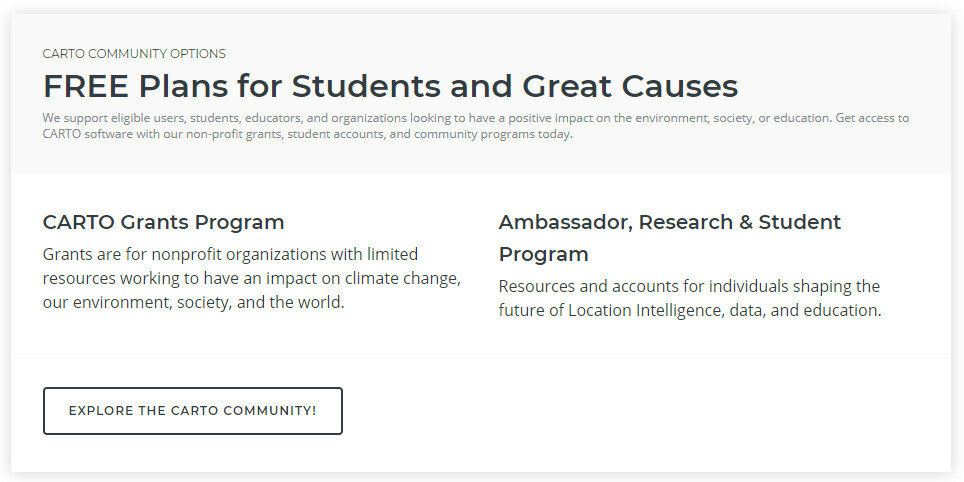 Carto has a grant program. You can read about this program here. All it takes to apply is filling out an application form!
CHM Lab Exercises Updated!
One of the most valuable resources for Community Health Mappers remains the series of lab exercises created two years ago. Our workshops, while effective, are short and only scratch the surface of what you can do with mapping tools. They are basically a quick start guide to Community Health Mapping. The labs however, can be used as a resource to help you build your skills once you've taken the first steps towards mapping your community.The technology changes rapidly. QGIS produces a new stable version every 4 months. Annually QGIS also produces a long-term release. Carto and Fulcrum also update their tools on a regular basis. This mean the lab exercises need to be updated to keep pace.The good news is that this spring the labs were all updated and expanded. There is some foundational knowledge needed to really take the next step after a workshop. The current revised set of labs includes Lab 0: A Community Health Map Introduction and Reference. This lab has background on the Community Health Maps project and the workflow. It also contains a Glossary of GIS terms, and several appendices covering: A) available software, B) data sources and C) everything you need to know to better understand coordinate systems and projection.The remaining labs are as follows:Lab 1 covers field data collection and has been updated to work with Fulcrum. This has allowed us to unify the exercise into one document for both iOS and Android users.Lab 2 shows you how to bring your field data into QGIS. This includes a tour of the QGIS interface, and how to map coordinate data stored in a spreadsheet.Lab 3 is named Combining Field Data with other Organizational Data. It shows you how to work with coordinate systems in QGIS. It also covers how to join tabular data to the attribute table of a GIS layer. This is a step that often has to be done to merge socioeconomic data from the U.S. Census to census geography such as tracts or block groups. It concludes with a lesson on address geocoding. This is the process you use to produce points from addresses.Lab 4 shows you how to do some basic spatial analysis. You learn how to clip data to your study area, measure proximity, query your data to select features and calculate areas/ density.In Lab 5 you learn how to use some of the great data visualization techniques found in only in QGIS. The lab then walks you through how to compose a map. Along the way you learn some data styling tricks and how to use the Print Composer.The series concludes with Lab 6 Data Visualization with Carto. Carto underwent a major update and rebranding since the first edition of these labs were created. You can use this exercise to see how to work with the new Carto Builder interface and tools to create an online map of your results. It covers uploading your data, styling and sharing your map with others.The four labs that deal with QGIS have been updated to include some exciting new features that have been added to QGIS in the last year. Links to the lab data are included. So head to the Resources page and build your Community Health Mapping skills!
GIS as an Educational Tool at MUSC
Submitted by Jennifer RewolinskiDr. Deborah Williamson is an Associate Professor in the College of Nursing at the Medical University of South Carolina (MUSC), Charleston. Dr. Williamson, Community Health Maps (CHM) and MUSC have partnered in providing training that integrates GIS and CHM tools for a high school Teen Health Leadership Program. Dr. Williamson has worked with both community members and students. Dr. Williamson believes that, “GIS has the potential to substantially increase community engagement and is truly a concept of the neighborhood taking control of their data.” She notes that while researchers might study a community, that a community’s input is essential to understanding the cultural and environmental context surrounding health issues: “GIS mapping puts the community members on more of a level playing field with their research partners.” GIS can empower and educate community members to identify their key issues, to become a part of an analysis, and to provide solutions. When communities are given the opportunity to map their own health, discovery, and awareness, positive changes can result. When a community feels it has more of a say through engagement with GIS, or communication with a map, intervention is more likely to be effective.For the past three semesters, Dr. Williamson has used GIS in her own classroom as a capstone project for population health students. They, “find it fun and can take it with them into other settings, it fits into the world of new technology, and it takes people to the next step of looking at health issues.” Mapping offers a different way to help students visualize Social Determinants of Health and to make the connection between what population health is, and the factors that promote or deter it.
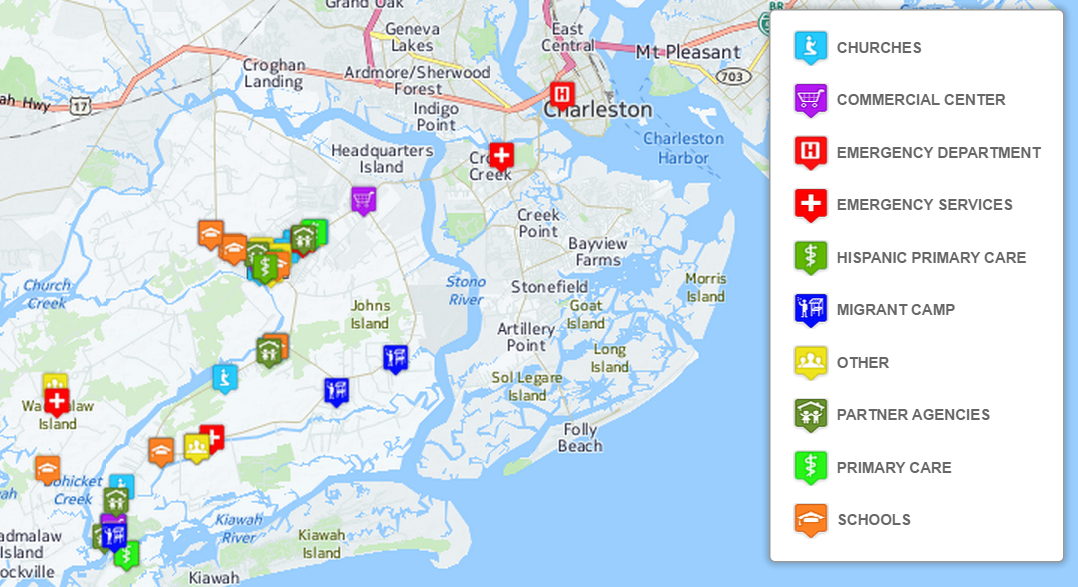
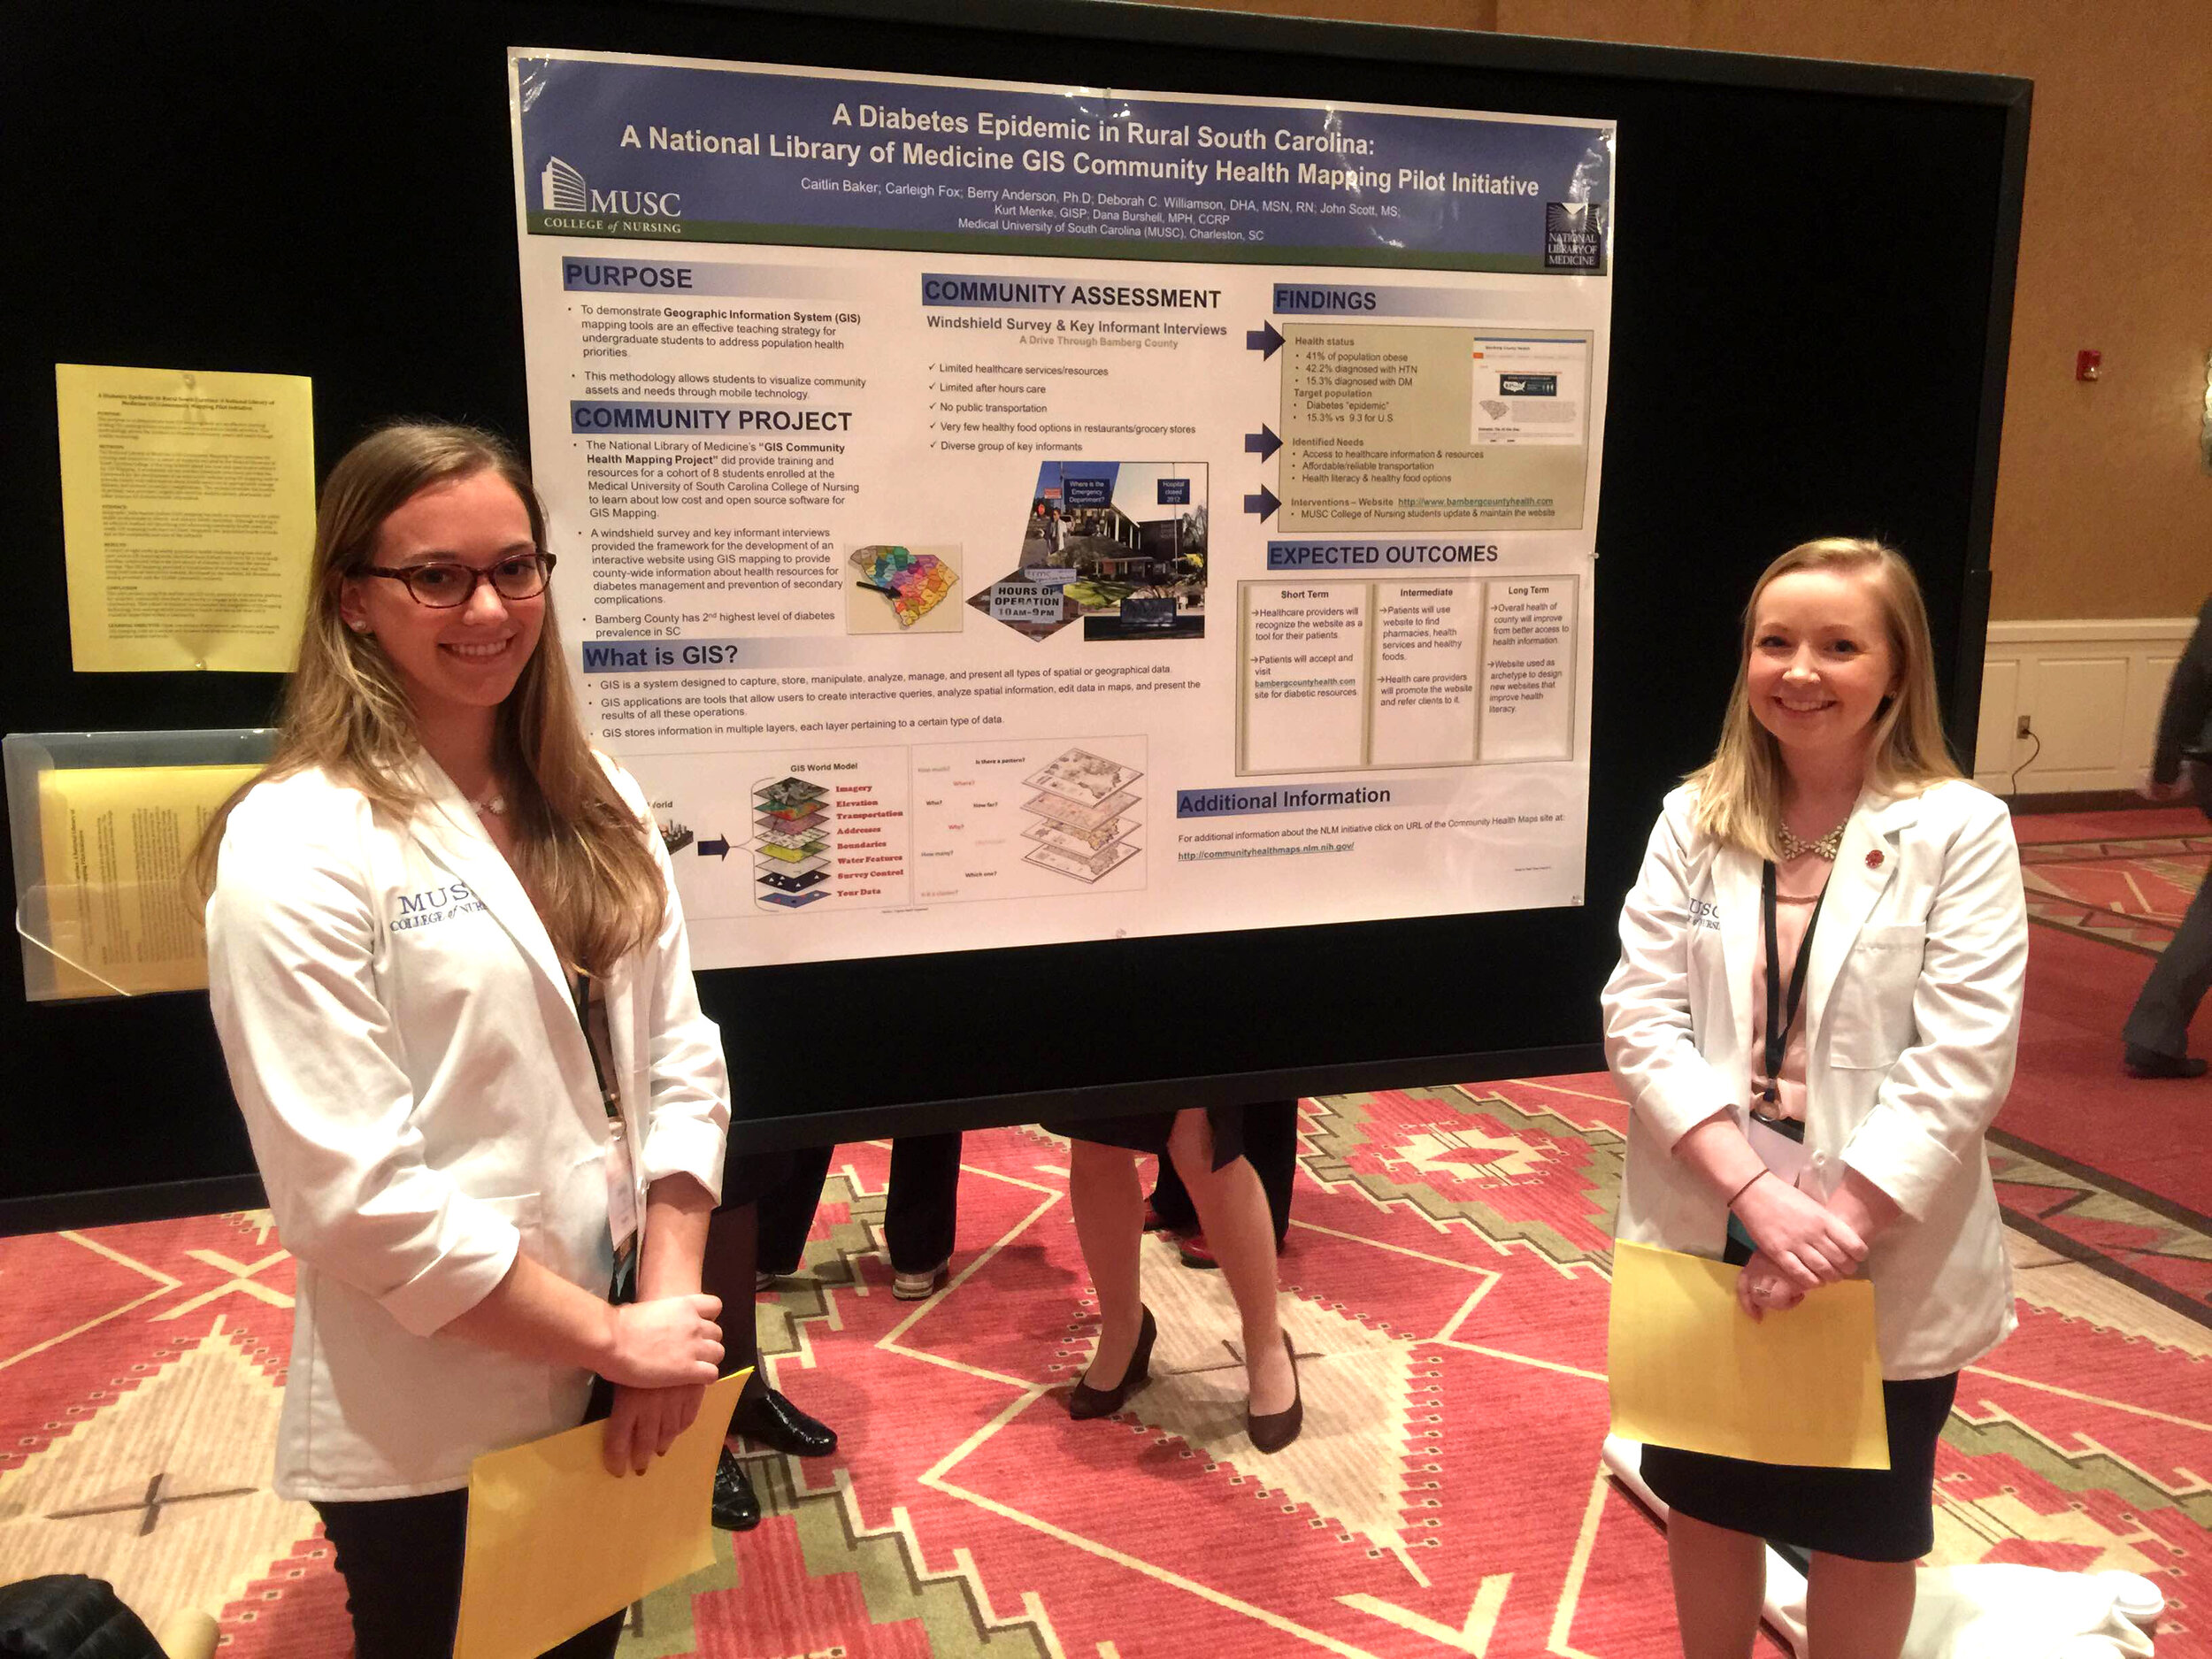 Finally, Dr. Williamson sees GIS as bi-directional: it supports visualizing gaps and assets while also providing the ability to disseminate and build on information via intervention programs to improve health outcomes and strengthen communities. GIS is also broadly applicable to almost any discipline and easily used by those with little expertise. “Presenting raw data to a community or students doesn’t mean a lot,” Dr. Williamson comments, “but when that same data is aggregated visually it instantly communicates a message to any audience.” GIS is clearly suitable as an effective educational tool in the classroom and in communities.CHM thanks Dr. Williamson for her continued collaboration and time spent advancing the CHM program through use of the CHM tools at MUSC. CHM values our partnership with MUSC and hope that the future is as mutually beneficial as the past few years.Field data collection for the CHM workflow bridges the divide between learning in a classroom and experiencing conditions in a community. For the capstone project, students use CHM labs and parts of the CHM workflow, including phone data collection with iForm or Fulcrum, integration of the data into QGIS, and presenting the data with Carto or Google Maps. Dr. Williamson’s students often upload their data from iForm to Google Maps because of its familiarity and easy access.One student project involved identifying migrant camps as a community in need, and assessing the community through surveys and key informant interviews. When the data showed that migrant workers often lack knowledge of health information and access to healthcare services, students mapped locations of migrant camps near Charleston, SC in relation to urgent care facilities and shared the data with the migrant outreach workers from a local community health center. Later, an intervention was developed to provide hands on CPR and first aid instruction to 60 workers. This project displays successful application of CHM tools in an educational and community context resulting in an intervention that may offer real change.
CHM Workshop at the National Tribal Forum in Spokane, WA
This week the Community Health Maps team is heading to Spokane, Washington to teach a workshop at the National Tribal Forum for Excellence in Community Health Practice! We are honored to participate and engage a new community of mappers. It is a four hour workshop and by the end attendees will have:
- Built their own data collection form in Fulcrum
- Gone outside and collected some points
- Made an online map of what they collected in Carto
- Learned how to work with QGIS!
We'll report back on how it goes when we return. Stay tuned!
CartoDB Rebranded as Carto
Community Health Maps has long recommended the use of CartoDB for those interested in low cost online mapping and data visualization. In fact, CHM caught the beginning of this wave because CartoDB wasn't even launched until 2012! Early last month (July 2016) CartoDB was rebranded as Carto, which includes a new logo. However, once you get beyond the new logo your current account page including your data and maps remains unchanged. You can still build maps the way you always have in what is now known as Carto Editor.
 The main difference is that Carto now offers up a new interface named Carto Builder. The good news for Community Health Mappers is that their goal with Carto Builder is to introduce an updated interface. One that still does not require complex geospatial skills and programming. With Carto Builder they aim to make Location Intelligence (LI) more accessible to more people. This means it will give you point and click access to deeper analysis of your data. Builder will have all the functionality currently found in Editor along with the new tools.Eventually Carto Editor will be phased out and Carto Builder will be the interface everyone uses. You can request early access to Carto Builder here: http://go.carto.com/request-beta-access. New users of Carto will be given access the the Carto Builder in phases, over the next several months. All existing maps and data will be seamlessly migrated to the new interface. The following page answers Frequently Asked Questions about the migration from Editor to Builder: https://carto.com/docs/carto-builder/faqs/Once the migration is complete I will post about the new functionality. Stay tuned!
