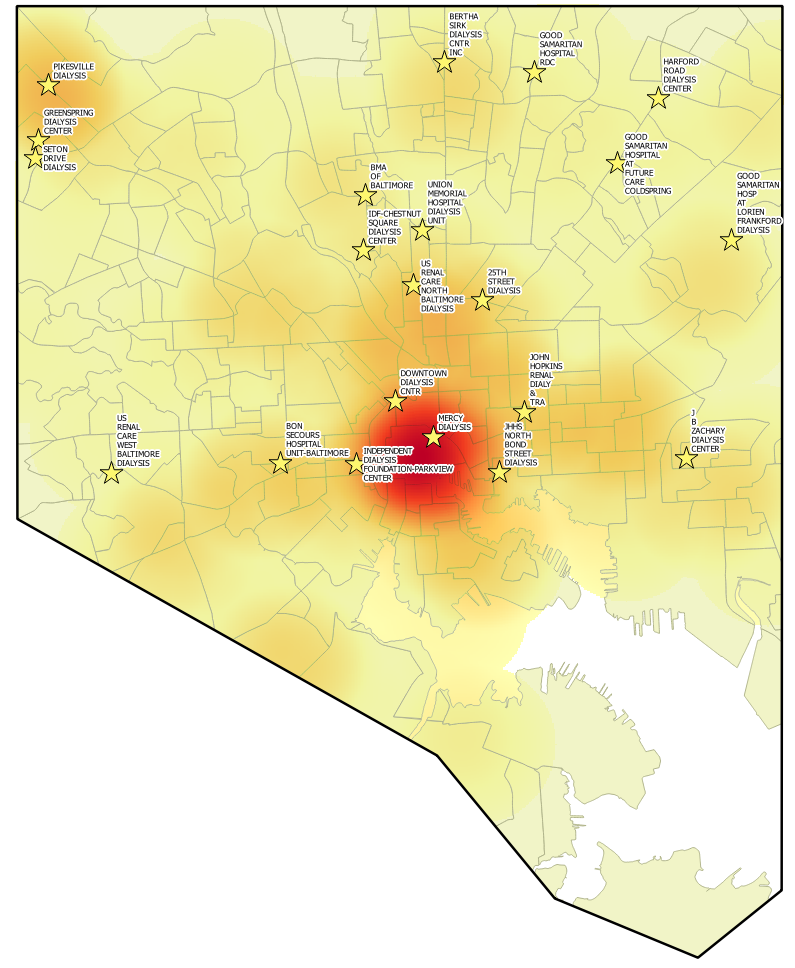
Last week Community Health Maps traveled to Boulder, Colorado to teach a pre-conference workshop at Rising Voices 7. The theme was Converging Voices: Building relationships and practices for intercultural science. The conference was hosted by the National Center for Atmospheric Research (NCAR). The workshop was well attended with about two dozen participants representing numerous AI/AN tribes and other organizations. These workshop was part of the Community Health Maps project and was funded by the National Library of Medicine (funding for the workshop was provided under a sub-award from the National Library of Medicine to ICF International).The goal of Rising Voices is to "advance science through collaborations". Participants learn how indigenous and western scientific knowledge systems can compliment one another and advance our understanding of important issues in our communities. The focus is on climate.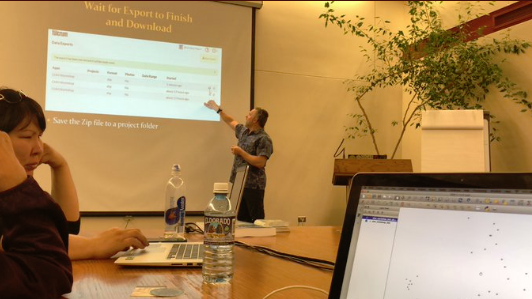 At three hours the workshop was slightly shorter than normal. This allowed us to focus on field data collection with Fulcrum and web mapping with Carto. With a few minutes to spare Kurt Menke shared QGIS. Since he didn't have time to really demonstrate the use of QGIS he focused on the open source aspect. As an open source project, QGIS is both GIS software and a community. As such it aligns with the ethics many communities try to foster at Rising Voices.
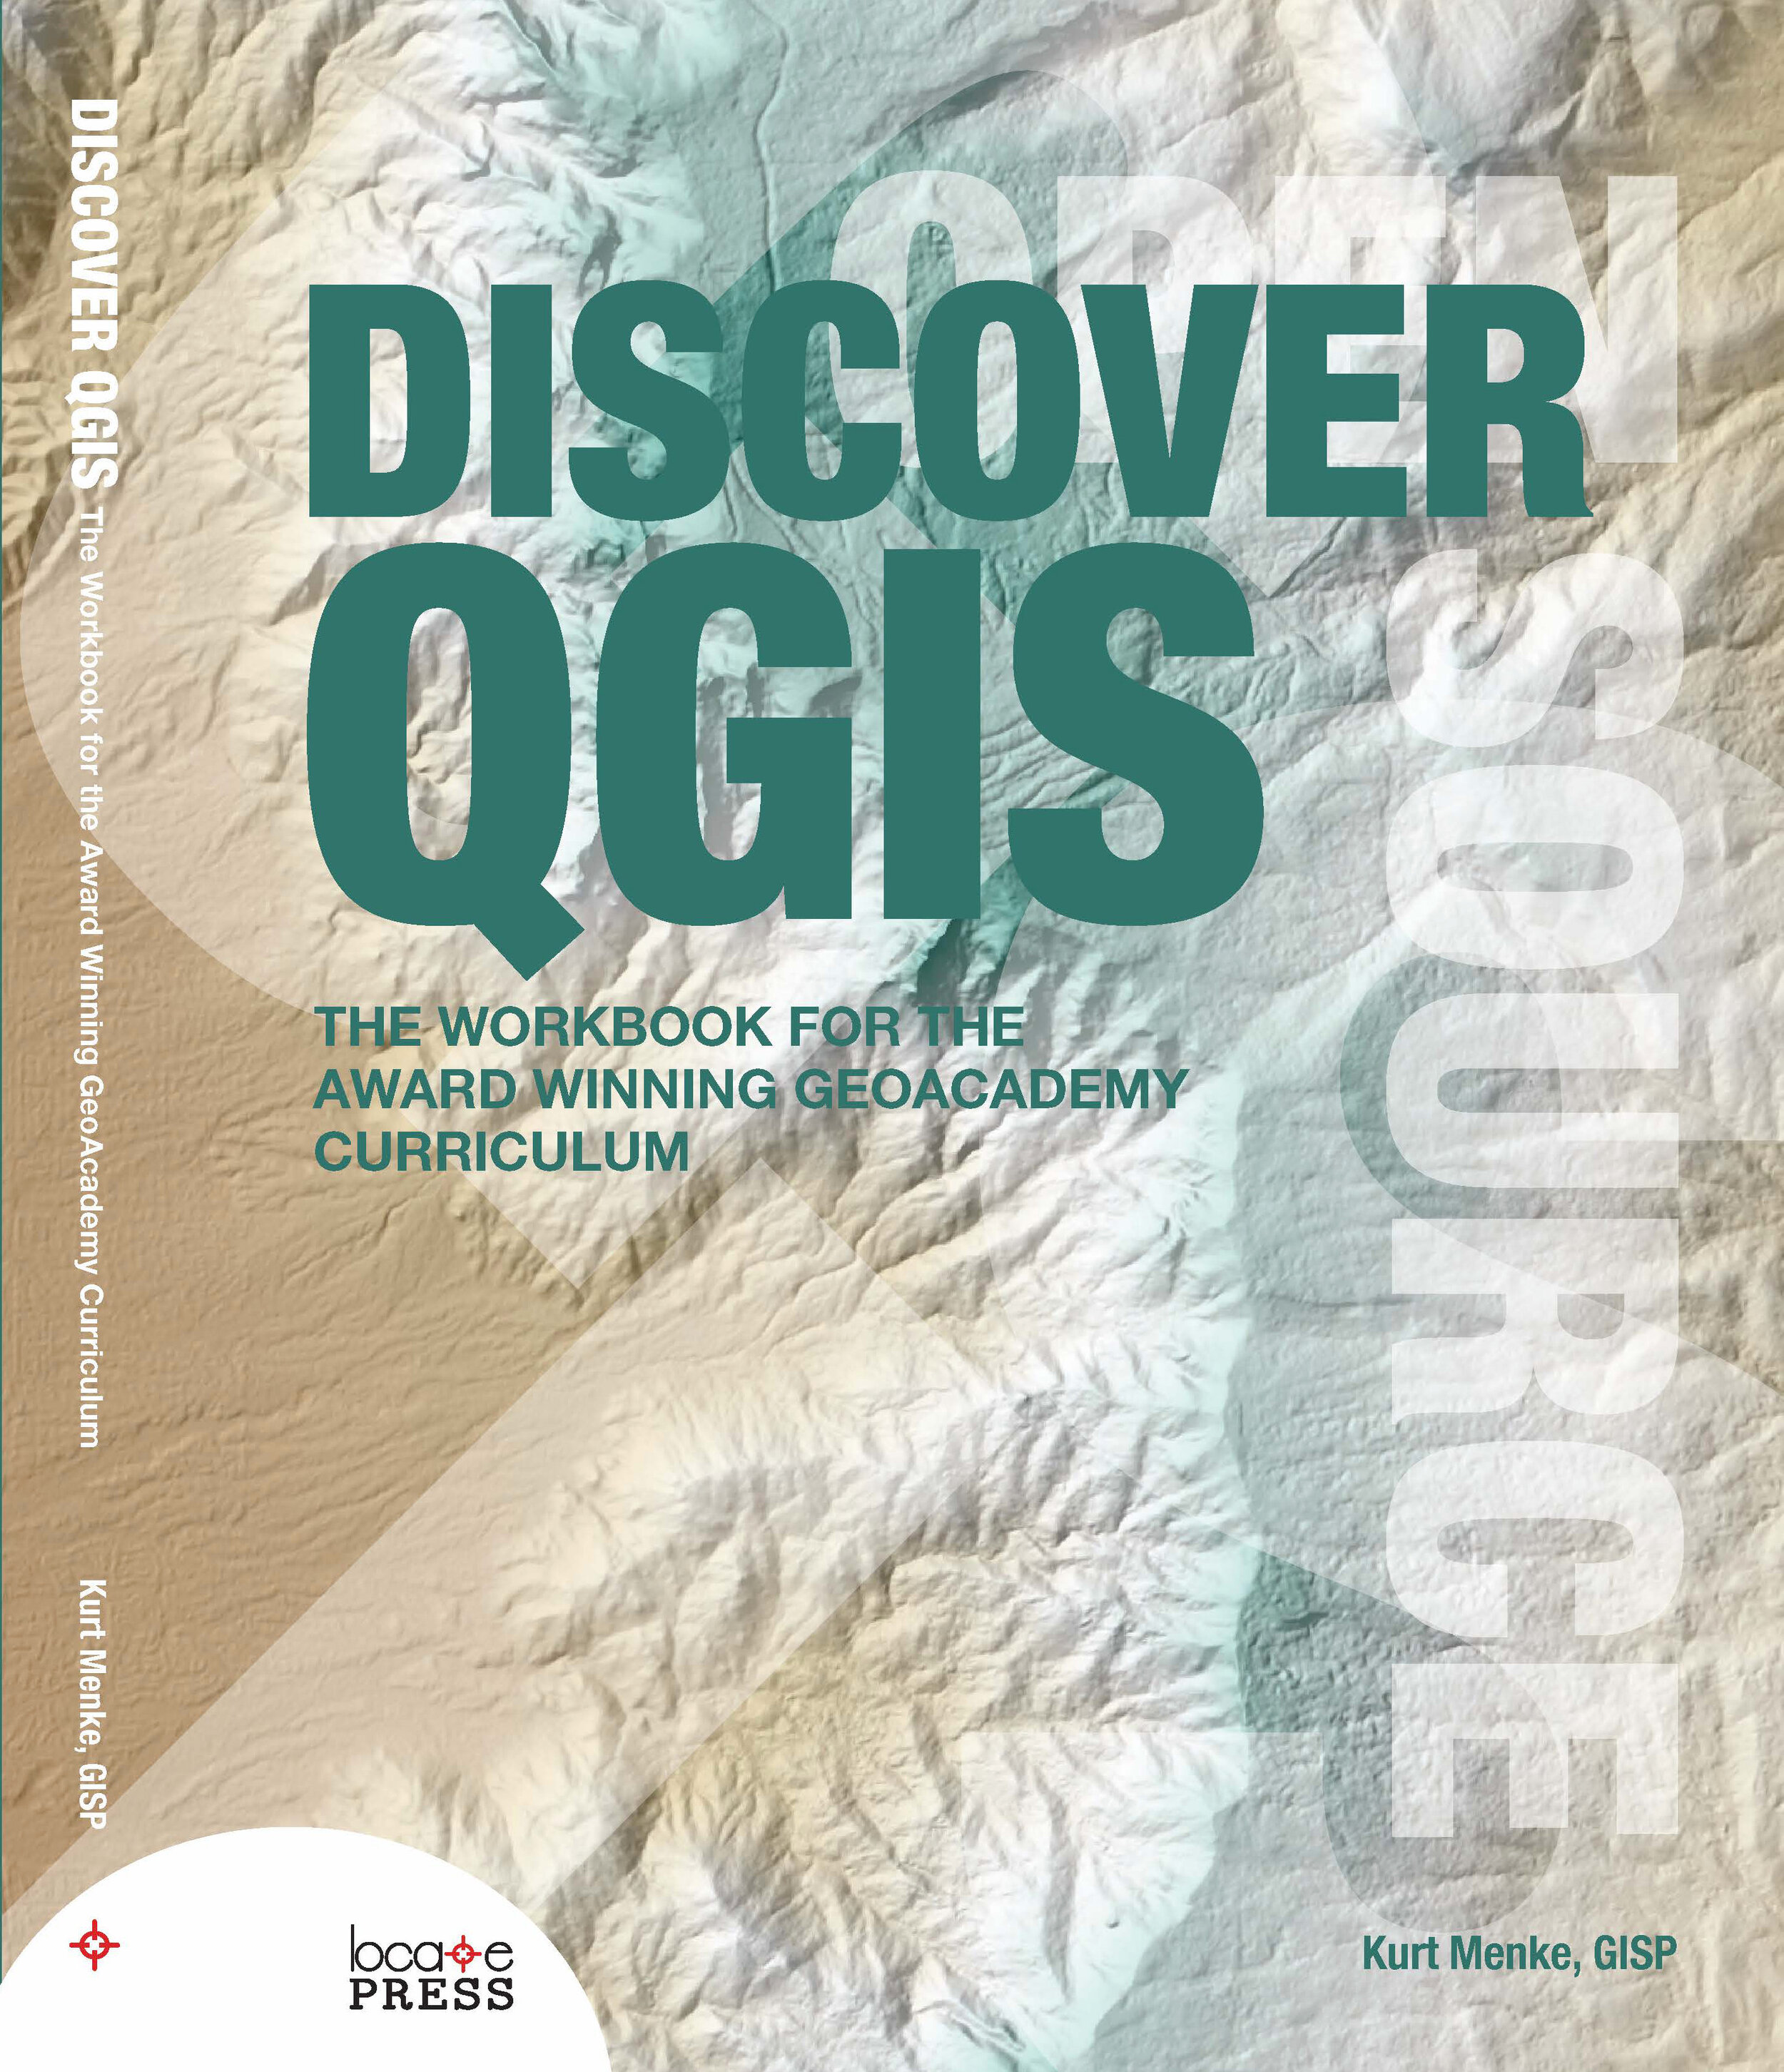
Discover QGIS 3.x - A Workbook for Classroom or Independent Study
Today Discover QGIS 3.x was published by Locate Press. Authored by Community Health Mapper Kurt Menke, this is an update of the original title, using QGIS v3.6 and covering spatial analysis, data management, and cartography. It is designed to teach mapping and GIS using QGIS. As such it begins with basics. It is a comprehensive up-to-date workbook built for both the classroom and professionals looking to build their skills.It is designed to take advantage of the latest QGIS features, and will guide you in improving your maps and analysis.The book is a complete resource and includes:
- Lab exercises
- Challenge exercises
- All data, discussion questions, and solutions
What's new in this edition:
- Updated to QGIS 3.6
- Fifteen new exercises
- A new section, Advanced Data Visualization, covering:
- Blending modes
- Live layer effects
- Geometry generators
- Rendering Points
- Time Manager
- Native 3D
- Mesh data
- Appendices covering:
- Keyboard shortcuts
- Useful Plugins
- Getting involved
To see what's included in the book, download the Table of Contents (PDF). Discover QGIS 3.x is available in color as an ebook or paper back.
A Preview of Coming Attractions
2019 is off to a fast start with the Community Health Maps program!The QGIS portion of the CHM labs found on the Resources page are being updated. Look for these in the next several weeks. These were last updated in 2017. In one month a new long-term release of QGIS will be released: QGIS 3.6. This will be the first long-term release of the 3.x line. If you have not yet switched over to QGIS 3.x, March will be the time to do so. At this time 2.x line will be officially retired. You can revisit last years blog about what's new in QGIS 3 to see the sort of features now available. I will be posting an post next month about what you need to know about QGIS 3.6, as well as an announcement when the new training materials have been completed.There are a series of QGIS workshops scheduled for the spring:April 2 - University of Michigan Ann ArborApril 3 - University of Michigan FlintApril 4 - University of Michigan Detroit CenterApril 5 - University of Michigan DearbornMay 14 - Rising Voices 7 - Converging Voices: Building relationships and practices for intercultural science. - Boulder ColoradoJune 3-7 - ASTHO Climate and Health SummitJune 17-21 - ASTHO CHM and Vector Borne Disease WorkshopHappy Mapping! I hope to see you in the new year!
Try Out the New Community Health Maps (CHM) Online Tutorial!
By Colette HochsteinA Community Health Maps (CHM) online tutorial is now available. It is a free, self-paced online course from the National Library of Medicine (NLM), which provides guidance on using low cost mapping tools to collect, analyze, and visualize mapping data.Community Health Maps seeks to empower communities and individuals by helping them collect and map health-related data. The CHM tutorial helps users build a plan to collect data, create forms to capture data points, and use mobile devices to collect data. The CHM tutorial can also aid in creating online and printable maps that can be customized to meet the needs of specific populations and stakeholders.The tutorial covers how to create a basic workflow for collecting and mapping field data via step-by-step instructions on how to (1) develop a data collection form, (2) collect field data according to the data collection plan, (3) create online dynamic maps of the data collected, and (4) create static offline publishable maps of field data using desktop software.As a bonus, this course provides continuing education credit (CE), including through the Medical Library Association (MLA, http://www.medlib-ed.org/products/1847/community-health-maps), and/or a certificate of completion. For continuing education credits and/or a certificate of completion, please enroll in the course on the free Learning Management System (LMS).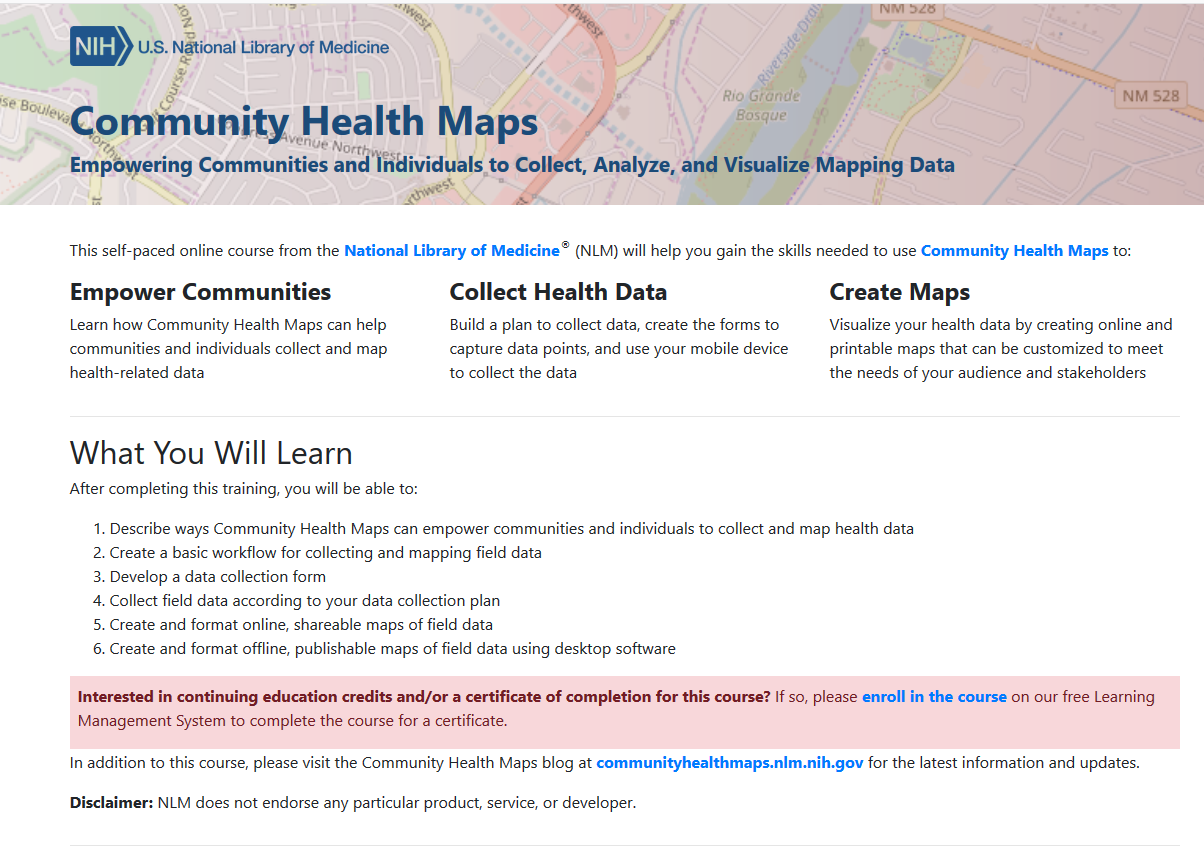 If you are new to Community Health Maps, and are not sure how this mapping workflow can benefit you and your organization, you can search this blog for case studies. In particular you may want to look at the selected case studies linked to below. Read about how students and professionals have used Community Health Maps:
- Mapping South Florida's King Tides
- GIS as an Educational Tool at MUSC
- Exploring Accessibility and Sustainability at the University of Maryland School of Public Health
- Association for Prevention and Teaching Research Conference (APTR)
UMD Students Learn How to Map Health Issues
By Angela Kim & Colette HochsteinOn October 4, 2018, National Library of Medicine® (NLM) Research Assistant Julian Argoti and University of Maryland (UMD), School of Public Health intern Angela Kim spoke to the “Professional Preparation in Community Health” class at the University of Maryland, School of Public Health, College Park. The 75-minute class was attended by approximately 45 undergraduate students in the UMD Behavioral and Community Health (BCH) program. The presenters introduced NLM’s Community Health Maps (CHM) blog and facilitated a hands-on activity.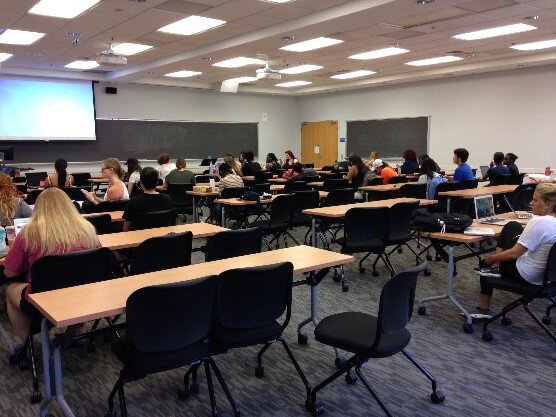 The presentation covered a basic introduction to the tools and workflow in CHM. The students were asked to use Fulcrum, a low-cost tool, to build a custom data collection form for the first step of the CHM workflow – data collection. They discovered first-hand how intuitive the tool is. After creating their own custom data collection form on the topic of their choice, the students left the classroom to collect data points around the School of Public Health building.
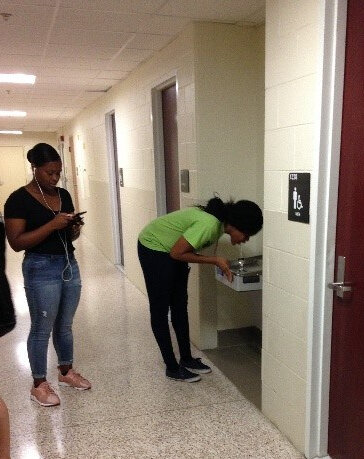 On their return, the students explored maps of their data points on Fulcrum. Many noted that the process of collecting data points was easy and fun. UMD Professor James Butler mentioned that although drinking a good amount of water is emphasized at the School of Public Health, he had not previously noticed that there is no water fountain near the faculty lounge. His comment underscored that issues are often not observed until actively examined, as during the mapping process.
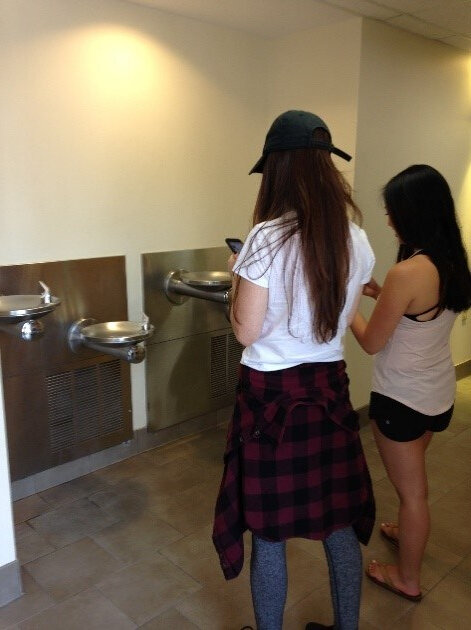 The class ended with Professor Butler concluding the class by reiterating how CHM can serve as a useful tool for visualizing many of the different health issues discussed in class.The students were alerted to the free new online Community Health Maps online tutorial, a self-paced course from the NLM designed to help users gain the skills needed to use Community Health Maps.
CHM Lab Exercises Updated!
One of the most valuable resources for Community Health Mappers remains the series of lab exercises created two years ago. Our workshops, while effective, are short and only scratch the surface of what you can do with mapping tools. They are basically a quick start guide to Community Health Mapping. The labs however, can be used as a resource to help you build your skills once you've taken the first steps towards mapping your community.The technology changes rapidly. QGIS produces a new stable version every 4 months. Annually QGIS also produces a long-term release. Carto and Fulcrum also update their tools on a regular basis. This mean the lab exercises need to be updated to keep pace.The good news is that this spring the labs were all updated and expanded. There is some foundational knowledge needed to really take the next step after a workshop. The current revised set of labs includes Lab 0: A Community Health Map Introduction and Reference. This lab has background on the Community Health Maps project and the workflow. It also contains a Glossary of GIS terms, and several appendices covering: A) available software, B) data sources and C) everything you need to know to better understand coordinate systems and projection.The remaining labs are as follows:Lab 1 covers field data collection and has been updated to work with Fulcrum. This has allowed us to unify the exercise into one document for both iOS and Android users.Lab 2 shows you how to bring your field data into QGIS. This includes a tour of the QGIS interface, and how to map coordinate data stored in a spreadsheet.Lab 3 is named Combining Field Data with other Organizational Data. It shows you how to work with coordinate systems in QGIS. It also covers how to join tabular data to the attribute table of a GIS layer. This is a step that often has to be done to merge socioeconomic data from the U.S. Census to census geography such as tracts or block groups. It concludes with a lesson on address geocoding. This is the process you use to produce points from addresses.Lab 4 shows you how to do some basic spatial analysis. You learn how to clip data to your study area, measure proximity, query your data to select features and calculate areas/ density.In Lab 5 you learn how to use some of the great data visualization techniques found in only in QGIS. The lab then walks you through how to compose a map. Along the way you learn some data styling tricks and how to use the Print Composer.The series concludes with Lab 6 Data Visualization with Carto. Carto underwent a major update and rebranding since the first edition of these labs were created. You can use this exercise to see how to work with the new Carto Builder interface and tools to create an online map of your results. It covers uploading your data, styling and sharing your map with others.The four labs that deal with QGIS have been updated to include some exciting new features that have been added to QGIS in the last year. Links to the lab data are included. So head to the Resources page and build your Community Health Mapping skills!
Remembering a Community Health Maps Milestone
By John Scott (CPSC)In June 2016, a Community Health Maps (CHM) symposium was convened by the Center for Public Service Communications and Health-Equity.Org. It was hosted by the National Library of Medicine and held at Lister Hall on the grounds of the National Institutes of Health campus in Bethesda, Maryland.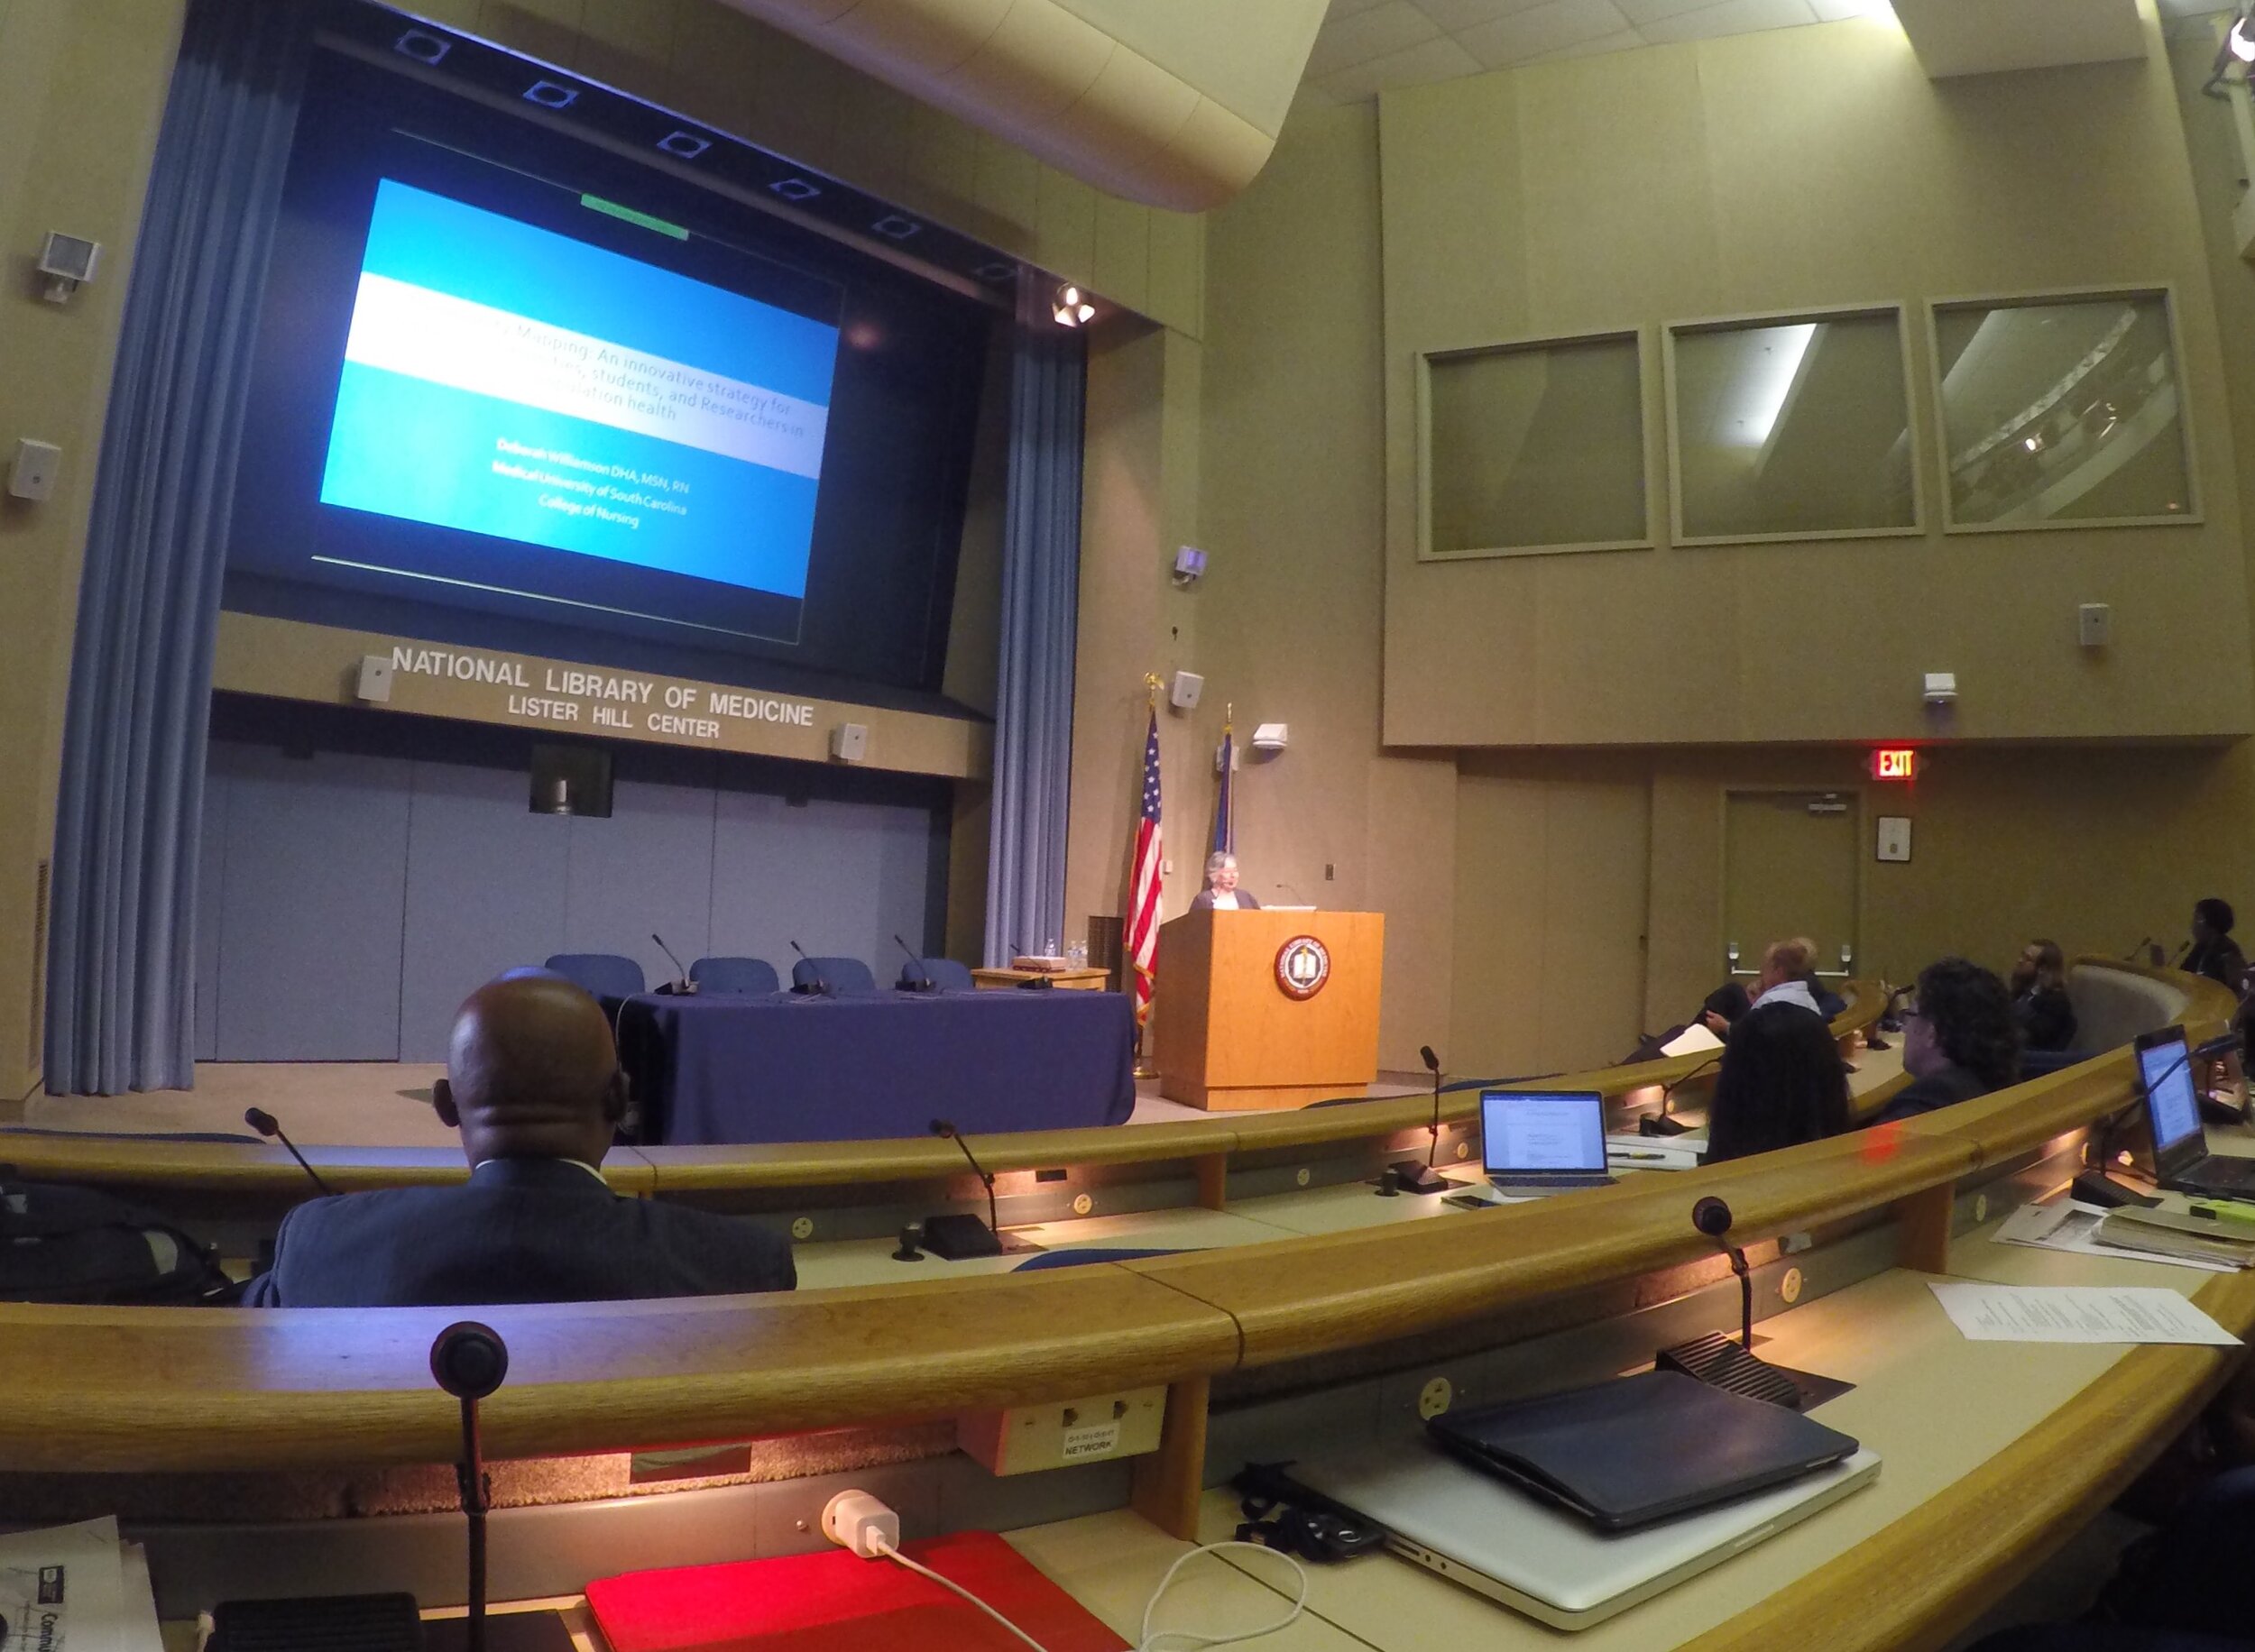 The relevance of the CHM initiative to NLM’s mission has to do with improving the ability of community-oriented organizations (and researchers and other public health professionals) to collect, organize and visualize data and other health information to better-understand health conditions and support decision-making for resource allocation. While access to quality health information is frequently a focus of attention, the ability to visualize data and information -- to better understand and portray their significance to the community -- has received less attention. This is in part because the availability of affordable GIS platforms and data collection and visualization applications is relatively recent. Historically, the cost to procure platforms and applications, to train users and to sustain operations has been prohibitive for communities and community-based organizations whose health budgets are already strained.The purpose of the workshop, therefore was to share the CHM workflow with community-based and minority health organizations so that they would be in a better position to serve their populations by knowing how to collect and maintain their own data, rather than -- or at least in addition to -- having to rely solely on national/state agencies or majority-institution partners to provide data to them.Participating were seventy-six community-oriented health professionals who were drawn from throughout the country. The workshop was made possible with funding by the Robert Wood Johnson Foundation. During the workshop several Community Health Mapping pilot projects were highlighted, including:
- Obesity research at the University of Hawai’i School of Medicine’s Department of Native Hawaiian Health
- Research on noise pollution at the Seattle Indian Health Board/Urban Indian Health Institute
- Projects including a youth initiative measuring community water quality
- Smoking cessation
- Access to health care by migrant workers
- Building a zika awareness curriculum at the Medical University of South Carolina
- University of Washington School of Public Health graduate student capstone projects featuring the CHM workflow.
- Mapping Curb Ramp Accessibility around a Silver Spring, MD Assisted Living Facility
- Visualizing an Intervention for Tobacco Control
- Teens Map Environmental Health of Their Community (Sea Islands, South Carolina)
Kurt Menke, of Bird’s Eye View GIS, and CHM partner, also offered training in the use of CHM tools in five parts:
- Introduction to Community Health Maps
- Learn to use Fulcrum to build a data collection form
- Exercise using data collection form to collect data around the conference center
- Mapping data collected during previous exercise online in Carto
- Brief introduction to mapping the data in QGIS
Learning Objectives for the training session were:
- Describe the Community Health Maps workflow which includes low-cost and open resources for community mapping and data visualization.
- Create a data collection tool on a mobile device that can be used to collect community data.
- Learn how to map data collected online in and on the desktop.
Workshop participants were also introduced to the recently developed set of six online “labs”:
- Field Data Collection
- Bringing Field Data into QGIS
- Combining Field Data with other Organizational Data
- Basic Spatial Analysis
- Cartography with QGIS
- Data Visualization with Carto
These labs are now available on the Community Health Maps Resources page.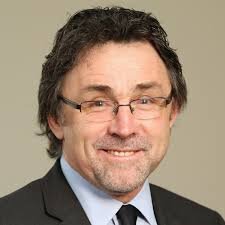 Other highlights of the workshop include a keynote presentation by Dr. John P Wilson, Professor and Director of the Spatial Sciences Institute at USC Dana and David Dornsife College of Letters, Arts and Sciences, University of Southern California. His talk was titled, "Community Health Mapping: In a World Awash with Geographic Data and Tools." His presentation can be downloaded here as a PDF (3.86Mb).
 Also presenting was John Balbus, M.D., M.P.H., Senior Advisor for Public Health and Director of the National Institute for Environmental Health Science-WHO Collaborating Centre for Environmental Health Sciences at the National Institutes of Health. His presentation was "From the Pump Handle to Hazardous Waste: Mapping Environmental Health and Justice." It can be downloaded here as a PDF (3.48Mb)
Q & A with Kurt Menke, CHM Moderator
By Jenny Rewolinski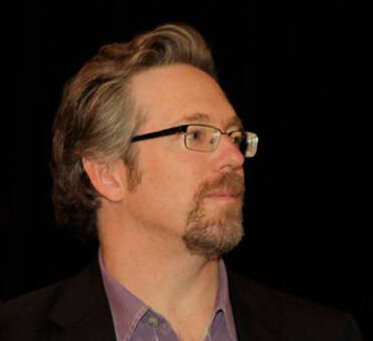 The following is a question and answer interview with the moderator of the with Community Health Maps (CHM) blog, Kurt Menke, GISP (Certified geographic information systems (GIS) professional). Kurt has worked with CHM since its inception in 2014 and is a valuable resource for users of CHM.What is your background? Kurt: I started out as an archaeologist. I spent 8 years in the desert southwest working on Anasazi pueblo archaeology. I went on to receive a Masters in Geography from the University of New Mexico in 2000. While in graduate school I began working at the UNM’s Earth Data Analysis Center (EDAC). That's where I really learned about GIS. I worked there for 11 years as a GIS Analyst/Programmer.When did you being using open source GIS?It was at EDAC, about 15 years ago, when I was first exposed to open source mapping software. We began using Mapserver for web mapping applications, because it was faster and more stable than the Esri alternative. I realized there was a whole ecosystem of open source tools out there.How did you first come to work with NLM?Kurt: John Scott, President of the Center for Public Service Communications and I have collaborated on health related projects with NLM for over 10 years. We first met while I was working at EDAC on a project with the National Indian Council on Aging (NICOA). I had developed an app named the Interactive Health Atlas. That project eventually ended and I left the university to create my business Bird’s Eye View. John thought we should take the best parts of the NICOA project to the National Library of Medicine (NLM). It evolved into what we called the Health Equity Atlas. This was custom software we developed, which was really time consuming. It worked great, but wasn’t widely adopted. We learned a valuable lesson, for something like this to be successful, it needs to be something organizations are asking for. No matter how useful it may be, if people don't have time for it, it will just sit on the shelf.How did CHM begin?Kurt: In 2012, John asked me to look at existing smart phone apps. His idea was, rather than developing a completely new application, we could use existing low cost software. Plus we would work with organizations who had mapping as a defined need. I ended up completing a thorough survey of smartphone data collection tools and some of them were perfect. I identified what I thought were the two or three best. We realized we could stitch together a series of low cost intuitive tools that collectively address everyone’s mapping needs.We settled on Fulcrum, QGIS, and Carto as our core CHM workflow tools. We started with pilot projects at the University of Hawaii and the Urban Indian Health Institute in Seattle. Showing people how to use these tools via a train-the-trainer approach ended up working really well.You are a QGIS expert. When did you first begin using QGIS?Kurt: QGIS was started in 2002 and I began playing with it in 2005. I just discovered it from
 a listserv. At first it was very limited, being little more than a data viewer. But I was really curious to see how it might evolve, so I started following it. It really started becoming a useful alternative in 2010. I gradually migrated to it with my business. I also started teaching GIS classes with it. I used to keep a list of things you could do with ArcGIS that you couldn't in QGIS. Now it's come so far that I have a list of things you can do in QGIS that you can't in ArcGIS!How has CHM evolved?Kurt: Once we realized we had something that would be useful to people, we began looking for partner organizations. These are organizations who work with data and can benefit from mapping, but lack the resources to get started. We conduct workshops and webinars to get people started down the mapping path.Along the way I thought a blog would be a really helpful tool to keep people up to date with new technology. These tools are constantly improving and I thought this would be a way to share these enhancements with everyone. Later we realized we needed additional resources for people to continue to build their skills after the initial workshops. I developed a series of six labs covering the mapping tools in more detail. These labs were inspired from a separate project I worked on called the GeoAcademy. This is a complete college curriculum for teaching GIS using open source tools. It even won an award!
 Our primary goal for CHM has always been to provide tools that are helpful to users. After years of trying to build something from scratch, we are now finally gaining some traction with CHM. It feels like a snowball, rolling downhill and gaining speed. I believe it is both because the tools are powerful and intuitive, plus we are getting better at identifying potential users.Would you recount one experience with CHM that felt especially influential for CHM’s progress so far? Kurt: Yes the first thing that comes to mind is the work with the Medical University of
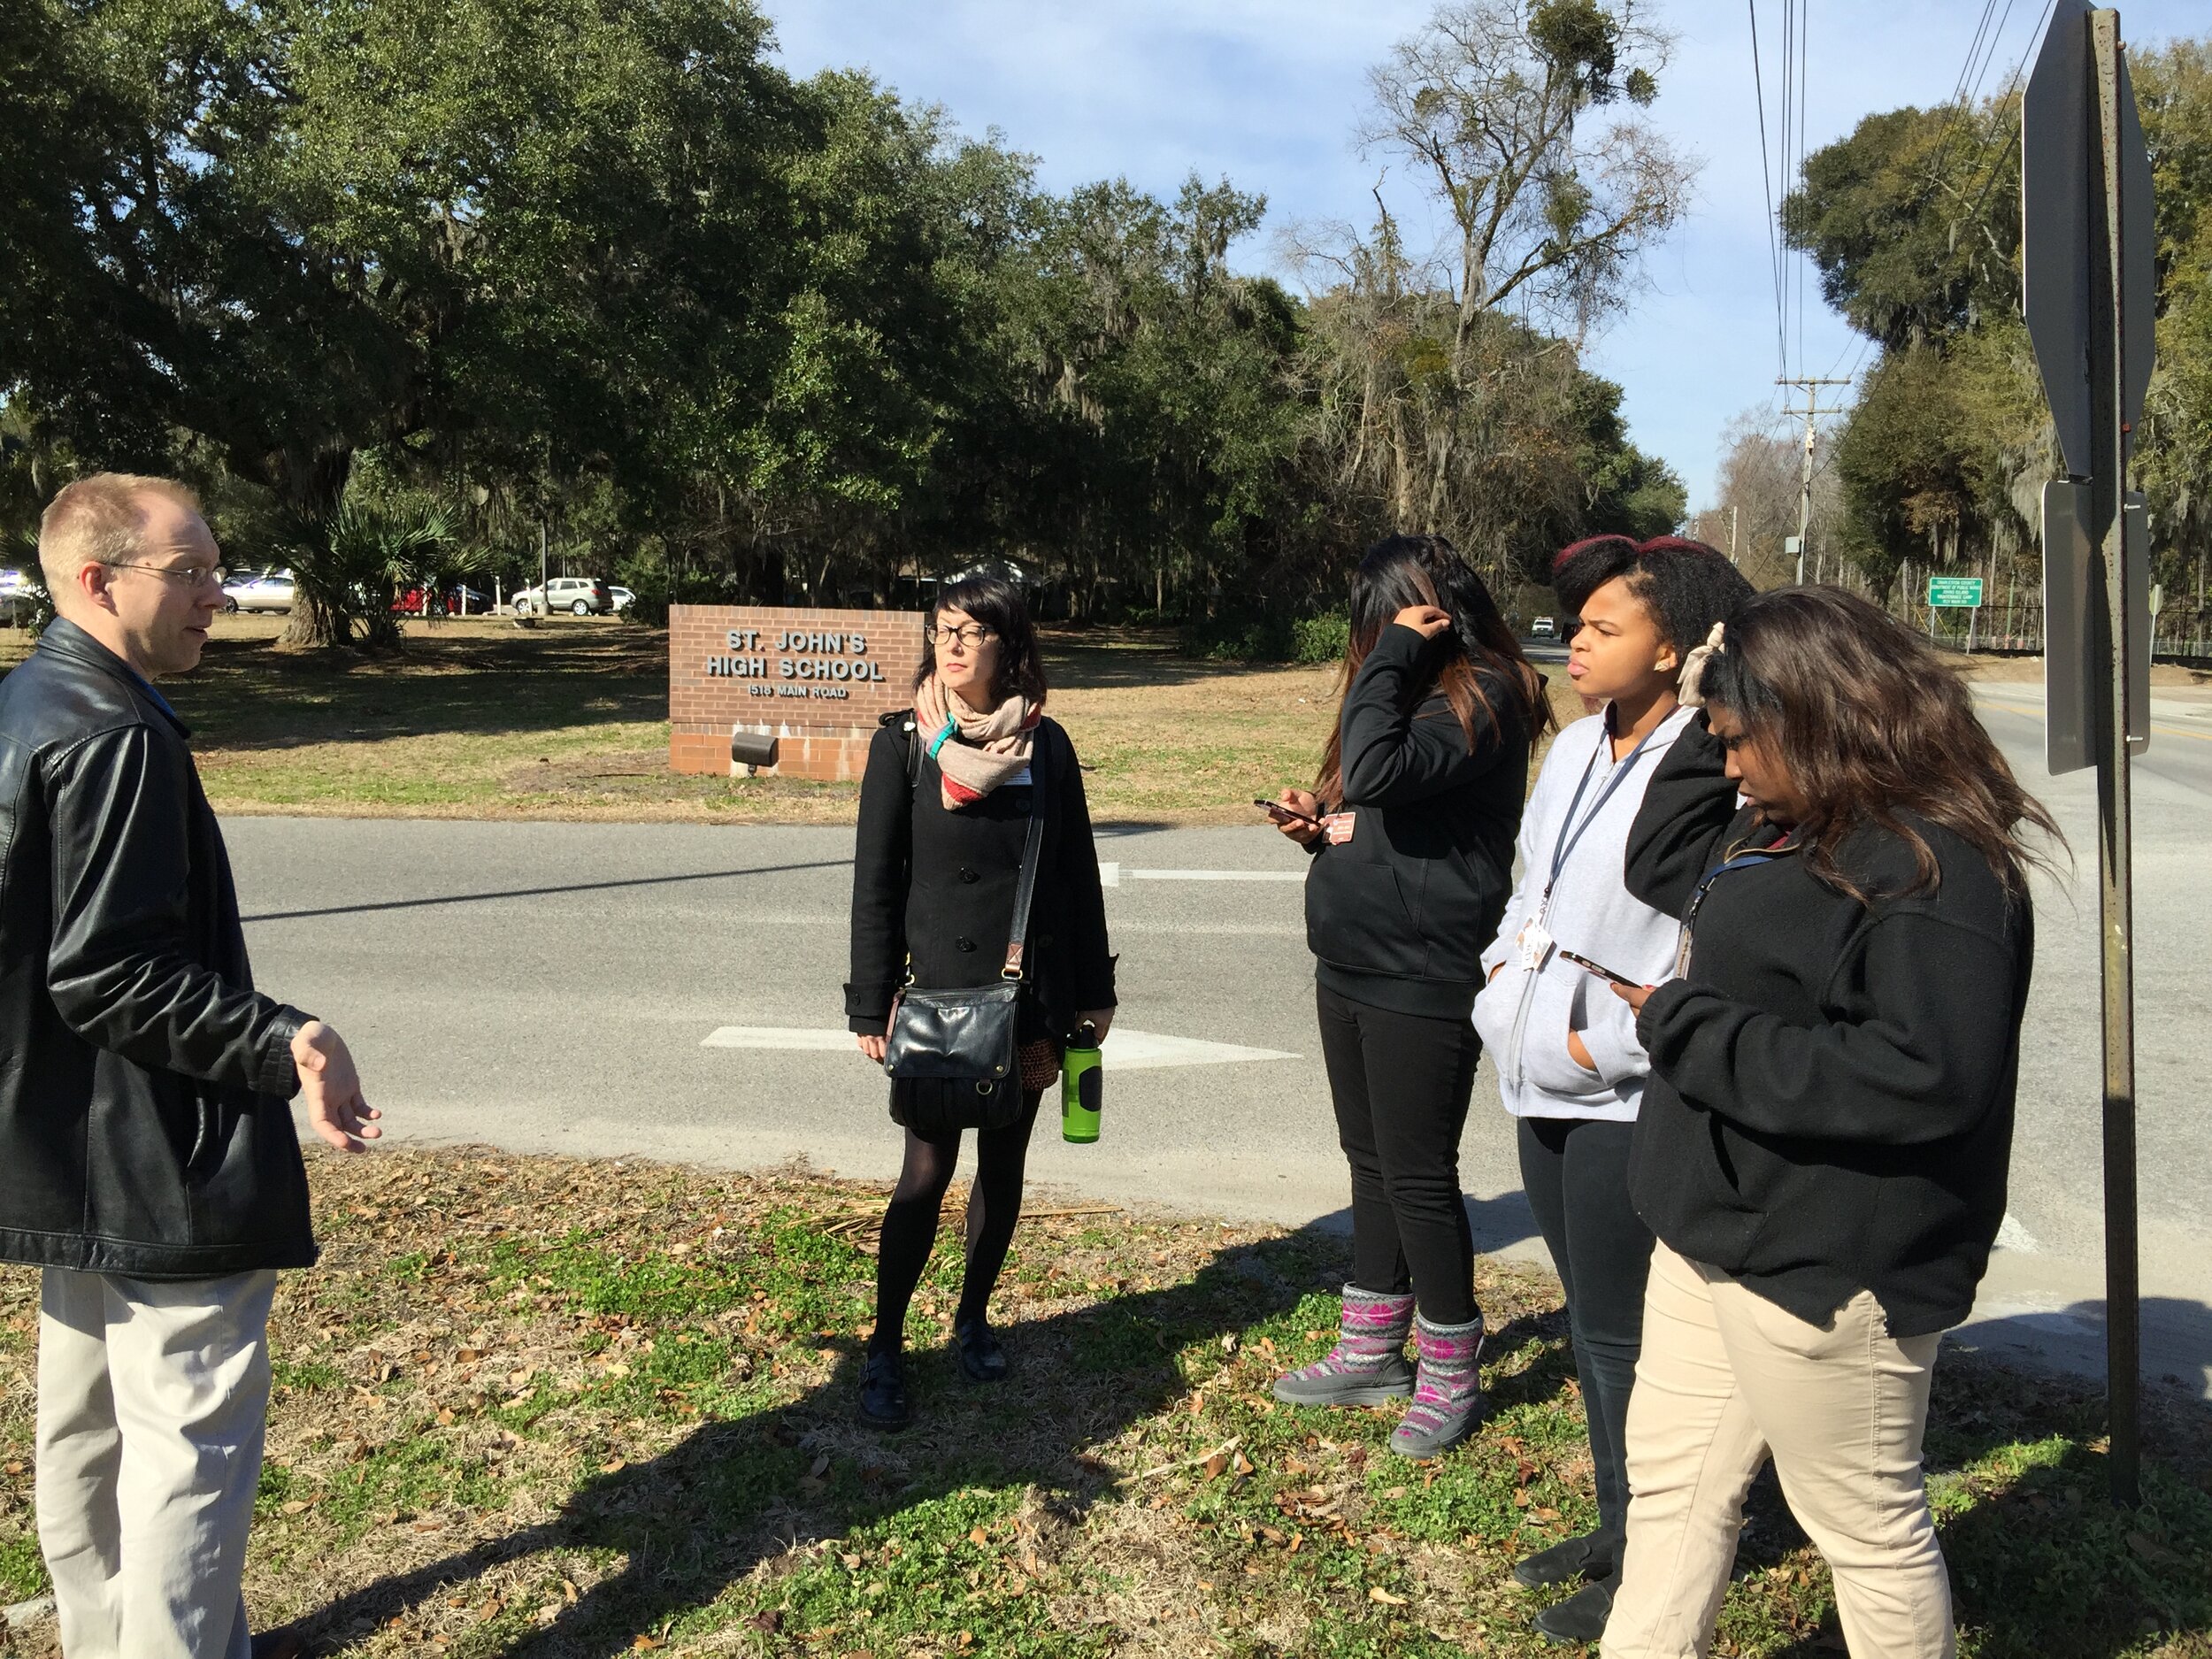 South Carolina (MUSC). In early 2015 I taught a CHM workshop to 8 people. The training went well. No one in attendance had ever worked with any type of mapping software before. Yet I was able to show them how to make a data collection form, collect points, and map the data in Carto. The next day I went to a high school on John’s Island and taught several students over their lunch break how to collect data. They picked up on it immediately and spent the semester mapping food and water locations on the island.Months later, the MUSC participants were so excited by the possibilities that they asked me to come back. This second training had 25 people. Later that year we came back for a third workshop, and 80 people from across MUSC attended! That I could show such a large group, how to work with these tools in a half day was a real proof of concept!
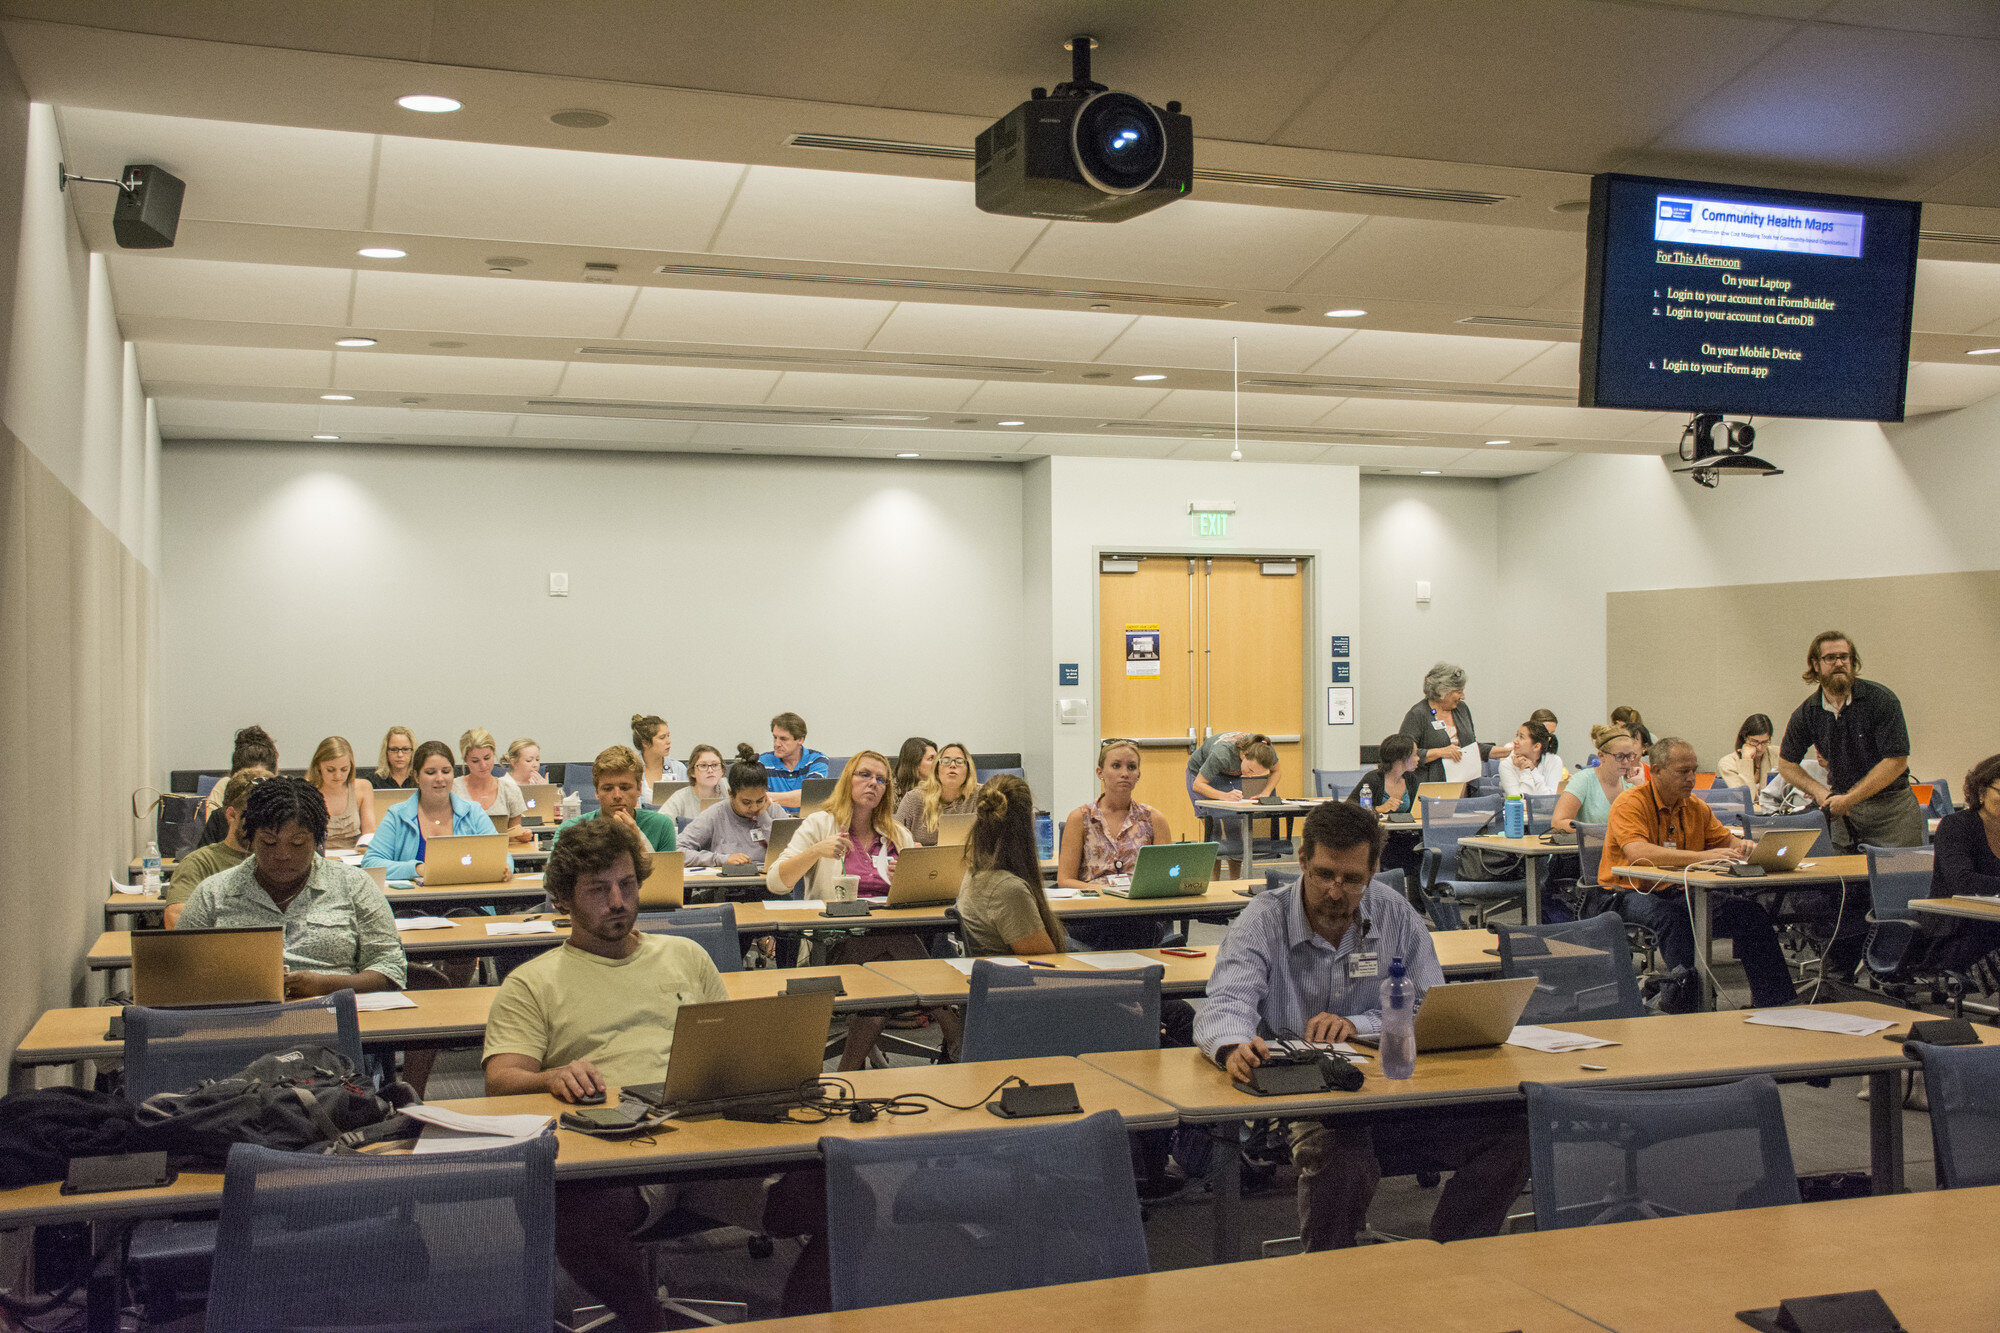 Several projects were inspired these MUSC workshops. Of particular note is Dr. Bryan Heckman’s smoking cessation research project. I must point out that Dr. Deb Williamson and Dana Burshell worked to organize and plan the MUSC trainings and deserve most of the credit for the turnout.Our successful trainings with MUSC have served as a model for teaching bigger groups such as those at the CHM Symposium at the National Library of Medicine in June, 2016 and recent trainings in Seattle.
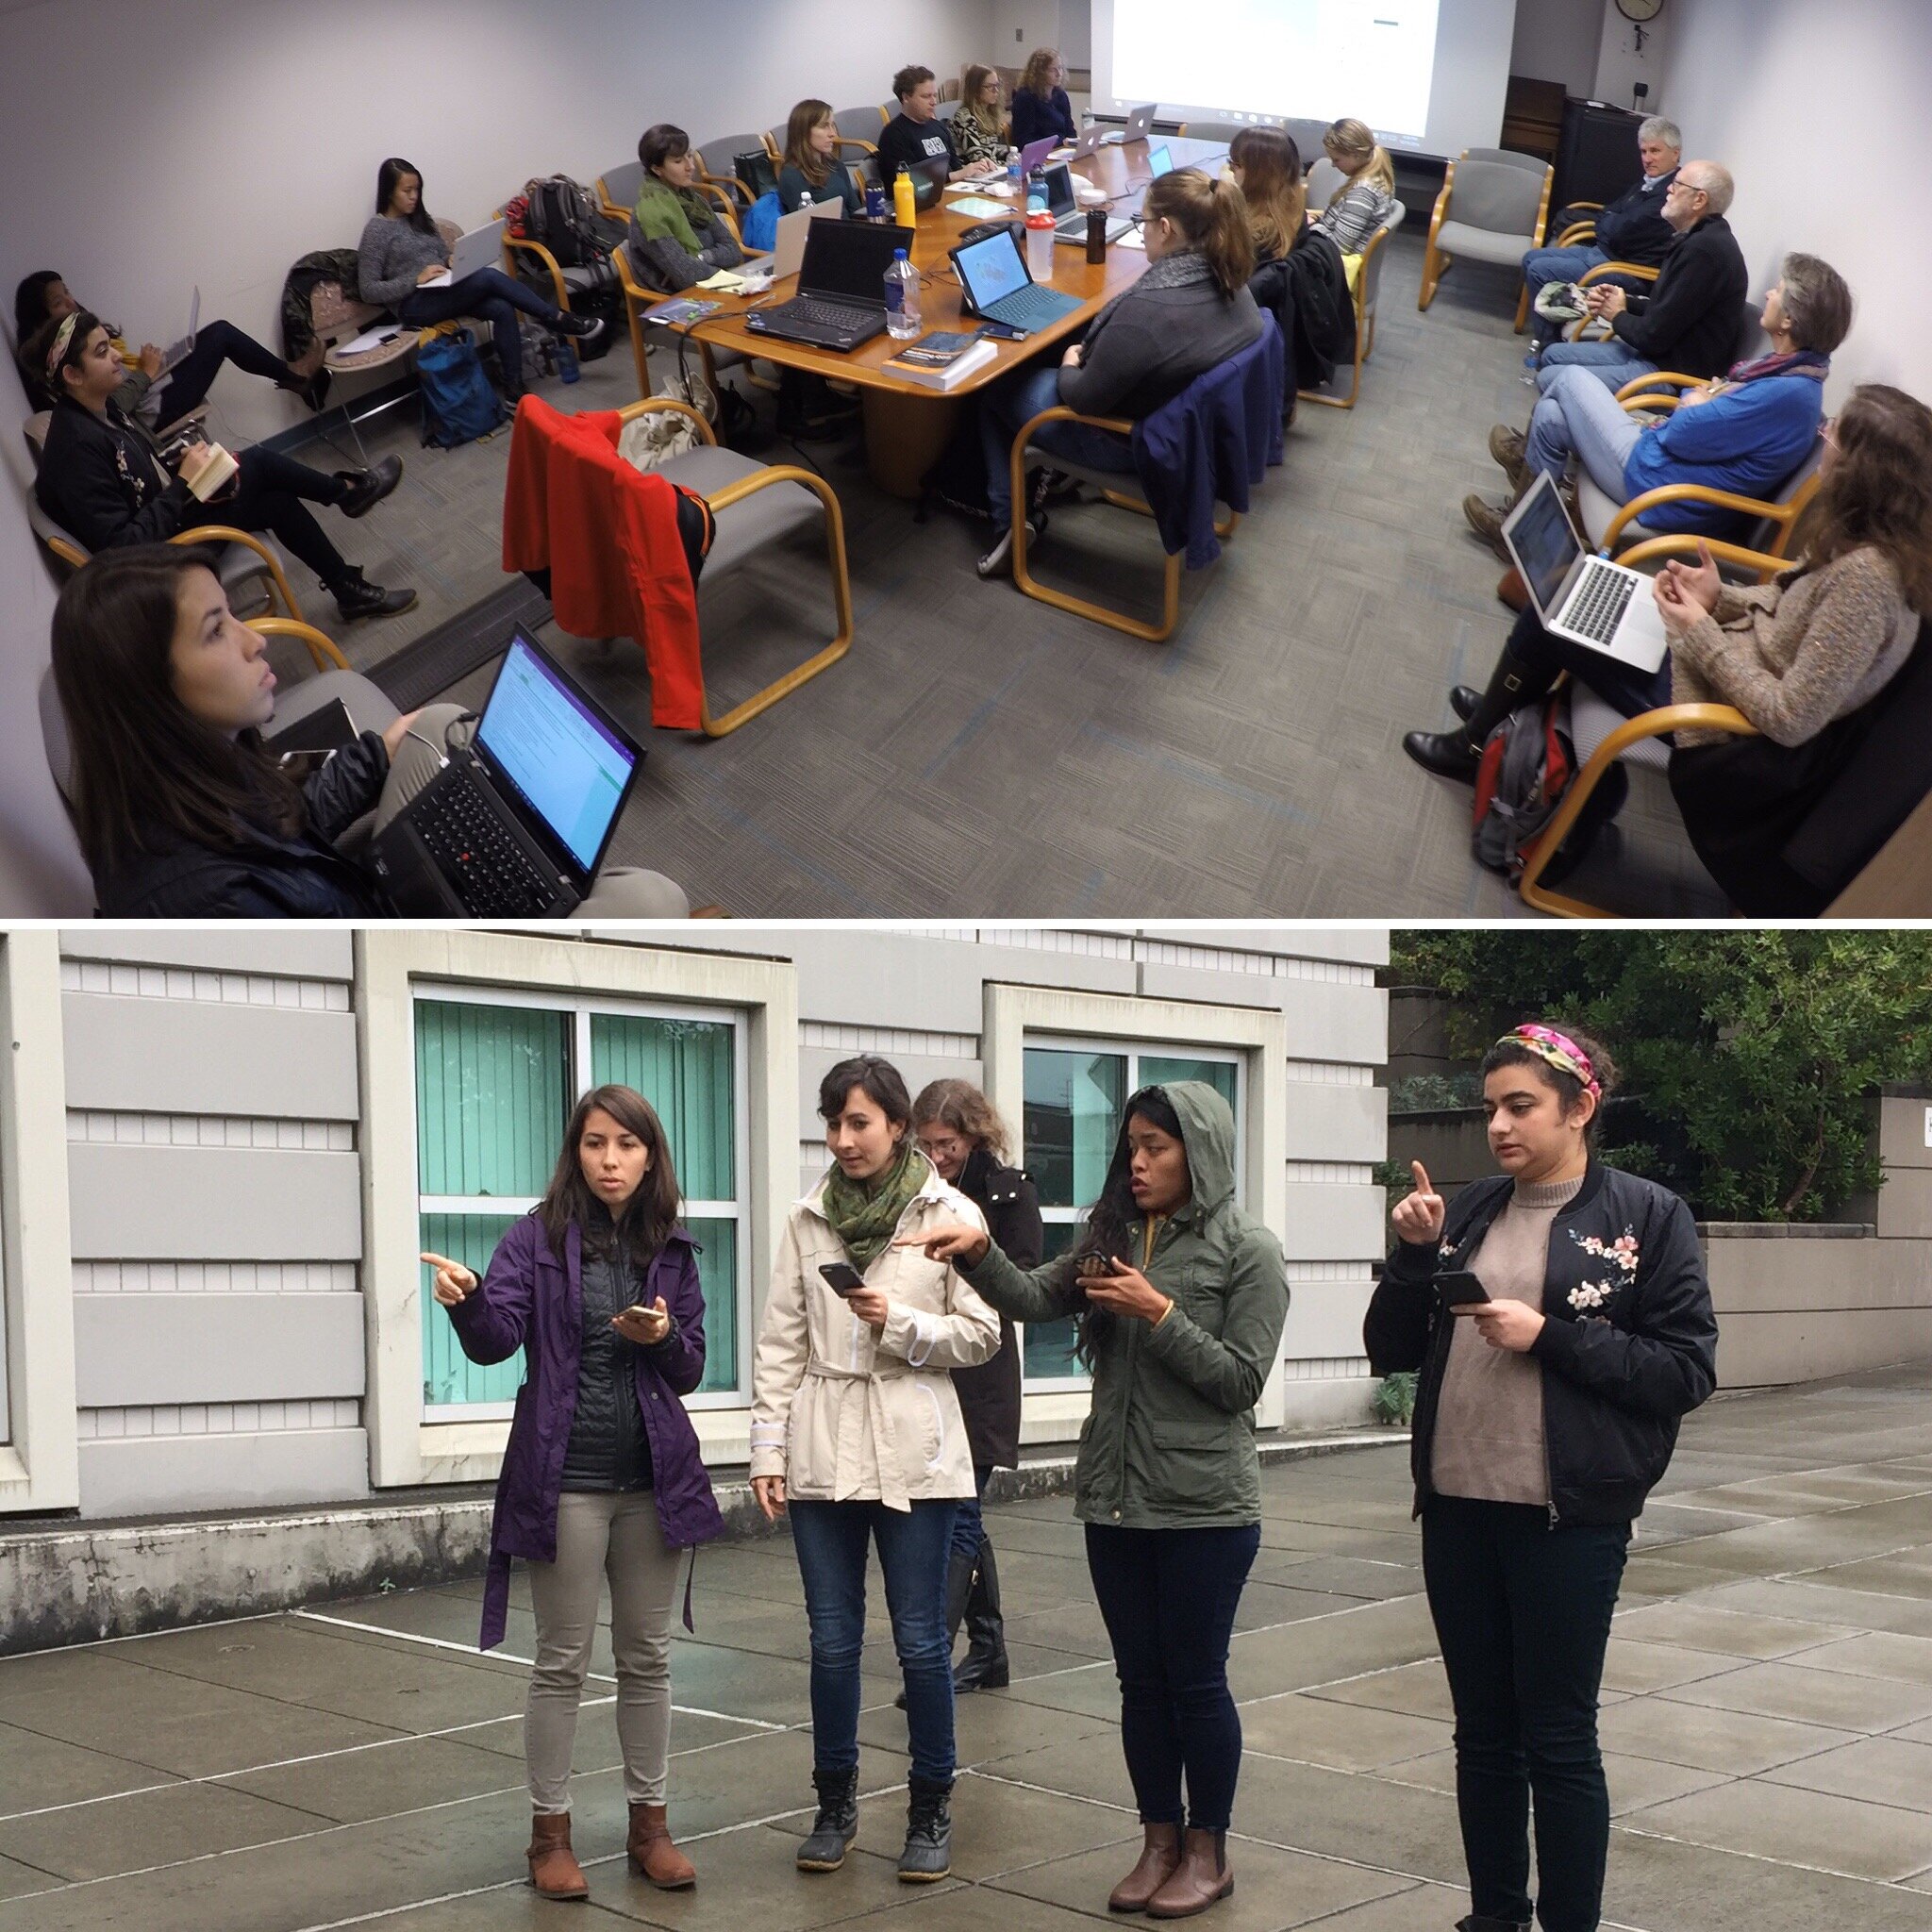 The most gratifying aspect of these workshops was seeing people shed their technological insecurities. It’s common for people to show up and admit they’re scared of the technology. To then see in a few short hours, they are getting it all to work, and actually getting excited about the possibilities, is a beautiful thing. What are your plans for the future of CHM? Kurt: The work that people are doing right now with CHM barely scratches the surface in terms of the potential. I would like to get more community members involved. I envision a scenario where there is an organization can really engage with citizens to map the community. The data could be managed by a central data manager in the organization. It would be such a great way to involve the community in a project directly related to their healthcare.I’d also like to see someone get past the initial data gathering and map making phase. QGIS has a lot of spatial analysis capabilities. I’d like to see someone push beyond the CHM labs and do some interesting analyses in QGIS or use some of the cool data visualization techniques in Carto.What advice you would give to new CHM users?Kurt: Don’t be afraid to dive in and use the tools. Be adventurous and creative with your projects. Don’t be afraid to mess up. That’s how you learn. There is no limit to the kinds of things you can accomplish with mapping and spatial analysis tools. If you can imagine it, it can be done.
CHM Conducts Three Workshops in Maryland
Last week Kurt Menke traveled to Maryland. Two workshops were held at the Prince Georges County Department of Social Services for people working on homeless issues. All attendees were novices to mapping technology. However, in the first hour they all built a data collection form in Fulcrum and went outside to collect some data around the building.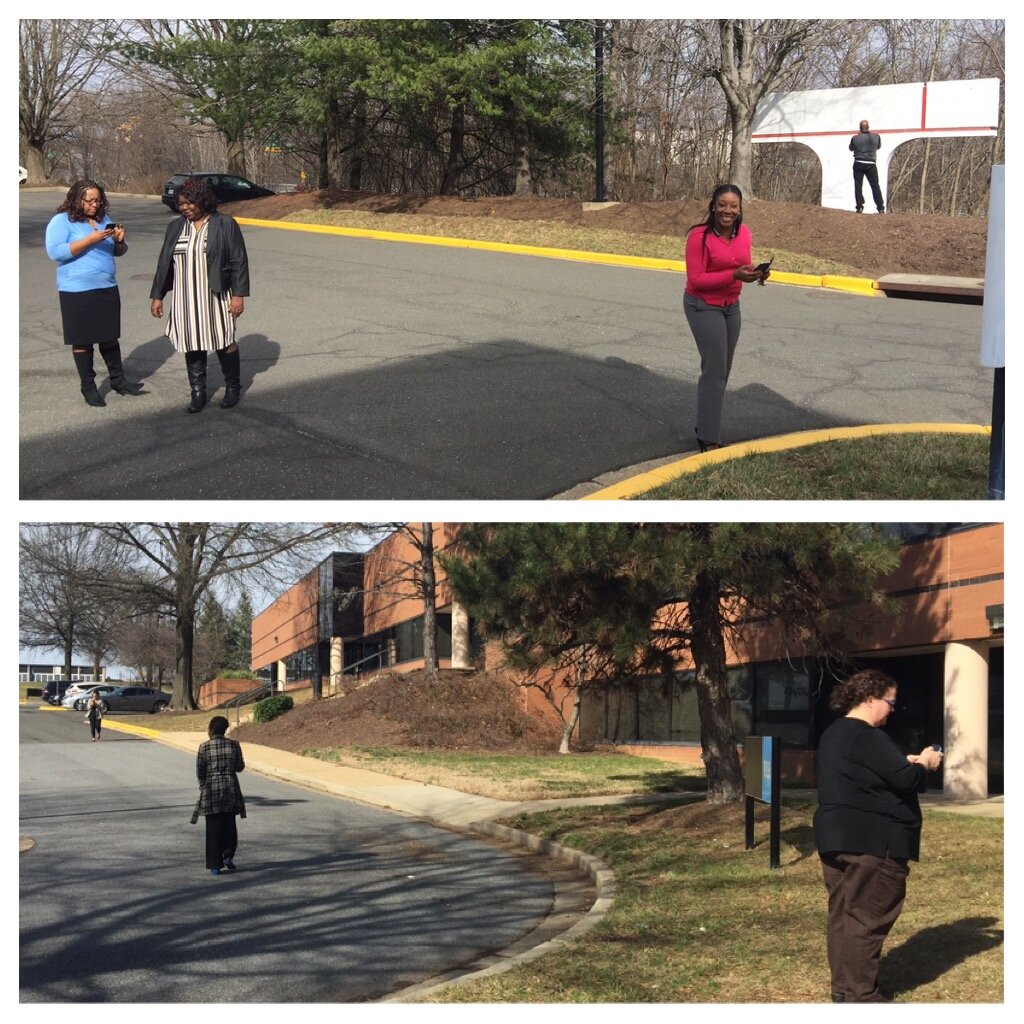 The attendees represented a variety of organizations including many working with YouthREACH Maryland. REACH is an acronym standing for Reach out, Engage, Assist, & Count to end Homelessness. It is an effort to obtain accurate, detailed information on the number, characteristics, and needs of unaccompanied homeless youth in Maryland. Other organizations represented at these workshops included:
- Maryland's Commitment to Veterans
- Maryland Department of Planning
- Prince Georges Community College
- St Ann's Center for Children, Youth, and Familes
- Maryland Multicultural Youth Center
- So Others Can Keep Striving (S.O.C.K.S)
- Sasha Bruce Youthwork
- Lifestyles of Maryland.
In the final two hours of the workshops attendees learned how to map the data they collected in both Carto and QGIS. We also had time for a brief discussion about how CHM could be used in their projects. There were a lot of ideas shared about how the technology could help community engagement.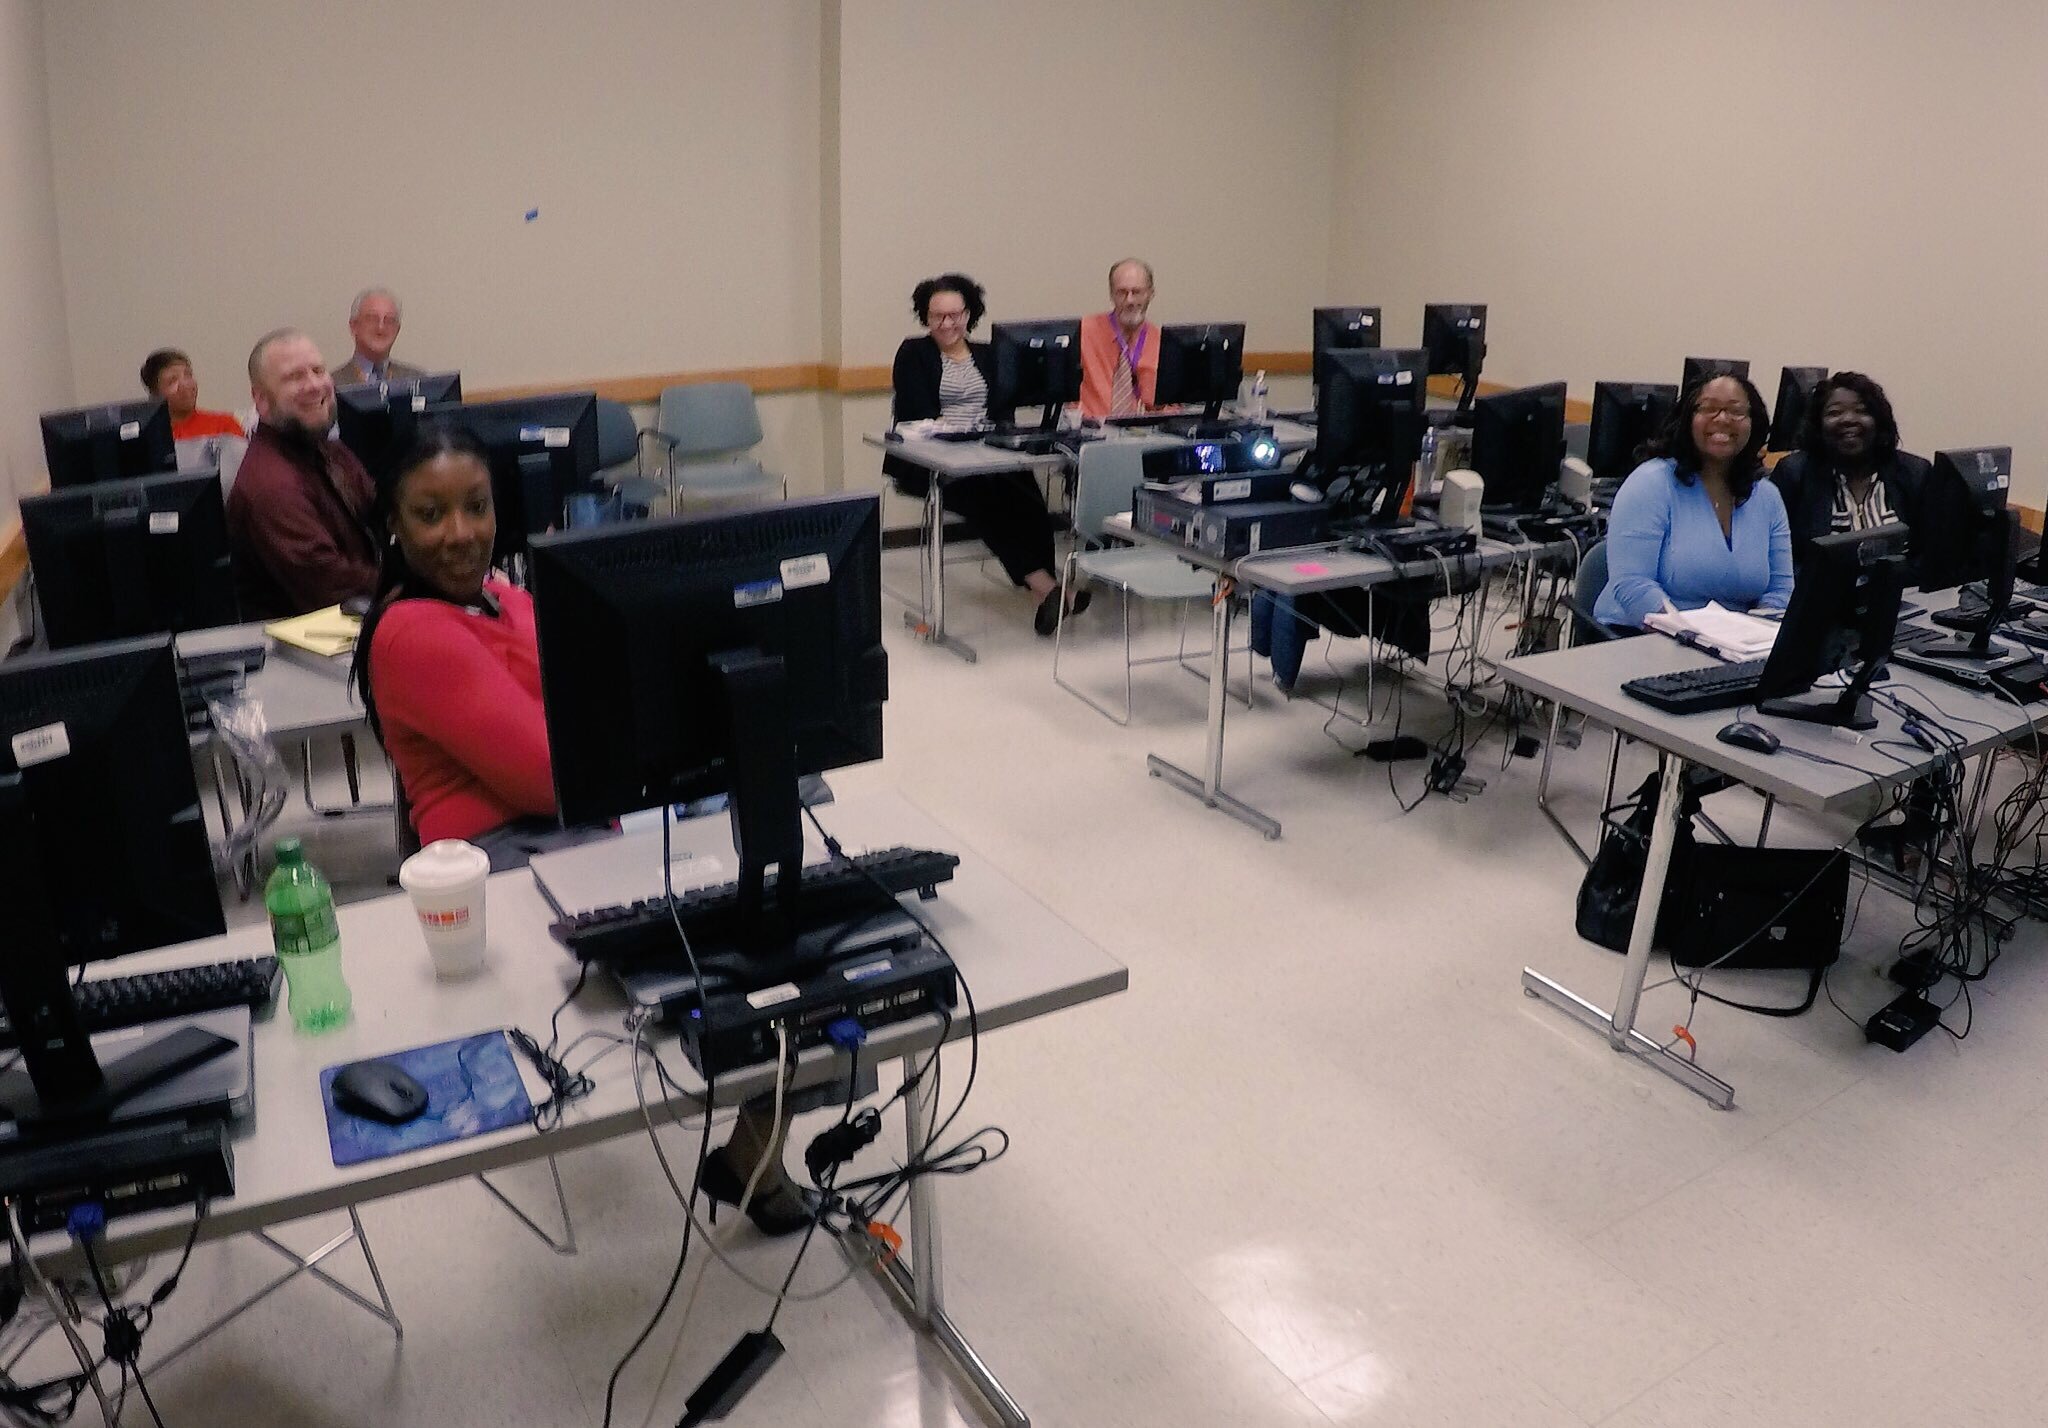 After the two PG County workshops, CHM traveled across the Chesapeake Bay bridge to Salisbury University on the eastern shore.
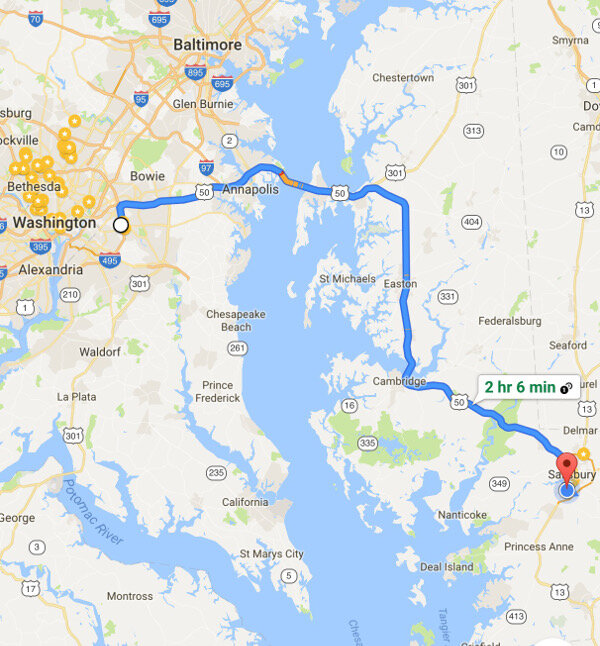 The following morning we held a workshop geared towards social work students at Salisbury University. Attendees went through the CHM workflow and were introduced to Fulcrum, Carto and QGIS. Below is a map of data collected around the student center in Carto.
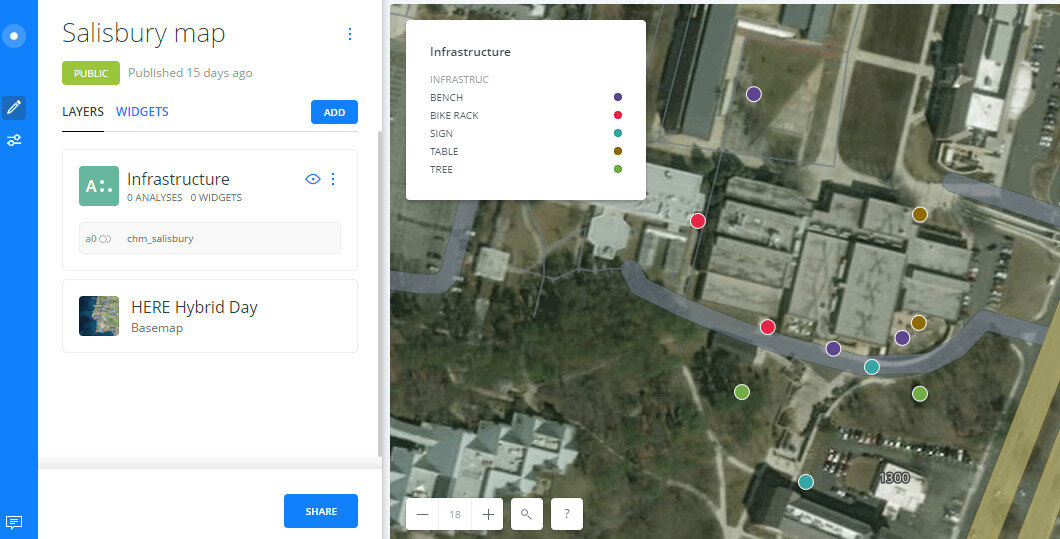 Salisbury University Data Collection in CartoThe workshop concluded with a short introduction to working with data in QGIS.
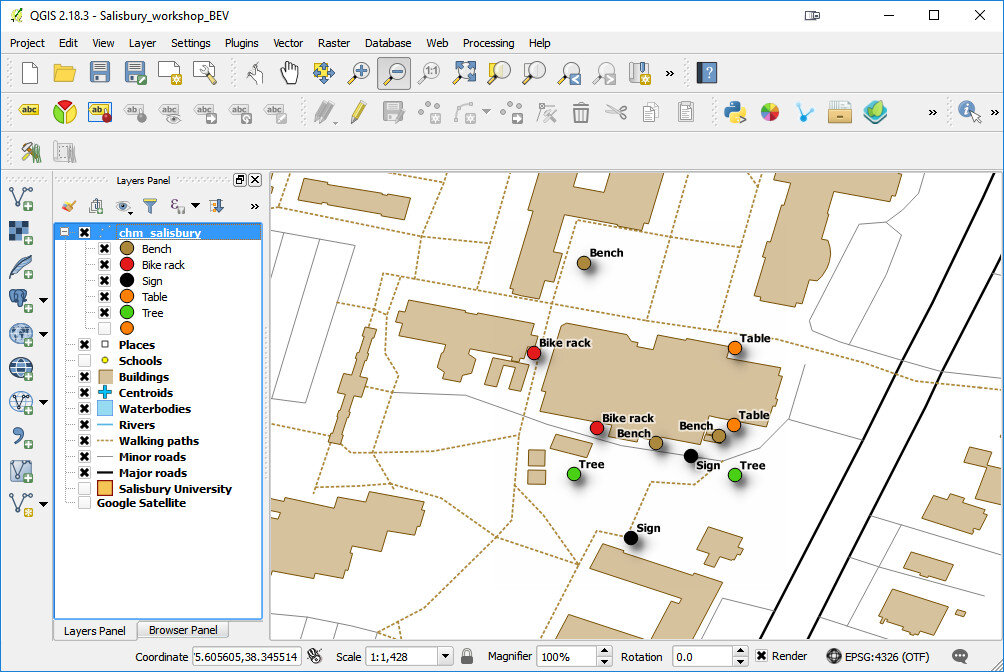 The next scheduled workshop for the Community Health Maps team will be at the Teaching Prevention 2017 Conference in Savannah, Georgia. That conference takes place from April 5-7th. If you are interested in learning this technology this workshop will be a great opportunity!
New Year Will Bring Updated Labs Including Lab Zero!
It has been 2 years since the Community Health Maps (CHM) lab exercises were first produced. Software changes quickly, and over the last two years the tools involved in the CHM workflow have undergone many changes. For example, this fall the pricing scheme for iForm changed. Though it is still a good product, this price increase puts it out of the category of low cost software. The companion site formhub.org no longer exists, making ODK Collect more difficult to work with. Fortunately Fulcrum is a fantastic alternative to those two data collection apps. QGIS has released 5 new versions and is now at version 2.18! CartoDb has been rebranded as Carto and has a new interface. All these changes means it is time for all the lab exercises to be updated. Lab 1 will now be a single lab for both iOS and Android users with Fulcrum. Labs 2-5 will be updated to QGIS 2.18. Lab 6 will be updated to Carto's new interface. The set of companion videos will also be redone and updated.Many have worked through these labs and some provided feedback. This information is being used to improve the labs as they are updated. One new item will be Lab Zero. While the CHM workflow is intuitive, it has been suggested that more background information could be useful. Lab Zero will be a companion reference document to the CHM labs. It will contain: A) information on the background of the CHM project, B) software installation instructions , C) a glossary of terms, D) more thorough descriptions of some technical topics like coordinate reference systems, E) a description of how to interact with the QGIS community to get additional help, and F) a list of data resources. This work is in progress and will be ready this spring. Stay tuned!