Maps

CHM Conducts Three Workshops in Maryland

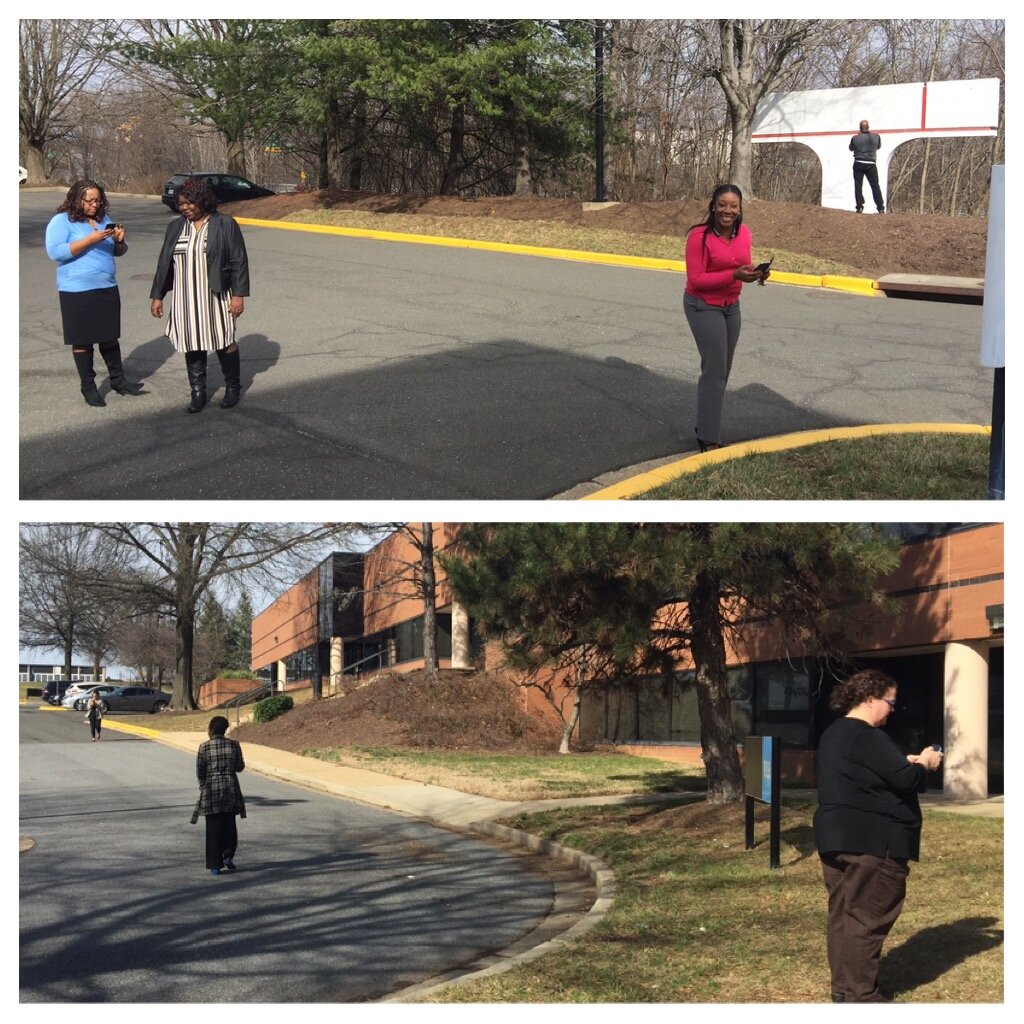
Last week Kurt Menke traveled to Maryland. Two workshops were held at the Prince Georges County Department of Social Services for people working on homeless issues. All attendees were novices to mapping technology. However, in the first hour they all built a data collection form in Fulcrum and went outside to collect some data around the building.file-mar-02-9-35-57-amThe attendees represented a variety of organizations including many working with YouthREACH Maryland. REACH is an acronym standing for Reach out, Engage, Assist, & Count to end Homelessness. It is an effort to obtain accurate, detailed information on the number, characteristics, and needs of unaccompanied homeless youth in Maryland. Other organizations represented at these workshops included:
  • Maryland's Commitment to Veterans
  • Maryland Department of Planning
  • Prince Georges Community College
  • St Ann's Center for Children, Youth, and Familes
  • Maryland Multicultural Youth Center
  • So Others Can Keep Striving (S.O.C.K.S)
  • Sasha Bruce Youthwork
  • Lifestyles of Maryland.

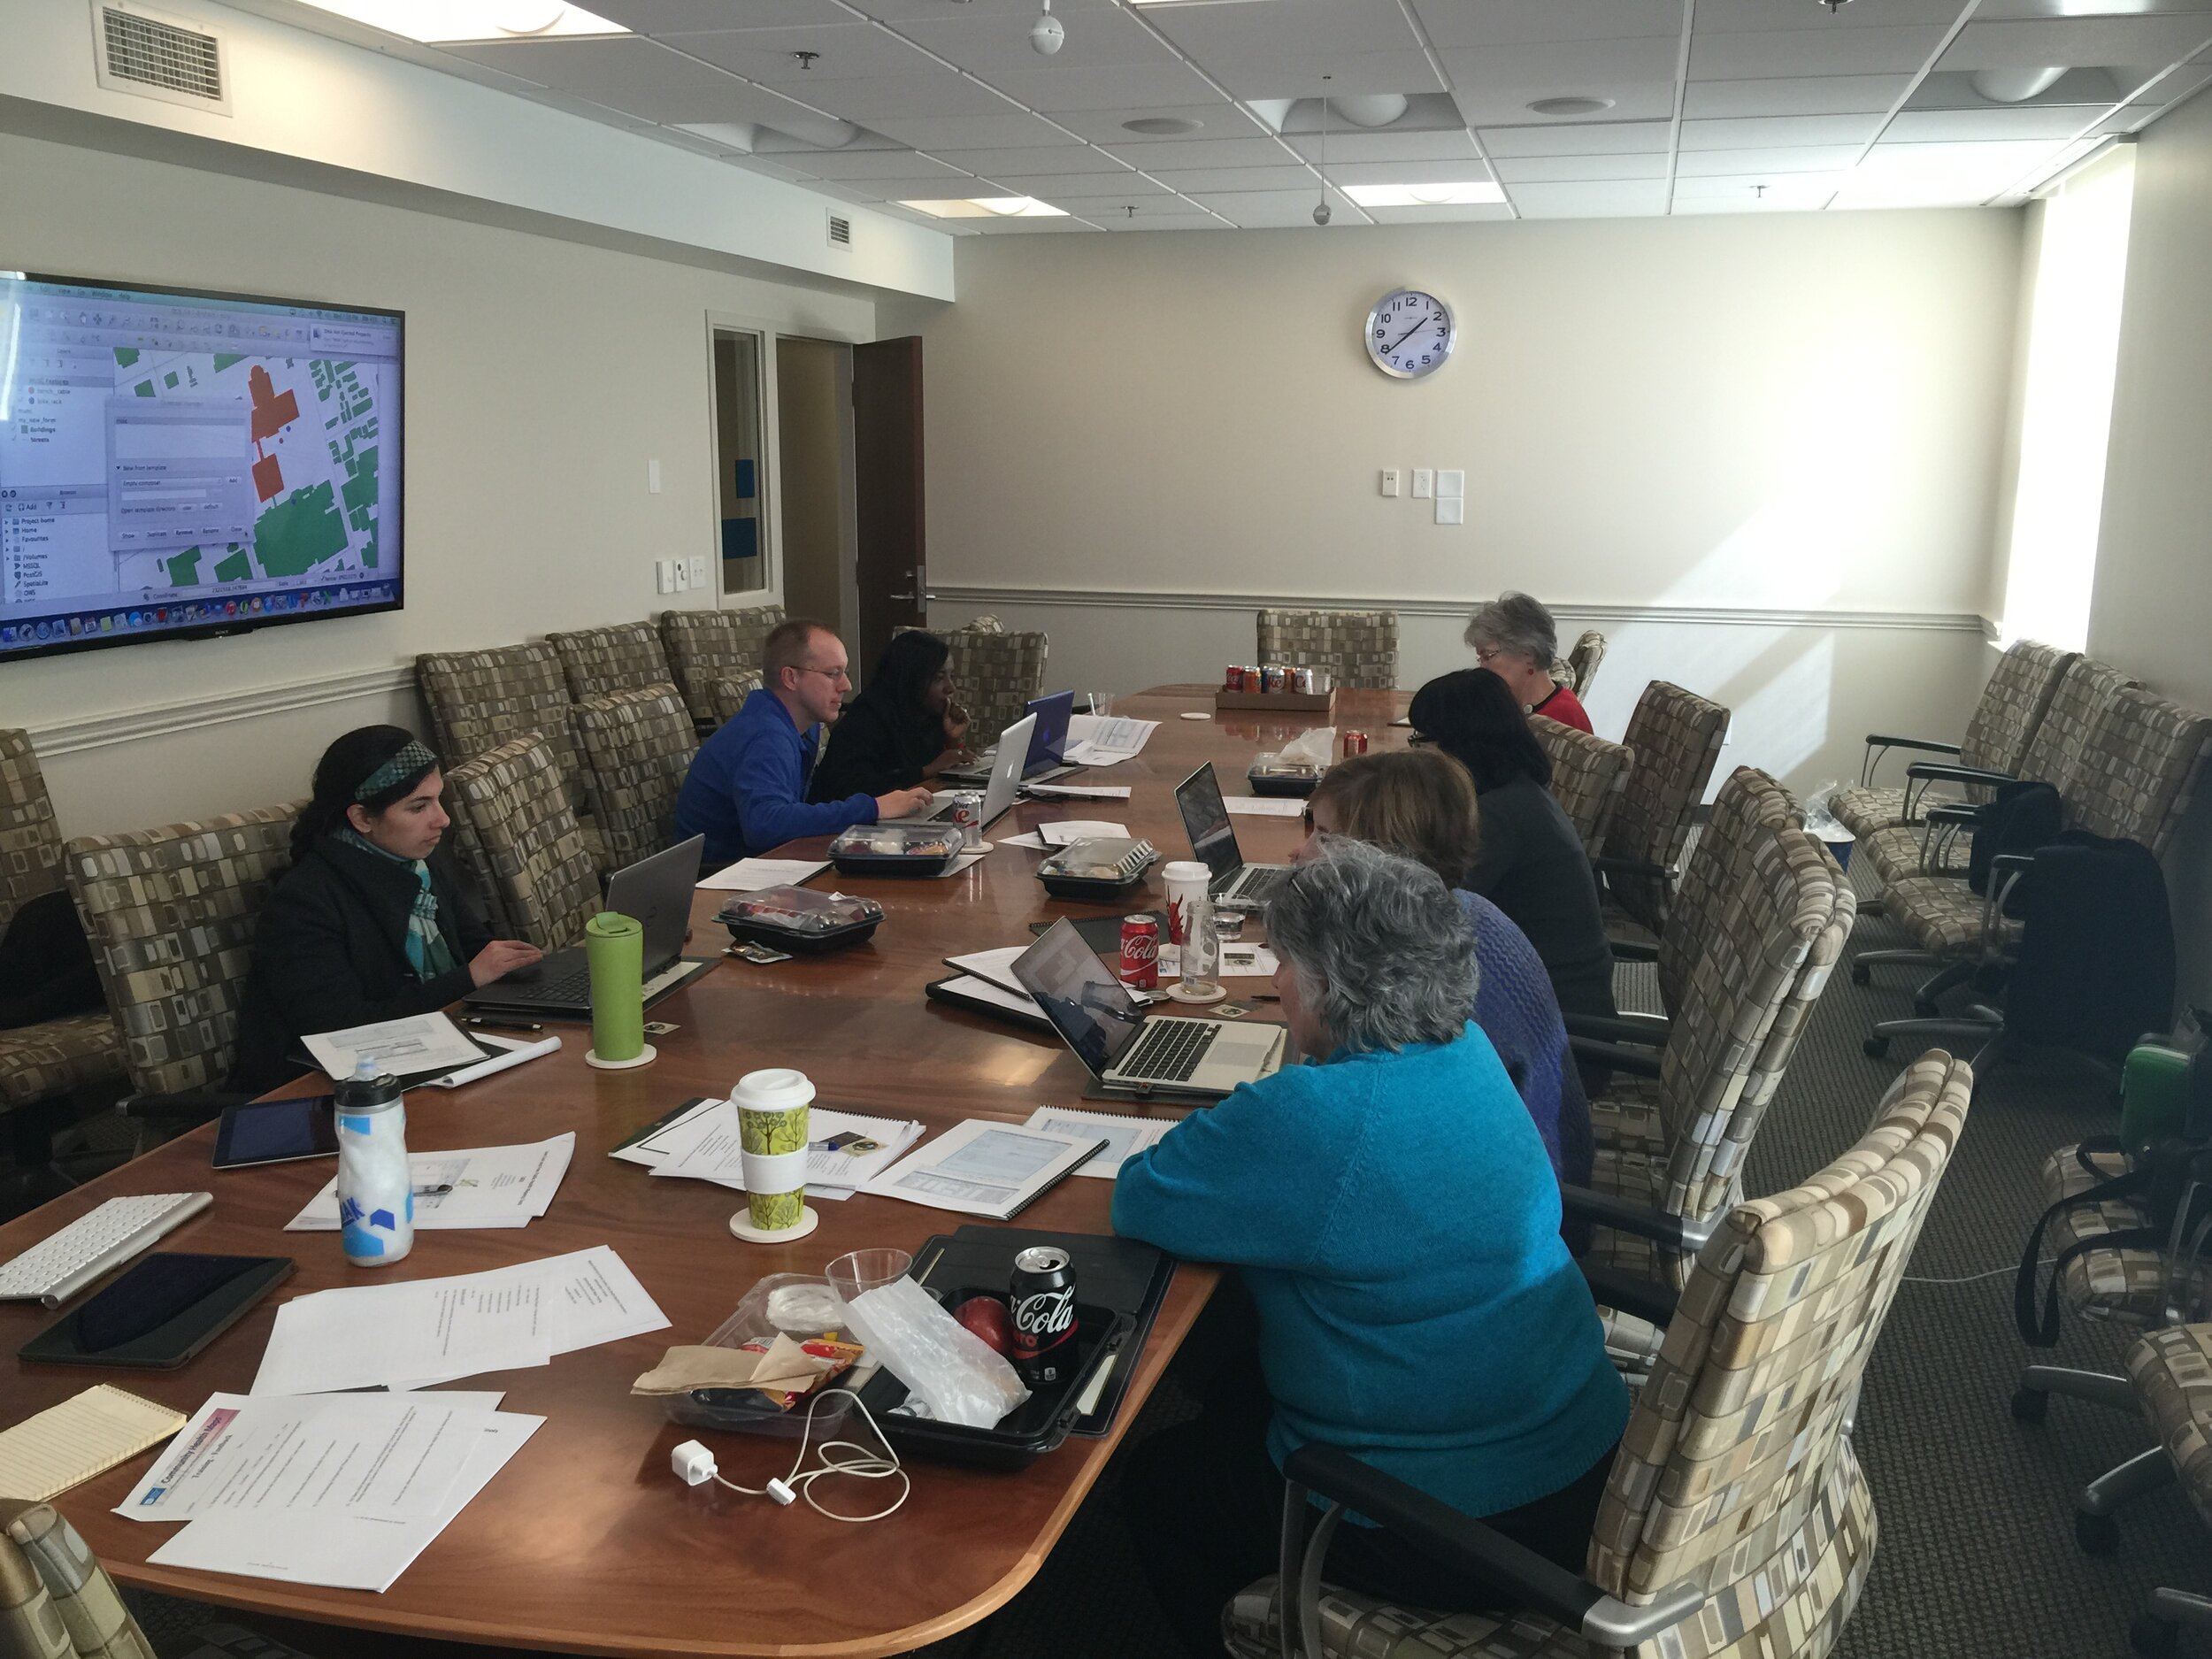
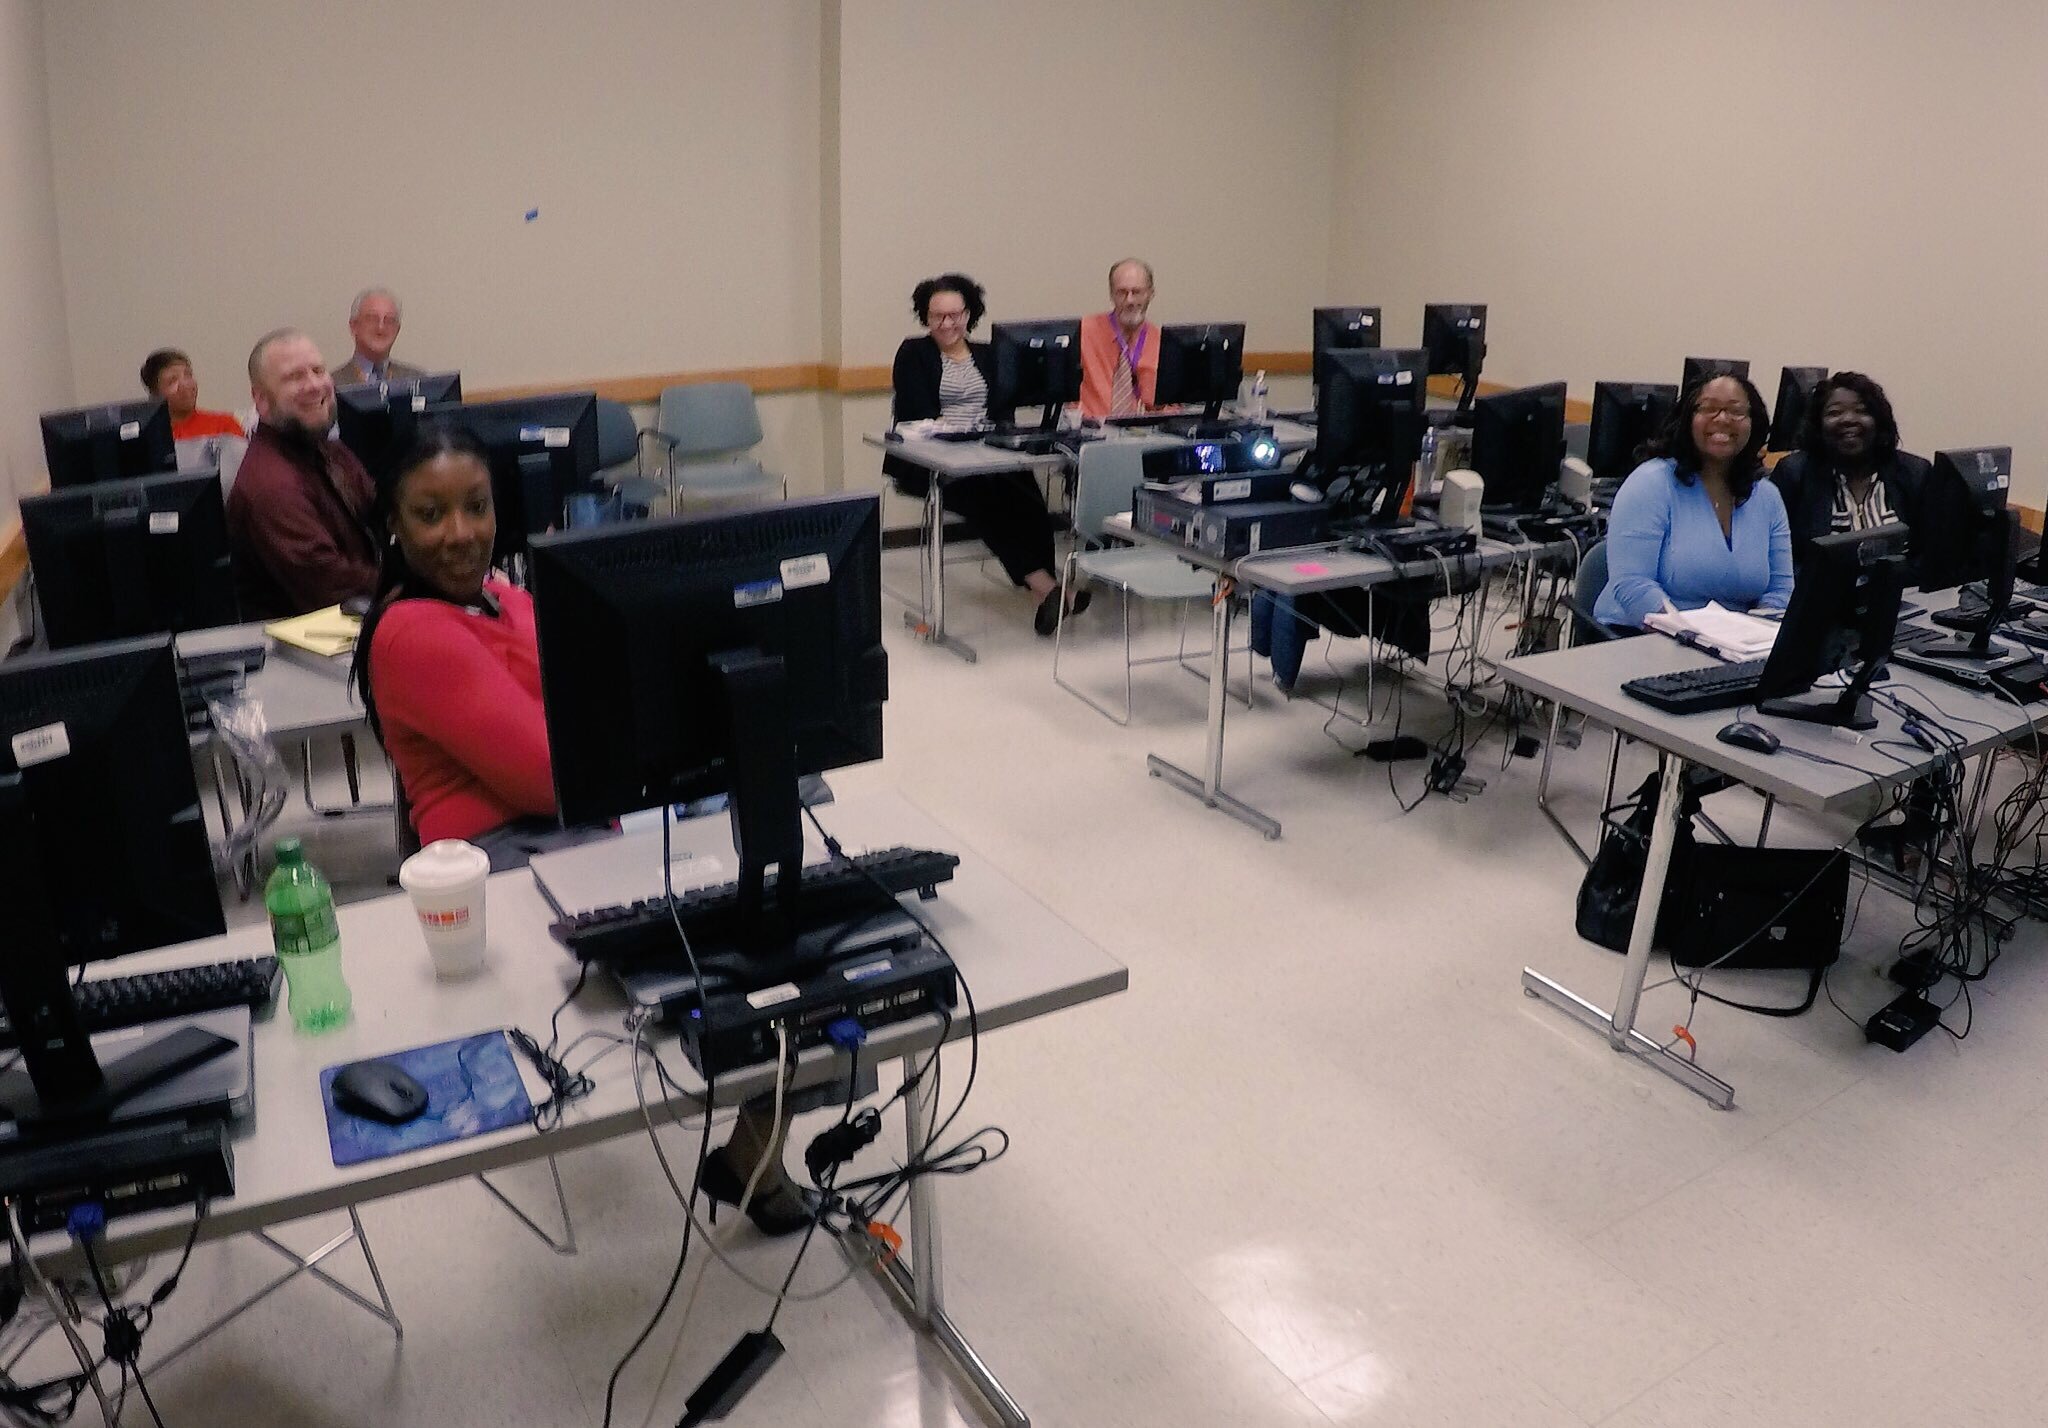
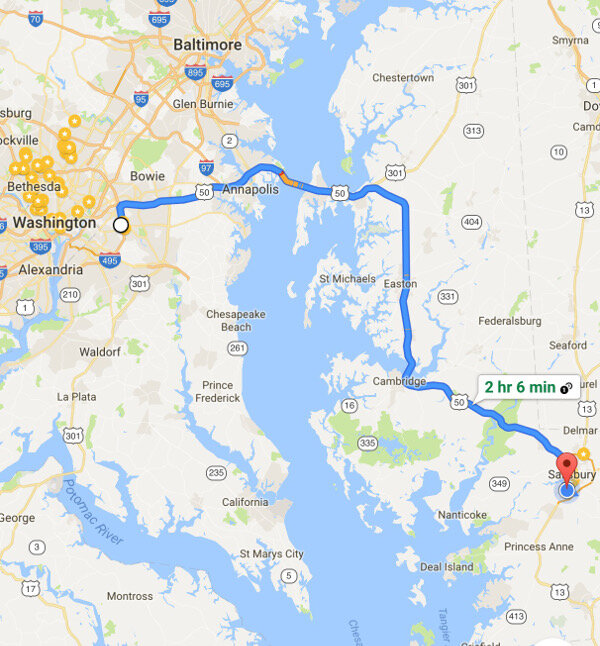
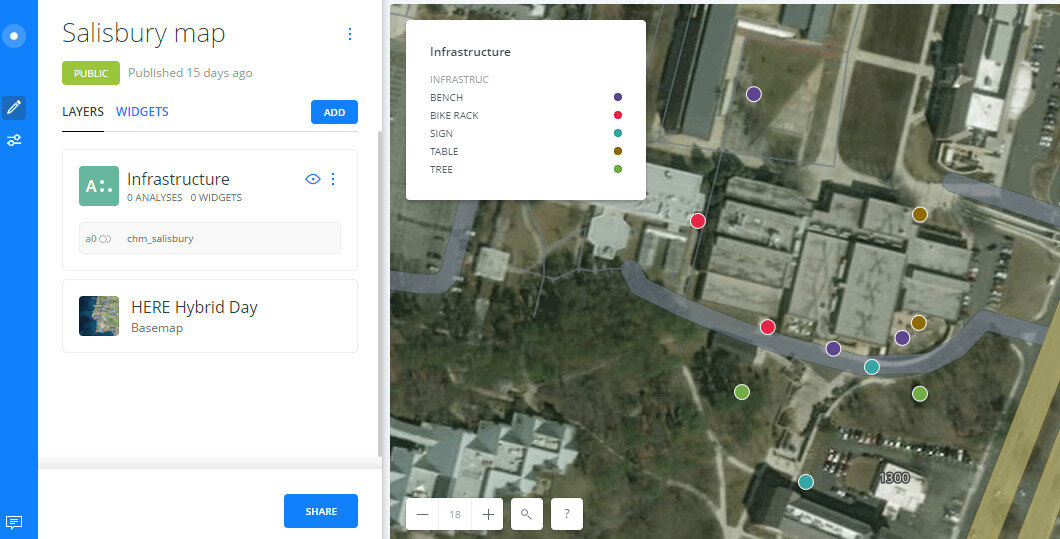
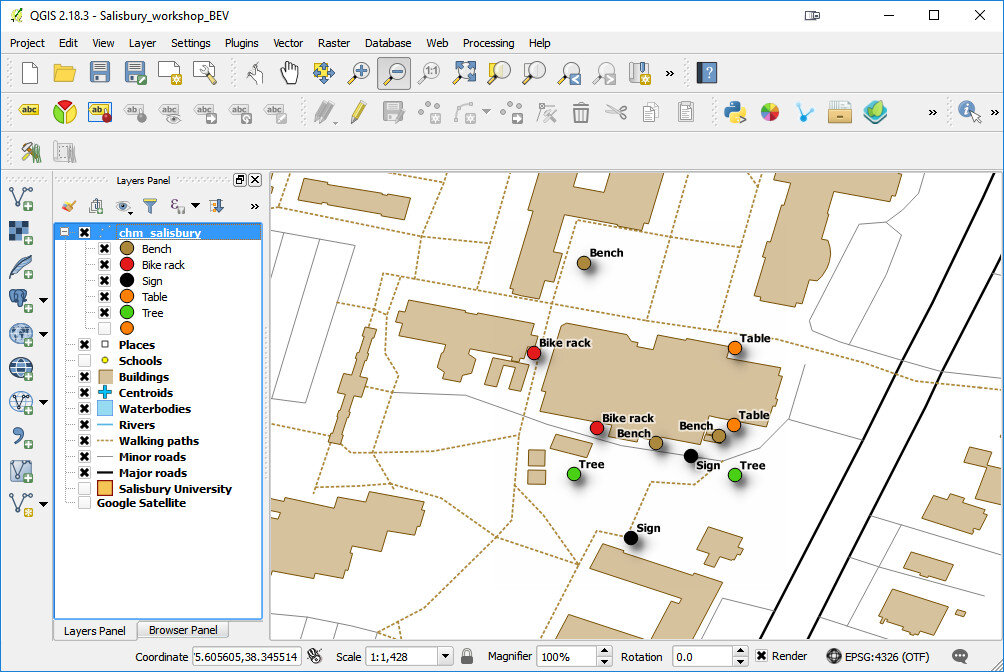
In the final two hours of the workshops attendees learned how to map the data they collected in both Carto and QGIS. We also had time for a brief discussion about how CHM could be used in their projects. There were a lot of ideas shared about how the technology could help community engagement.file-mar-02-9-27-09-amAfter the two PG County workshops, CHM traveled across the Chesapeake Bay bridge to Salisbury University on the eastern shore.file-mar-02-9-27-49-amv2The following morning we held a workshop geared towards social work students at Salisbury University. Attendees went through the CHM workflow and were introduced to Fulcrum, Carto and QGIS. Below is a map of data collected around the student center in Carto.2017-03-02_095000Salisbury University Data Collection in CartoThe workshop concluded with a short introduction to working with data in QGIS.2017-03-02_094159The next scheduled workshop for the Community Health Maps team will be at the Teaching Prevention 2017 Conference in Savannah, Georgia. That conference takes place from April 5-7th. If you are interested in learning this technology this workshop will be a great opportunity!
Wildly Successful Community Health Mapping Workshops at MUSC!

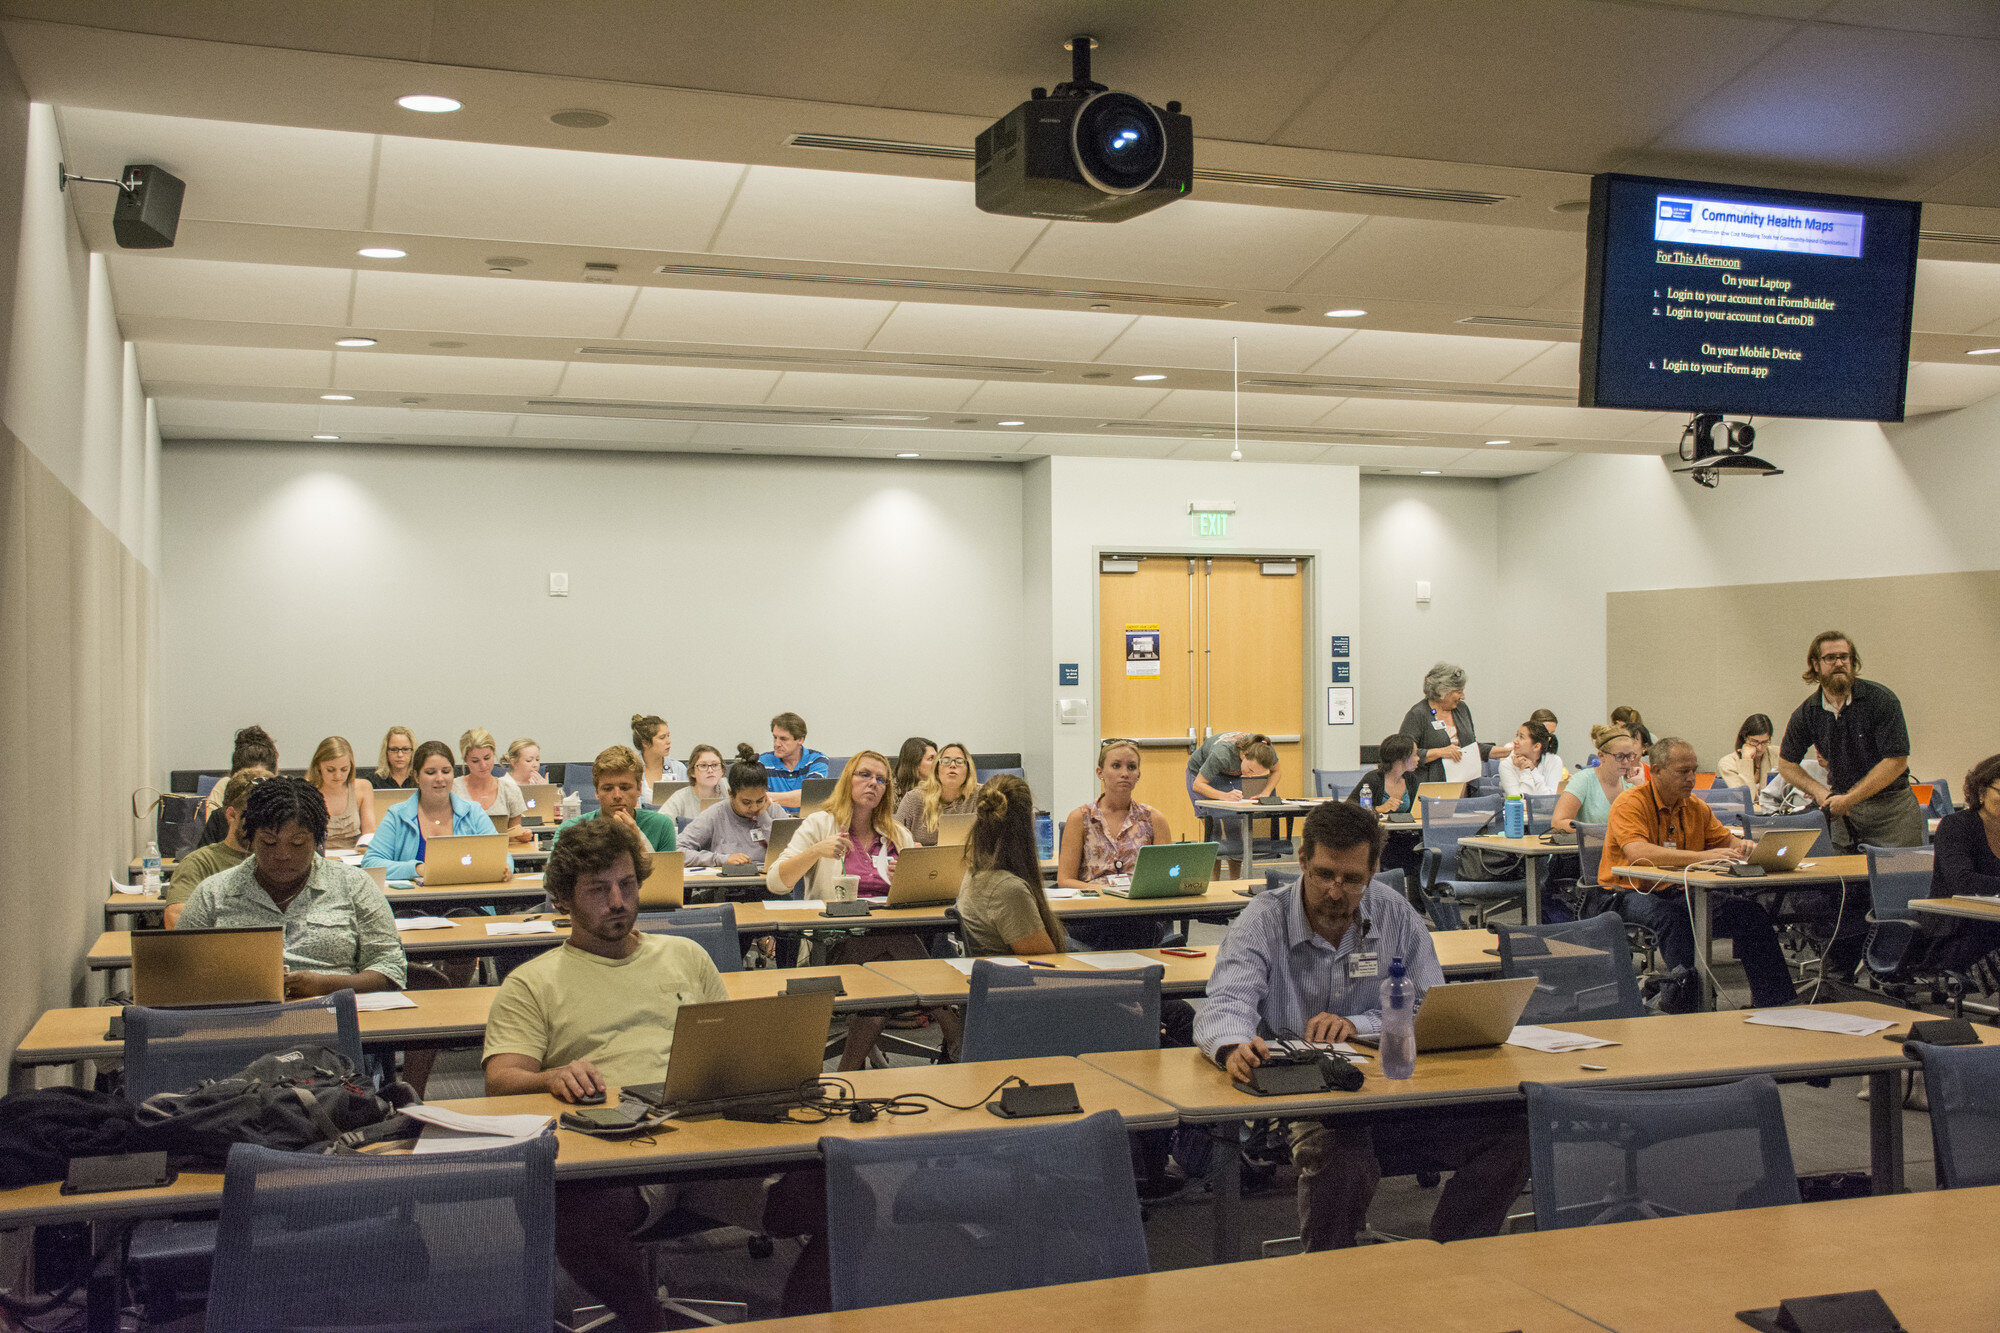
Community Health Maps (CHM) conducted it's largest and most successful workshops ever at the end of September at the Medical University of South Carolina (MUSC). The training at MUSC was divided into three workshops and a presentation. The attendees were a mix of professors, students and researchers, most of whom had little to no experience with GIS. Despite this fact, nearly everyone was able to collect data and make a map. This is a testament to the easy to use nature of the CHM workflow.It began Monday morning with the first workshop. This was an Intermediate Session for those Community Health Mappers who had been working on projects since the April CHM workshop. We spent two hours covering more advanced topics and answering project specific questions.Kurt Menke explaining advanced QGIS features.Following that, Kurt Menke presented a CHM project overview at a brown bag lunch session to 30 attendees. Matt Jones closed this session with a 10 minute talk detailing how he used The Community Health Maps workflow this summer to map access to care on Johns Island.The second workshop was Monday afternoon. It was a two hour session covering field data collection with iForm, and mapping that data online with CartoDB. There were 55 attendees at this session, the vast majority of whom had no GIS experience. In just two hours all 55 attendees were able to collect field data and make a map in CartoDB!iForm and CartoDB Workshop AttendeesThe final workshop on Tuesday was a 5 hour session covering the use of QGIS. The workshop consisted of a custom Charleston based QGIS exercise. Each of the 35 participants worked with a set of Charleston GIS data while learning the basic layout of QGIS. They learned how to add data, style it, and compose a map. The workshop ended with a discussion of each participants goals and project specific questions.QGIS Workshop AttendeesIn total almost 80 people attended one or more sections of the training! Thanks go out to Dr. Deborah Williamson for hosting the workshops, Dana Burshell for organizing the entire event and assisting during the workshops, and to Sarah Reynolds who was invaluable in providing Mac and QGIS support!

Community Health Maps Conducts a Training in the South Carolina Lowcountry

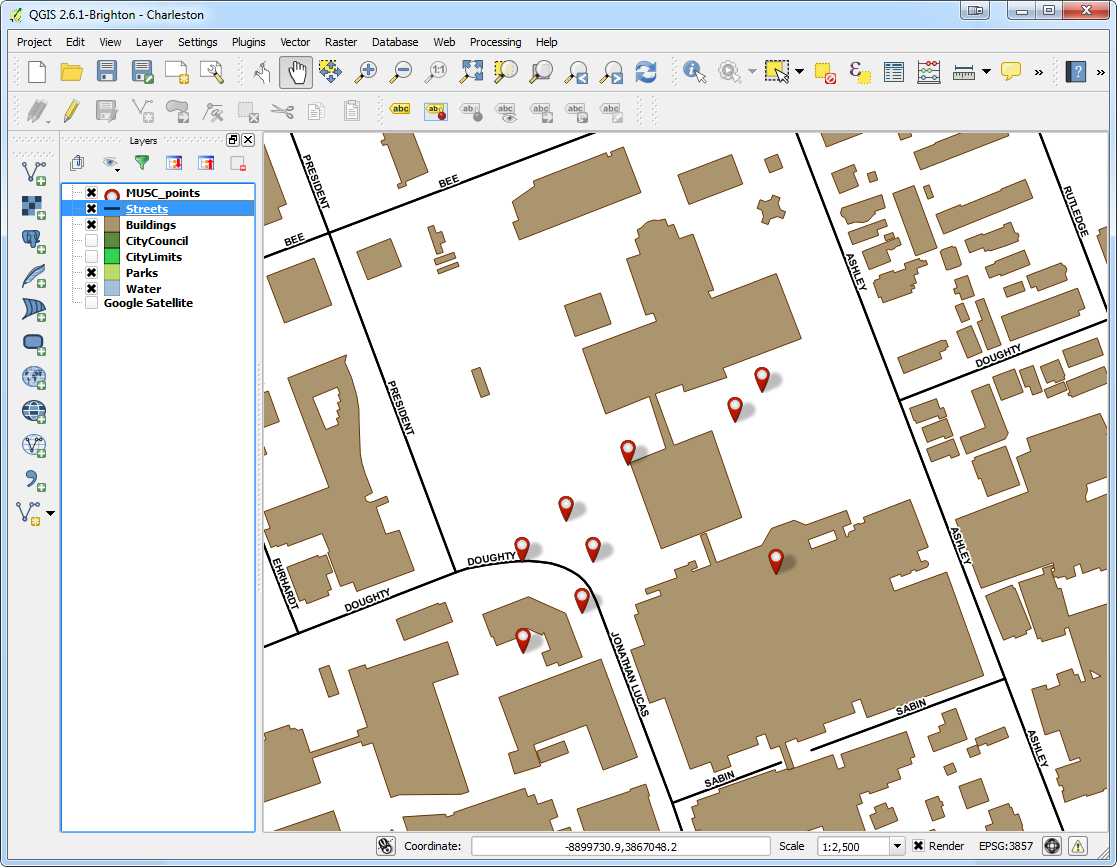
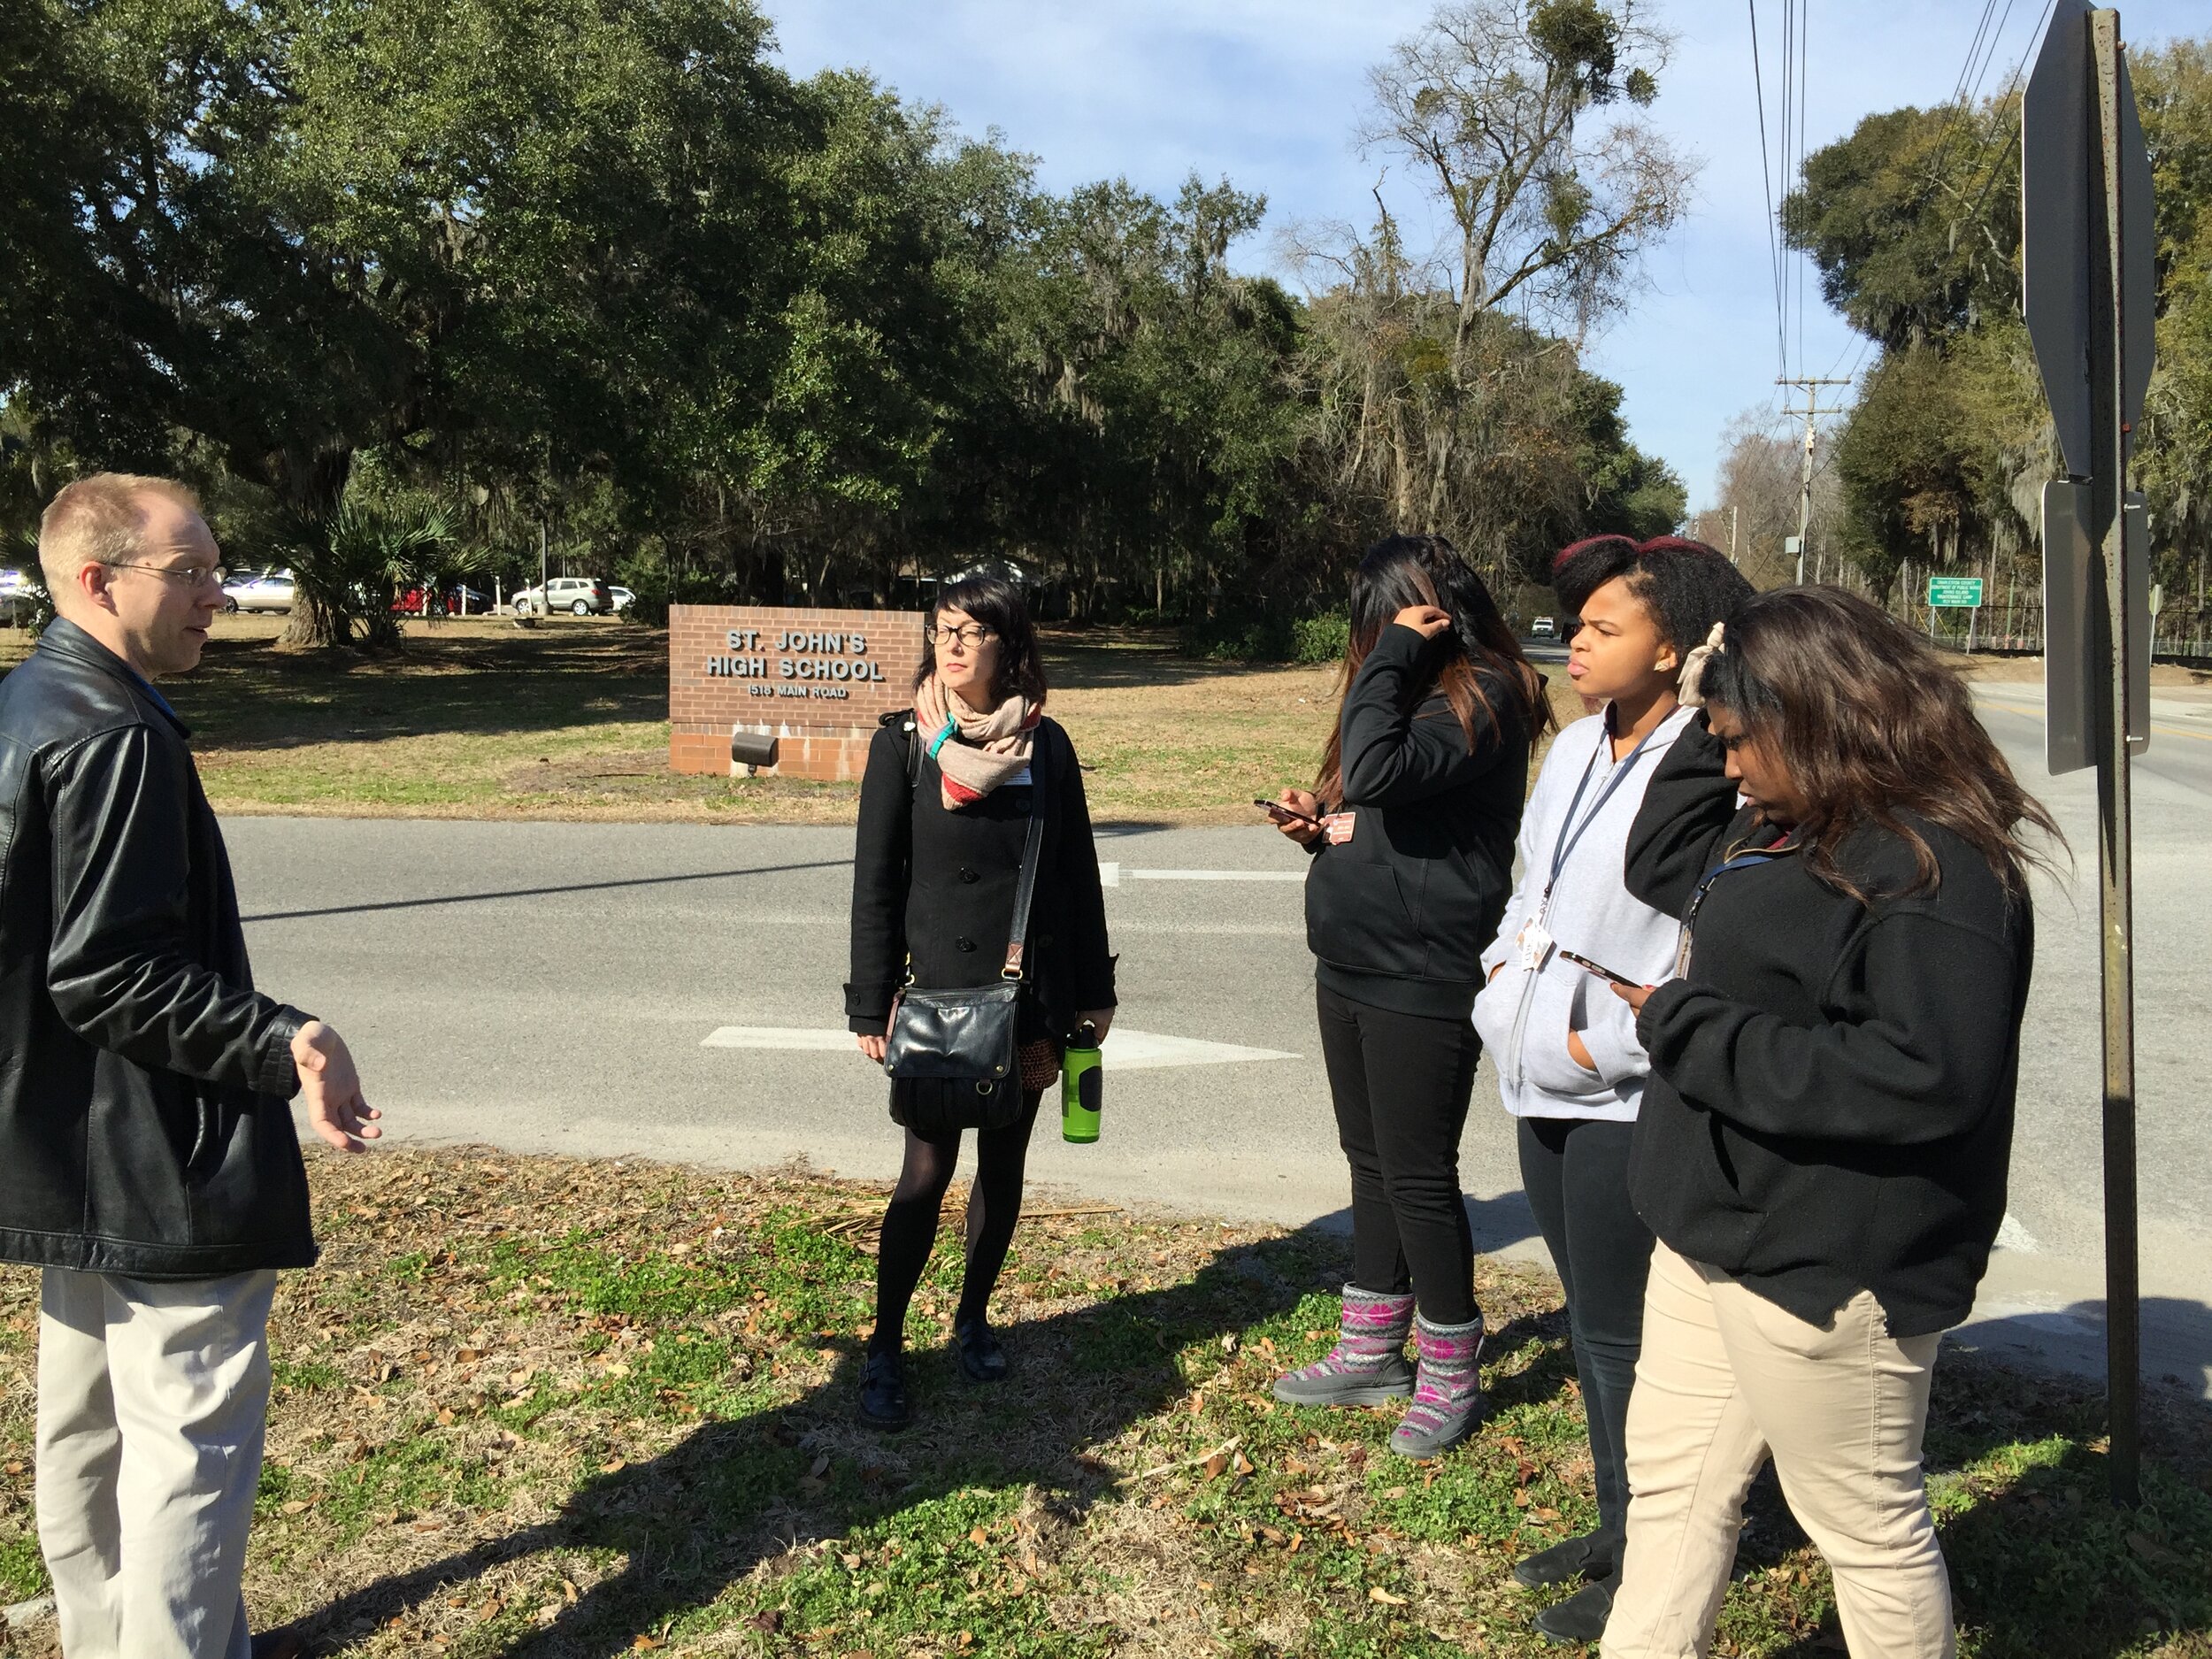
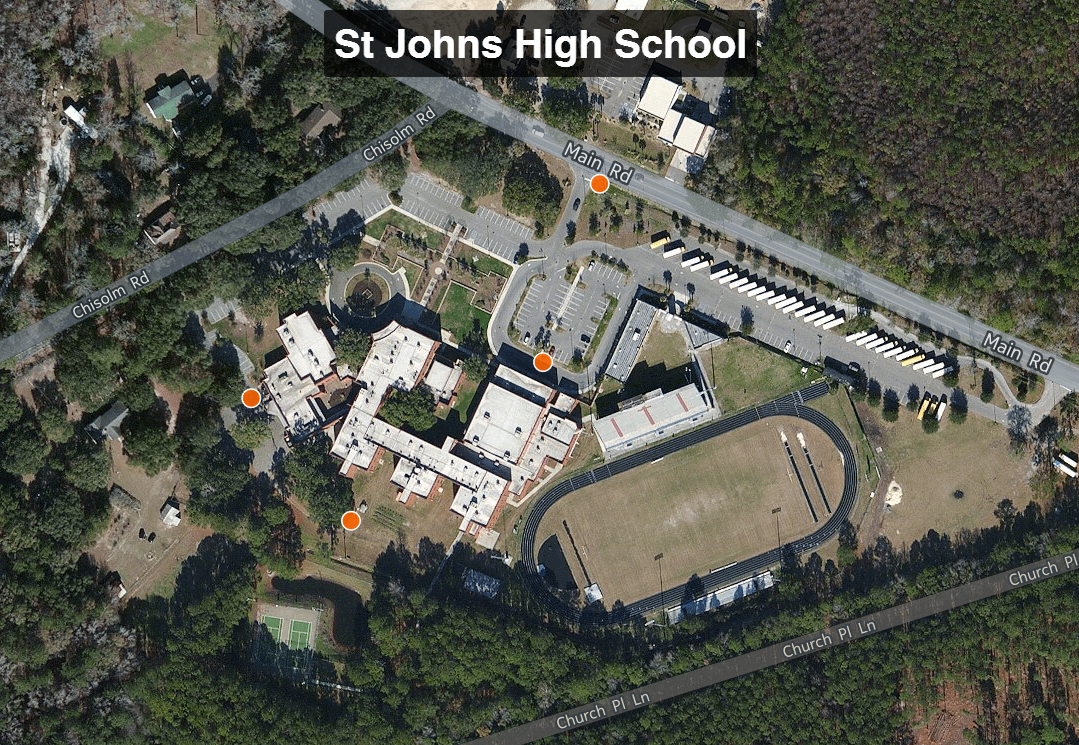
Recently Kurt Menke headed to Charleston, South Carolina to train several groups how to map their communities. This region is also known as the 'lowcountry' due to the flat, low elevation geography. The training was hosted by the Medical University of South Carolina (MUSC) and included people from Communities in Schools - Charleston (CISC) and the MUSC College of Nursing.MUSC Community Health Mapping Training SessionFirst everyone learned how collect GPS field data with iPads. For this we used a new app named iForm. This app was used in lieu of EPI Collect, which no longer supported on iOS. (The next blog post will cover iForm in more detail.) iForm is an app very similar to the Android app ODK Collect, allowing a custom data collection form to be developed. To practice we collected bike rack locations  and seating areas around the MUSC campus. The afternoon was spent working with everyone's  data. GPS data points were brought into QGIS and shown against some local Charleston GIS data layers.MUSC Data Points in QGISThe points were also uploaded to CartoDB. CartoDB is another new component of the Community Health Mapping workflow. It has become more intuitive than GIS Cloud and worked really well. (Note: There will be a post on using CartoDB soon too.)The following day I visited CISC's Derek Toth and three of his students at St. John's High School on John's Island, SC. Over a working lunch Mr. Toth showed students how easy it is to collect GPS points with their iPhones. We collecting several points while walking around the campus.IMG_5459Afterwards we went back inside and showed them how to upload the points into CartoDB and make a map. The figure below shows the results of 45 minutes worth of work! Click on the map to open the live version.St Johns High School MapThis spring these three juniors will be leading the charge to map their island!  They will be presenting their work to the National Library of Medicine later this spring. I look forward to seeing their work!St. Johns High School Mapping Team
Map and Analyze Field Data with QGIS

After community field data collection, the next step typically involves bringing the data into a desktop GIS. This is the middle step in the workflow outlined in the Introduction. Here the data can be viewed against basemaps such as Google or OpenStreetMap, and combined with other organizational data. This is where analyses can be conducted. Presentation quality maps can also be generated in this step.The software we found to be the best fit is QGIS. This is an open source desktop GIS software. It has many strengths:

  • It can consume many kinds of data, including all the data that would come out of the field data collection apps.
  • It is both intuitive and robust.
  • It has a large suite of geoprocessing tools for analyzing data.
  • It will run on Windows, Mac, or Linux.
  • It is free to download and install.
  • It is well documented.
  • There is a large user community.
  • New functionality is being continuously added. New stable versions are being released every 4 months!

 QGIS Browser:QGIS has two main applications: QGIS Browser and QGIS Desktop. Browser allows you to preview your GIS data. It is similar to Windows Explorer, or Mac Finder, but is designed to work with GIS data. It has a File Tree, a main Display Window, Database Connections and Display Tabs (See figure below). It allows you to view basic information about a GIS layer and preview both the spatial features and the attributes. Data can be dragged and dropped from QGIS Browser to QGIS Desktop.QGIS BrowserQGIS Desktop:Desktop is the program for conducting analyses and making maps. It comes with tools for editing and manipulating GIS data. The main interface is similar to well known proprietary GIS packages with a Table of Contents along the left side. This shows your data layers and the symbol applied to them. The majority of the space is taken up with the Map Window (See figure below). Buttons along the left side allow you to add data to a map. Buttons along the top allow you to pan and zoom into the map. There are additional editing and data analysis tools available from menus.QGIS DesktopWith QGIS Desktop you can perform analyses such as calculating distances to resources, characterizing communities with socioeconomic data from the U.S. Census (NOTE: you will need to obtain data from the U.S. Census to do this), or generate new data like density surfaces.  The sky is the limit.QGIS Desktop also comes with a Print Composer (See figure below). This opens in a separate window and allows you to craft a publication quality map. Common map elements such as a title, legend, scale bar, north arrow, logos, and text can be added. The final map can be exported in a variety of common image formats such as: jpg, png or tif. Maps can also be exported as pdf's. If you want to do additional design work in a program like InkScape or Adobe Illustrator the maps can also be exported as svg files.QGIS Print ComposerResources:While fairly intuitive, GIS work can still be rather complicated and full of jargon. There is a learning curve involved. To help with this we have resources that explain how to install QGIS and bring in data from the three recommended field data collection apps.For more complete GIS training with QGIS there is the newly created FOSS4G Academy. This is a five course curriculum teaching GIS principles via QGIS. The material is available for free here: http://foss4geo.org/. The courses include:

  • GST 101 – Introduction to Geospatial Technology
  • GST 102 – Spatial Analysis
  • GST 103 – Data Acquisition and Management
  • GST 104 – Cartography
  • GST 105 – Remote Sensing

QGIS also comes with thorough documentation.Download it today and try it out!