GIS

Visualizing an Intervention for Tobacco Control

Submitted by Jennifer Rewolinski

Dr. Heckman, an assistant professor of psychiatry and behavioral sciences at the Medical University of South Carolina (MUSC) in Charleston, used Community Health Maps (CHM) tools in his research on tobacco control. Smoking is the leading preventable cause of death worldwide and costs the US $130 billion in direct medical costs annually. Smoking is still a major public health issue that influences mortality, morbidity, healthcare costs, the environment, and quality of life.

Dr. Bryan Heckman

Dr. Bryan Heckman

The outcome of Dr. Heckman’s precision medicine project will be a mobile app that aids smokers who recently quit by alerting them of proximity to stores which sell cigarettes or alternative nicotine products. Studies show that greater tobacco retailer density is associated with greater incidence of relapse; Dr. Heckman believes that mapping provides a new approach to visualizing environmental factors. A CHM training event at MUSC spurred his decision to integrate mapping into his own work using the CHM labs as a guide. These labs provide step-by-step instructions for implementing the CHM workflow. He used the data collection app Fulcrum on an iPhone to collect information on retailers: GPS coordinates, type, type of tobacco products sold, e-cigarette advertising, and photos. His team also used a high-powered Trimble GPS device to test accuracy of phone GPS, and the accuracy of phone GPS was adequate and more cost effective than more expensive GPS devices.

Figure 1. Dr. Heckman’s in progress map shows higher numbers of tobacco retailers are associated with  Census Tracts that have both higher poverty and a higher percentage of minority populations.

Figure 1. Dr. Heckman’s in progress map shows higher numbers of tobacco retailers are associated with  Census Tracts that have both higher poverty and a higher percentage of minority populations.

Dr. Heckman integrated his Fulcrum data into QGIS software. He added national datasets from the American Community Survey and Behavior Risk Factor Surveillance System for Census tract data, and Synar for retailer data to check the validity of the Fulcrum data; field data collection with Fulcrum revealed a more accurate list of current retailers than the national secondary datasets provided. Dr. Heckman believes QGIS is a powerful tool with many features; he was not only able to use QGIS to monitor and visualize his research questions but also to guide his project decisions and hypotheses. His results will guide policy recommendations, improve access to care, and deliver novel interventions.

Figure 2. Dr. Heckman’s in progress map shows higher numbers of tobacco retailers are associated with Census Tracts with higher percentages of minority populations

Figure 2. Dr. Heckman’s in progress map shows higher numbers of tobacco retailers are associated with Census Tracts with higher percentages of minority populations

For those attempting to undertake a health GIS project on their own, Dr. Heckman emphasized that all the tools needed are provided on the CHM blog; only time and patience are required. He also recommends asking for help and reaching out to other CHM users who have experience. Dr. Heckman’s project has the potential to affect behavior change and reduce health disparities via a mobile intervention app which identifies nearby tobacco retailers and prompts and provides an intervention and awareness of a health issue. Dr. Heckman’s experience is an example of how the CHM blog and tools might be used.

Dr. Heckman would like to thank Kurt Menke and the CHM team, Dr. Williamson from MUSC, and his mentors for inspiration and growth. He would also like to acknowledge the Hollings Cancer Center and American Cancer Society Institutional Research Grant that helps support his work, and Alex Hirsch for his help coordinating the project.

The CHM team would like to extend their own gratitude to Dr. Heckman as they sincerely appreciate his time and his support of the CHM blog.

How Does Esri Software Fit into the CHM Workflow?

Community Health Maps (CHM) necessarily focuses on low cost and open source tools. This is because our goal is to find mapping tools that can be used by any community group, no matter the budget or resources. However, that doesn’t preclude people from using Esri software or other proprietary mapping tools too.2016-07-28_112719One benefit of using Fulcrum for data collection, and QGIS for analysis and cartography, is that they both support a wide range of common GIS formats. This means that the data you’ve created via these two platforms can be easily brought into Esri’s ArcGIS software. Similarly if you have data you have created with Esri tools they can be brought into QGIS or Carto. This feature is known as 'interoperability' and QGIS is highly interoperable. For example, QGIS can work with shapefiles, Esri personal and file geodatabases, KML and over 100 other formats!From the outset we knew there were many scenarios for mapping software being used in public health and community organizations.  For instance, there are larger organizations who are already using tools such as Esri’s ArcMap, ArcGIS Pro or ArcGIS Online. With this scenario there are still several reasons the CHM mapping tools could be useful.

  • It might be that the organization doesn’t have enough Esri licenses for everyone in the office who’s interested in doing mapping work. In this case Fulcrum, QGIS or Carto could be used to fill the need.
  • An organization may find that their Esri license doesn’t give them access to certain tools they need. They could use comparable tools in QGIS to fill the need, without having to pay extra license fees just for one or two extra tools.
  • There may be smaller affiliated satellite groups that don’t share the same access to the software. In this case, these groups could use CHM suggested tools. Because of good interoperability they would then be able to provide data back to the central hub, where they could be incorporated seamlessly with the rest of the organizations data.
  • There may be certain tasks that are easier and faster to do in one piece of software and others that are easier in another. For example, I use both ArcGIS and QGIS daily to do different things. Many beginners also find QGIS to be more intuitive. GIS is simply a tool and by incorporating QGIS you are giving yourself a bigger toolbox.

If you are in an organization using another software package don’t worry. The tools we are promoting as part of this project can be integrated quite seamlessly with your current tools. It doesn’t have to be Coke or Pepsi, or Ford or Chevy. You can have both!

Mapping Curb Ramp Accessibility around a Silver Spring, MD Assisted Living Facility

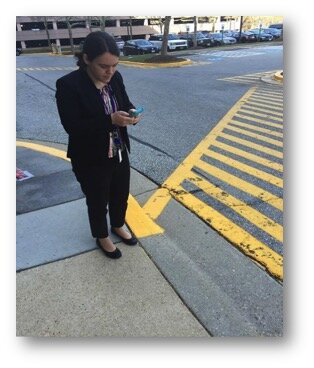
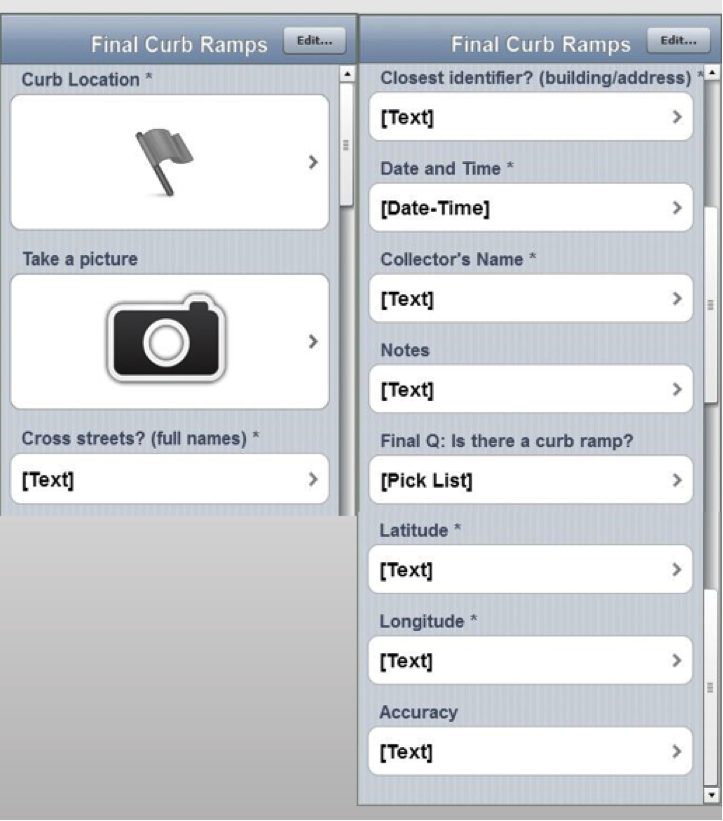
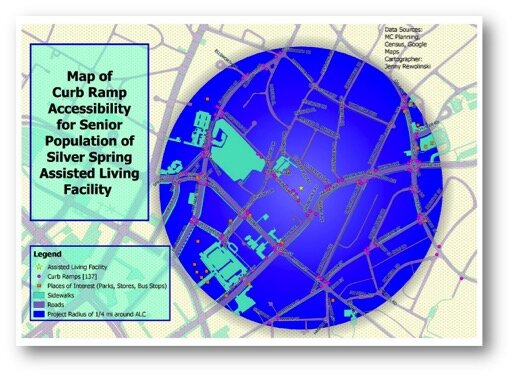
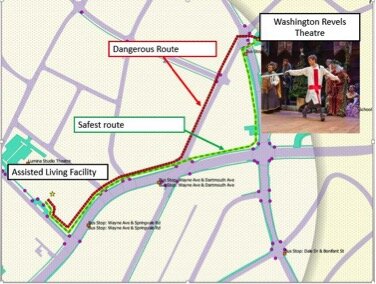
Submitted by Jenny Rewolinski, University of Maryland, B.S. Community Health 2016I just completed a spring internship with the National Library of Medicine (NLM). My goal was to demonstrate what a typical user of the Community Health Maps (CHM) blog might experience, while using the low cost resources it reviews to develop a mapping project with a public health focus. I read through the case studies on the CHM blog and used its labs to develop my project plan and to guide my related decisions.Because of my experience with elderly relatives and my background in public health, I centered my project on how the senior population of a nearby Assisted Living Facility might safely navigate local sidewalks. According to the 2014 American Community Survey, 23% of people over 65 have some sort ambulatory disability. With this in mind, I decided to map local curb ramps --sloped transitions between sidewalks and streets which function as accessibility enhancements to help those with mobility issues to cross streets safely.JennyDataCollectionI used CHM Lab 1: Field Data Collection to learn how to design my own data collection form using iForm. My Curb Ramp form captured curb ramp location, conditions, and other observations such as seniors using the curb ramps, steep or damaged curb ramps, and a lack of sidewalks in the area. As discussed in a prior blog post, How Accurate is the GPS on my Smart Phone?, phone geolocation is usually accurate up to 8 meters. This was not precise enough for my curb ramp data, so I corrected for this on my form.  Over the course of 8 hours spanning 2 days, and with 2 other interns I collected 103 existing curb ramps and locations where curb ramps might aid accessibility.iFormCurbRampFormNext, I brought my iForm curb ramp data from my phone into the QGIS software by using instructions from CHM Lab 2: Bringing Field Data into QGIS.  I also used CHM Labs 3: Combining Field Data with Other Organizational Data and CHM Lab 4: Basic Spatial Analysis  to add data layers and to perform spatial analysis to finalize my map.MapThis is my project map! I completed construction of my map using CHM Lab 5: Cartography with QGIS. In addition to my curb ramp data points, I added data layers for sidewalks, roads, places of interest (such as grocery stores, restaurants, bus stops,  theaters), and my Assisted Living Facility. My goal was to raise awareness of how accessibility can impact seniors’ sense of autonomy and empowerment, and their ability to exercise and to lead a healthier lifestyle. This map also provides recommendations for where more curb ramps should be placed based on observations during data collection. I plan to discuss this map and curb ramp recommendations with the city of Silver Spring and to create “safest route” guides for popular local destinations.SafestRouteGIS has a huge potential to help us analyze health issues. When I began my project at NLM, I thought I would simply be mapping the location of curb ramps near a local Assisted Living Facility; however I discovered the significant need for more curb ramps as well as sidewalks around my project area.I believe the conclusions I was able to reach by using the low cost CHM resources CHM are accurate and workable. I came to NLM with little to no GIS knowledge yet I learned from the CHM GIS labs, collected curb ramp data points and created a map that may bring awareness to a public health issue. In doing so I believe my experience is typical of many CHM users.
If I can do it, you can too!

Announcement: Extreme Heat & Health Webinar

There will be a webinar next week entitled: Extreme Heat and Health: Creating Environmental Intelligence Through Science, Predictions, and Engagement. The specific date and time are: April 28th, 2016 from 4 - 5:30pm EDT. This will likely be an interesting webinar for many Community Health Mappers! Click this link to learn more.2016-04-22_101608

A New Version of QGIS v2.14 Has Been Released!

Currently a new version of QGIS is released every four months!  To help users deal with this rapid development pace, the version put out each spring is designated as a long-term release (LTR). This means it will be supported for one calendar year. After that, new stable versions continue to be posted quarterly and any bug fixes associated with those quarterly versions are applied to the LTR. The LTR is recommended for production environments. It has a slower release cycle, and receives regular bug fixes throughout the year. Monday February 29th QGIS 2.14, the next LTR was released. It is nicknamed 'Essen' after the town in Germany where a recent developer meeting was held.essenEssen has a lot of new features. You can visit the Visual Changelog to read about all the new features in detail. You can also see who developed and sponsored each new feature. Community Health Mappers might be especially interested in these new features:

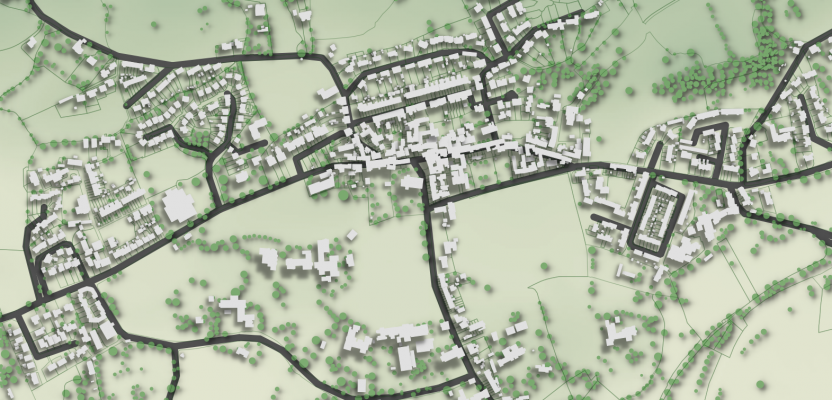
  • the new 2.5 D renderer which allows you to extrude features into space.

With25DandTreesShaddow-832x400

  • improved labeling
  • better control over map elements in the Print Composer
  • an improved Processing Toolbox
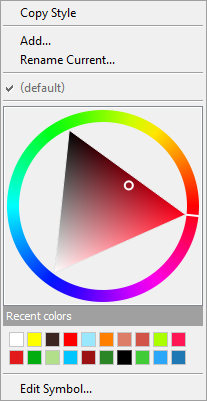
  • the new widget you get by right clicking on a layer in the Layers Panel and choosing Style. It allows you to change the color for a symbol without having to open a single dialog box!

2016-03-02_151603If you are using QGIS you should visit the download page and install the latest version! Note that the Mac installer takes a little longer to assemble and may not be available for several more days.Happy GIS'ing!

Community Health Mapping: A New Year Review

To start the New Year I thought I’d begin with a review of Community Health Mapping (CHM). There are a lot of new project partners, and I thought it would be a good time to give a project overview. CHM is a collaborative effort between the National Library of MedicineCenter for Public Service Communications and Bird’s Eye View. The National Library of Medicine is funding the initiative.The overall goal is to empower community organizations serving vulnerable or underserved populations with low cost, intuitive mapping technology. Therefore we’ve been working with programs organizations who:

  • Focus on vulnerable populations
  • Frequently use and collect data
  • Need effective, scalable & easy to use mapping tools
  • Lack resources (i.e., for proprietary GIS training & software)

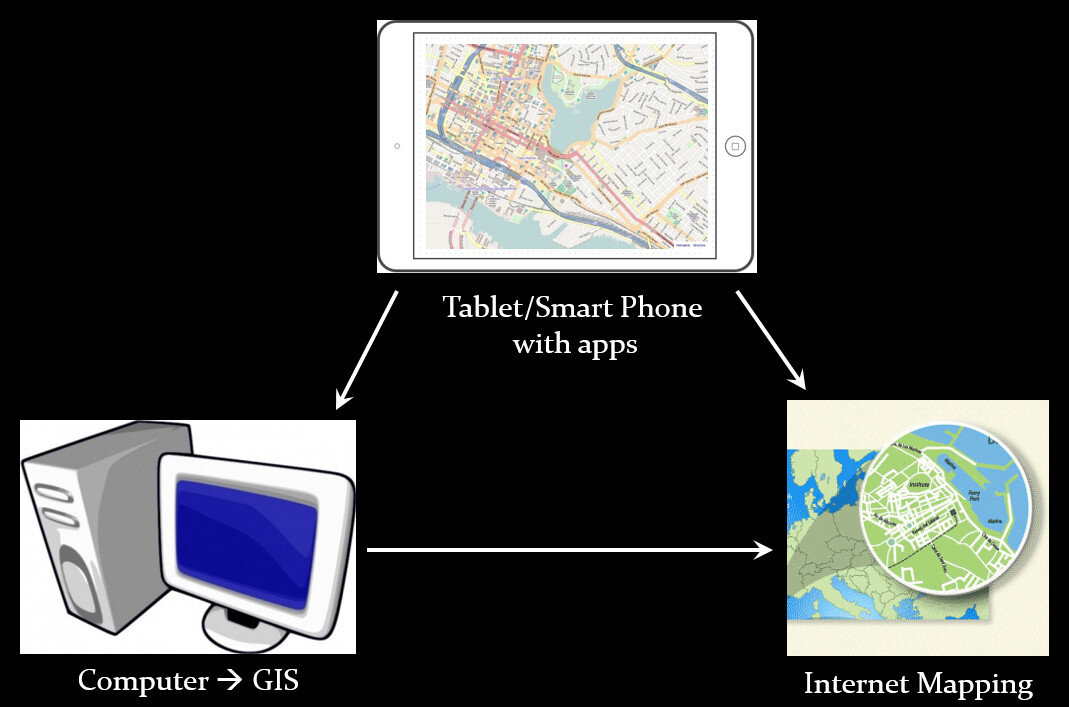
We have identified a suite of tools that allow you to collect custom field data, analyze that data, combine it with other spatial datasets, and generate both static maps and/or dynamic maps on the internet. This allows organizations to collect and work with their own data, and if appropriate, share it with others. CHM involves three components that meet all basic mapping needs:

  • Field Data Collection
  • Desktop Analysis and Cartography
  • Internet Mapping

Community Health Mapping WorkflowA given project may not require all three, however, collectively these components address the basic needs of all mapping projects.Field Data Collection:Rather than focusing on the use of expensive GPS receivers, we recommend the use of smart phones and tablets for these reasons:

  • Most community-based organizations already have them!
  • Many know how to use them
  • They're intuitive
  • They're portable
  • They come with an on board GPS receiver (iPhone 5 uses GPS + GLONASS)
  • Have on board cameras
  • Can connect to wireless networks
  • Access to the internet
  • Email is available
  • “There's an app for that!”

SmartPhones and Tablets vs. Traditional GPS ReceiversOf course an important consideration is horizontal accuracy. You can read our blog post on that topic to see if mobile smart devices meet your project needs.When collecting data you need to be able to develop your own custom data collection form. The top three mobile apps we have found are:

Desktop Analysis and Cartography:After community field data collection, the next step typically involves bringing the data into a desktop GIS. This is the middle step in the workflow. Here the data can be viewed against basemaps such as Google or OpenStreetMap, and combined with other organizational data. This is also where analyses (proximity, density etc.) can be conducted. Presentation quality maps can also be generated in this step.The software we found to be the best fit is QGIS. This is an open source desktop GIS software. It has many strengths:

  • It can consume many kinds of data, including all the data that would come out of the field data collection apps.
  • It is both intuitive and robust.
  • It has a large suite of geoprocessing tools for analyzing data.
  • It will run on Windows, Mac, or Linux.
  • It is free to download and install.
  • It is well documented.
  • There is a large user community.
  • New functionality is being continuously added. New stable versions are being released every 4 months!

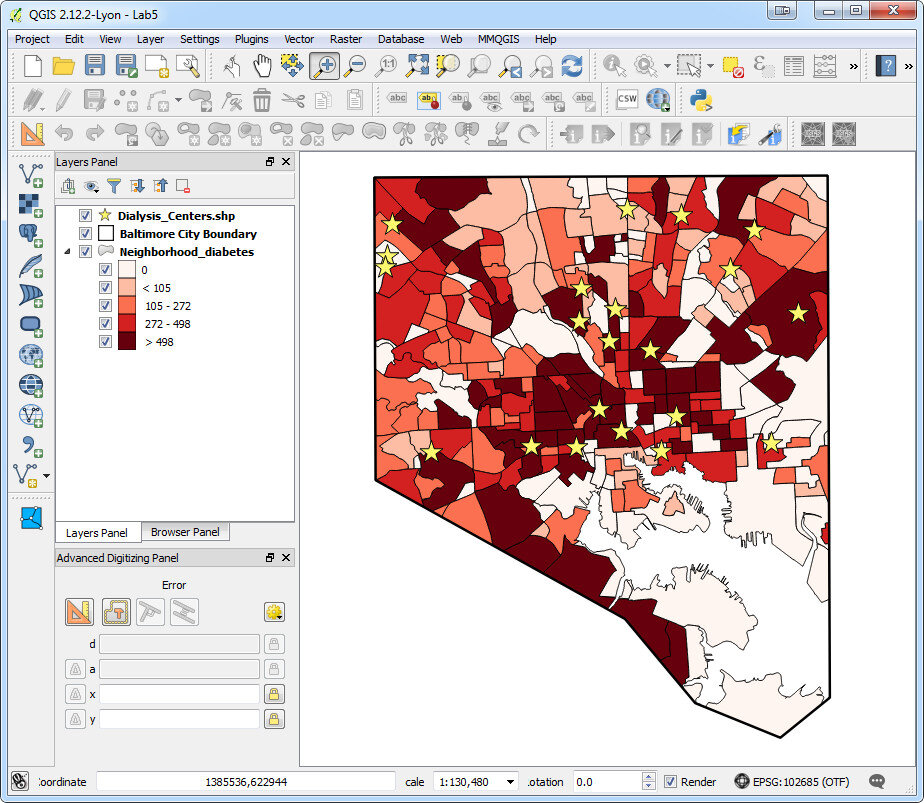
Baltimore Diabetes Data in QGIS DesktopWeb PresentationOften you may want to present an interactive map of your results. Interactive means the map reader can zoom in/out, pan the map and turn layers off and on. For this we recommend CartoDB.You can sign up for a free account, which gives you 50Mb of storage space. Data can be collected with a smart phone or tablet and brought directly into CartoDB.  It is a very intuitive platform. You can literally drag and drop a spreadsheet onto the CartoDB page and have the data upload to your account.  It will accept the most common geospatial file formats including: spreadsheets and comma delimited text files with addresses or coordinates, KML/KMZ, GPX, and shapefiles.CartoDB also has great documentation including:

Baltimore Diabetes Data in CartoDBIn ConclusionThis blog has a lot of resources including reviews of mapping technology and case studies. You might begin by clicking on some of the links in this entry. We are also working on a 6 lab CHM curriculum that interested parties will be able to use to hone their skills. Stay tuned for that!We are always looking for new partners and continuously work to support current project partners. If you are interested, or have questions please don't hesitate to contact John Scott (jscott at cpsc.com) or Kurt Menke (kurt at birdseyeviewgis.com). Most importantly get out and do some mapping in 2016!   

Wildly Successful Community Health Mapping Workshops at MUSC!

Community Health Maps (CHM) conducted it's largest and most successful workshops ever at the end of September at the Medical University of South Carolina (MUSC). The training at MUSC was divided into three workshops and a presentation. The attendees were a mix of professors, students and researchers, most of whom had little to no experience with GIS. Despite this fact, nearly everyone was able to collect data and make a map. This is a testament to the easy to use nature of the CHM workflow.It began Monday morning with the first workshop. This was an Intermediate Session for those Community Health Mappers who had been working on projects since the April CHM workshop. We spent two hours covering more advanced topics and answering project specific questions.Kurt Menke explaining advanced QGIS features.Following that, Kurt Menke presented a CHM project overview at a brown bag lunch session to 30 attendees. Matt Jones closed this session with a 10 minute talk detailing how he used The Community Health Maps workflow this summer to map access to care on Johns Island.The second workshop was Monday afternoon. It was a two hour session covering field data collection with iForm, and mapping that data online with CartoDB. There were 55 attendees at this session, the vast majority of whom had no GIS experience. In just two hours all 55 attendees were able to collect field data and make a map in CartoDB!iForm and CartoDB Workshop AttendeesThe final workshop on Tuesday was a 5 hour session covering the use of QGIS. The workshop consisted of a custom Charleston based QGIS exercise. Each of the 35 participants worked with a set of Charleston GIS data while learning the basic layout of QGIS. They learned how to add data, style it, and compose a map. The workshop ended with a discussion of each participants goals and project specific questions.QGIS Workshop AttendeesIn total almost 80 people attended one or more sections of the training! Thanks go out to Dr. Deborah Williamson for hosting the workshops, Dana Burshell for organizing the entire event and assisting during the workshops, and to Sarah Reynolds who was invaluable in providing Mac and QGIS support!

QGIS 2.8.1 Released

Today the next stable version of QGIS was released. It is being called QGIS version 2.8 'Wien'. Wien is German for 'Vienna' which was the host city for the QGIS developer meetings in 2009 and 2014.QGIS2.8_splashRecently a new version of QGIS has been released every four months. This rapid pace of development has its pros and cons. On the plus side, the software is rapidly growing and improving. On the con side it has made it difficult to maintain documentation. It has also been an issue for people working on large projects. They have had to deal with the software changing every four months.QGIS 2.8 is a special release because it is the first in a series of long-term releases (LTR's). The idea is that one release per year will be an LTR. This means that the LTR release will be supported and available for download for one year. This way people needing stability can use this until the next LTR is released a year from now.Some of the highlights are:

  • Numerous bug fixes and stability improvements
  • QGIS Browser is more responsive
  • Ability to select the units in the Measure tool
  • Improvements to editing: better control of snapping and a new suite of Advanced Digitizing tools
  • Improvements to the Map Composer such as better control over coordinate graticules and map rotation.
  • Symbology improvements such as filling polygons with raster images, ability to have multiple styles per layer.

The detailed list of new features can be found here: http://www2.qgis.org/en/site/forusers/visualchangelog28/index.htmlVisit the download page and take the new version for a spin. Remember you can install it on Windows, Mac and Linux! 

Noise Pollution and Health in the Urban Environment: A Pilot Project

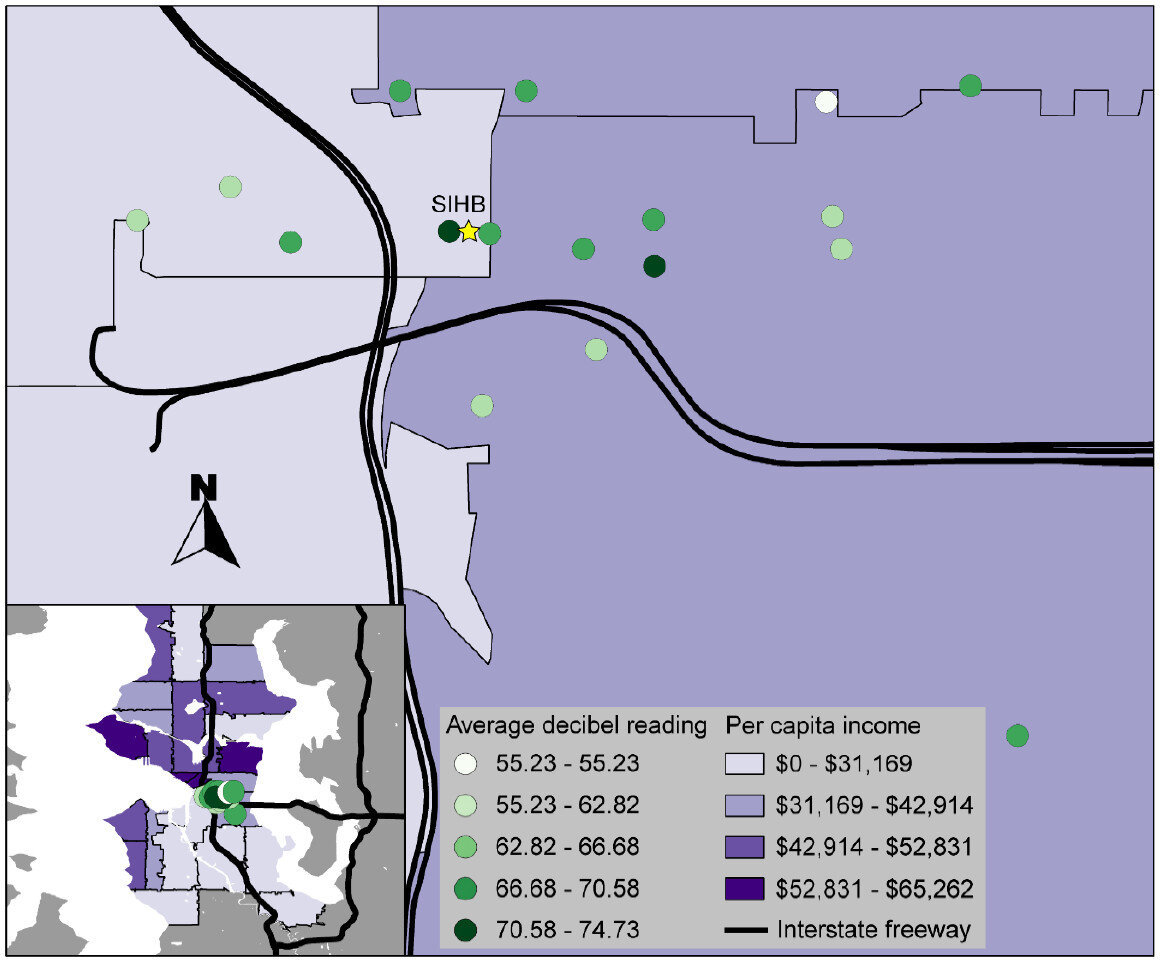
In October 2013, the Seattle Indian Health Board’s (SIHB’s) Urban Indian Health Institute (UIHI) completed a noise pollution pilot study. The goals of this project were: 1) to evaluate the feasibility of community data collection and analysis via a low cost GPS/GIS workflow, and 2) to offer recommendations on the feasibility and next steps for scalability to the larger Urban Indian Health Organization (UIHO) network. The collected data could additionally illustrate community health needs when merged with health or other contextual data for analysis, but these analyses were not the primary focus of this pilot. We chose to look at noise pollution because it is an environmental health concern that has been linked to a variety of health conditions in both occupational and community studies and it is easy to measure with portable devices.For field data collection, we used an iPad Mini with the GISPro and Decibel 10th apps. For mapping and spatial analysis, we used the open source desktop GIS software QGIS (www.qgis.org). While GISPro is a paid iPad app, the other programs are free. Data collection participants were staff recruited from the SIHB’s administrative, clinical and UIHI departments. We selected participants from this pool because they are representative of the staff at UIHOs who likely have limited experience with data collection and GIS. UIHI project staff trained seven participants in the iPad workflow and data collection process. This workflow consisted of five steps: 1) collect noise data with Decibel 10th, 2) export noise data via email, 3) take a site picture, 4) collect GIS data with GISPro and 5) export that GIS data.Select pictures of data collection sites, taken by study participants using an iPad Mini; Seattle, WAWhen the volunteer participants were finished with data collection, project staff compiled and analyzed the data using QGIS and Stata. Data were merged with socioeconomic indicators from the American Community Survey by zip code. Participating staff were asked for their feedback about their experience and the usability of the tools.Average decibel reading at the 17 data collection sites and per capita income of zip codes, location of the Seattle Indian Health Board indicated by yellow star; Seattle, WA; October 2013That feedback, combined with the experience of project staff, suggested that the GIS software tools were user-friendly and highly effective. Thus, they are likely to be attractive to organizations with limited technology budgets. However, some of the other resources necessary for this project (i.e. the GISPro mapping app, the iPad and general GIS software expertise) are expensive and may be limitations for many UIHOs. In the future, the UIHI would like to use these tools to better understand the health of the community, as well as assist UIHOs in conducting similar projects in their service area.For more information about this project, view the project brief at http://www.uihi.org/wp-content/uploads/2014/08/GIS-Project-Brief_20140604.pdf.The UIHI is a division of the SIHB and is one of 12 Indian Health Service tribal epidemiology centers (TECs). Unlike the other TECs that focus on geography-specific tribal populations, the UIHI is national in scope, focusing on American Indians and Alaska Natives (AI/ANs) living in urban areas. The UIHI supports the efforts of Urban Indian Health Organizations (UIHOs) nationally, as they serve the health and social support needs of their urban AI/AN communities.The Center for Public Service Communications and the National Library of Medicine provided funding for the UIHI to complete this project.

Display and Share Your Maps Online via GIS Cloud  

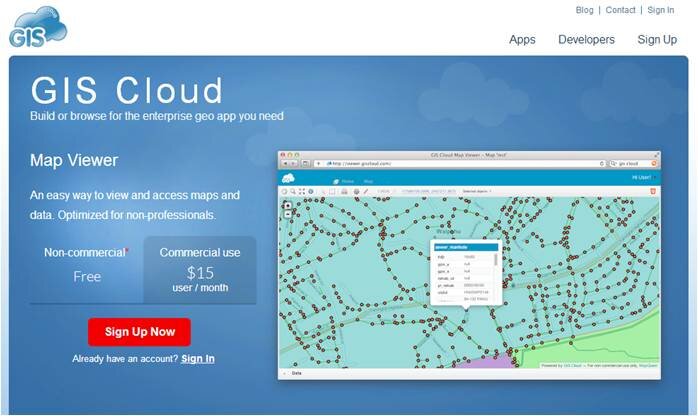
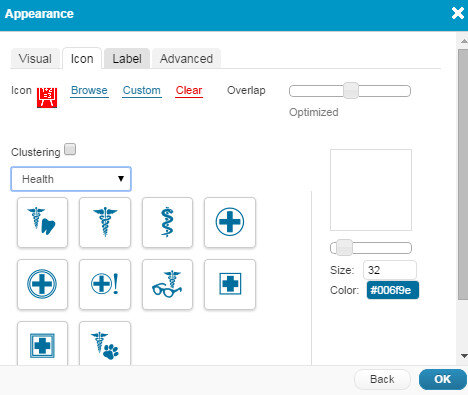
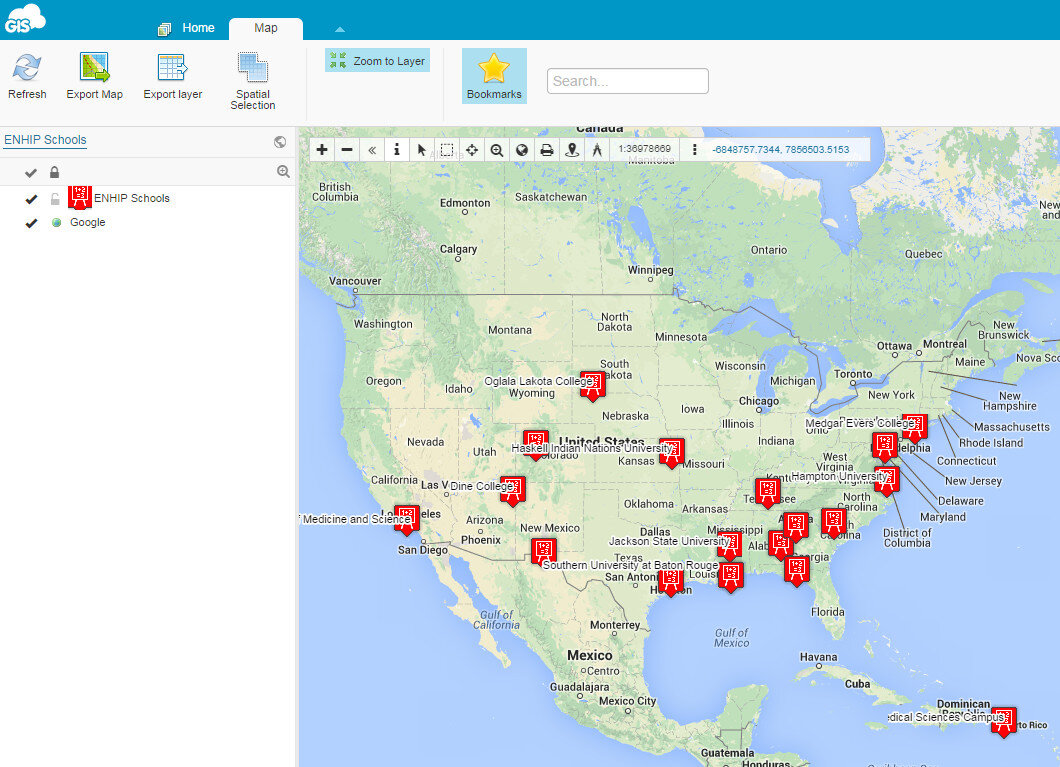
The third step in the workflow (outlined in the Introduction) is to share your maps online via GIS Cloud.  This is an online mapping platform. You can sign up for a free account, upload your data, and share your maps with others. The maps will be dynamic, meaning you can do things like pan and zoom, turn layers on and off and identify features.GIS Cloud HomepagePricingYour free account comes with a Map Viewer and Map Editor and gives you 100Mb of space in your cloud account. If you require more space you can upgrade to Premium subscription which offers 1 Gb of space. Premium accounts cost $55/month.Data UploadGIS Cloud accepts all common GIS file formats and the data upload section is very intuitive. You can zip all your data and just upload the zip file and GIS Cloud will take care of the rest. You can even drag and drop files anywhere in the browser and they will upload to your account. Once uploaded it offers a nice range of options for symbolizing your data.GIS Cloud Symbology OptionsMap EditorHere you have a variety of tools available including those for data editing, feature selection, basic analysis, table joins, geocoding addresses. It even has a database manager. You can create new layers in your cloud account and edit them here. With the analysis tools you can compute areas, measure proximity of one feature to another, buffer a layer by a certain distance, and create density maps.GIS Cloud Map Editor ToolbarsMap ViewerHere your data can be viewed against basemaps such as Google and OpenStreetMap. Your map can also be shared and published. There are several ways to share your maps. The two easiest methods are to provide the link to your map, or embed the dynamic map in a web page. Clicking the Share and Publish button opens the window below. Here you are provided the url to your map viewer and the javascript for embedding the map into a webpage. I would have embedded a dynamic map here,  however, WordPress does not allow bloggers to post JavaScript on WordPress.org blogs. You can also share your map with other GIS Cloud users by Publishing the map. Click on the image below to open up the ENHIP Schools in a GIS Cloud Map Viewer window.GIS Cloud Map ViewerResourcesOur Resources page has a GIS Cloud document that covers uploading data, styling data and sharing a map.There are additional online mapping platforms such as CartoDB and MangoMaps. We found GIS Cloud to be the best combination of being intuitive yet powerful. However, all three options have free licensing levels. So you can try them yourself and decide which works best for you. These other options will be covered in future posts. Happy mapping!