Last week Community Health Maps traveled to Boulder, Colorado to teach a pre-conference workshop at Rising Voices 7. The theme was Converging Voices: Building relationships and practices for intercultural science. The conference was hosted by the National Center for Atmospheric Research (NCAR). The workshop was well attended with about two dozen participants representing numerous AI/AN tribes and other organizations. These workshop was part of the Community Health Maps project and was funded by the National Library of Medicine (funding for the workshop was provided under a sub-award from the National Library of Medicine to ICF International).The goal of Rising Voices is to "advance science through collaborations". Participants learn how indigenous and western scientific knowledge systems can compliment one another and advance our understanding of important issues in our communities. The focus is on climate.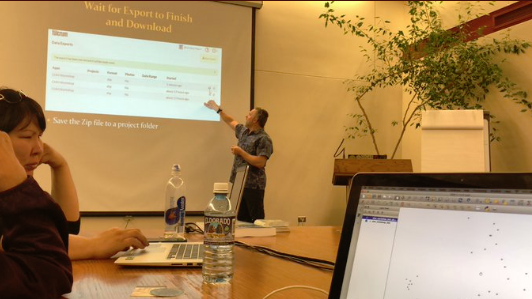 At three hours the workshop was slightly shorter than normal. This allowed us to focus on field data collection with Fulcrum and web mapping with Carto. With a few minutes to spare Kurt Menke shared QGIS. Since he didn't have time to really demonstrate the use of QGIS he focused on the open source aspect. As an open source project, QGIS is both GIS software and a community. As such it aligns with the ethics many communities try to foster at Rising Voices.
A Pair of Community Health Maps Workshops at the ASTHO Climate and Health Summit
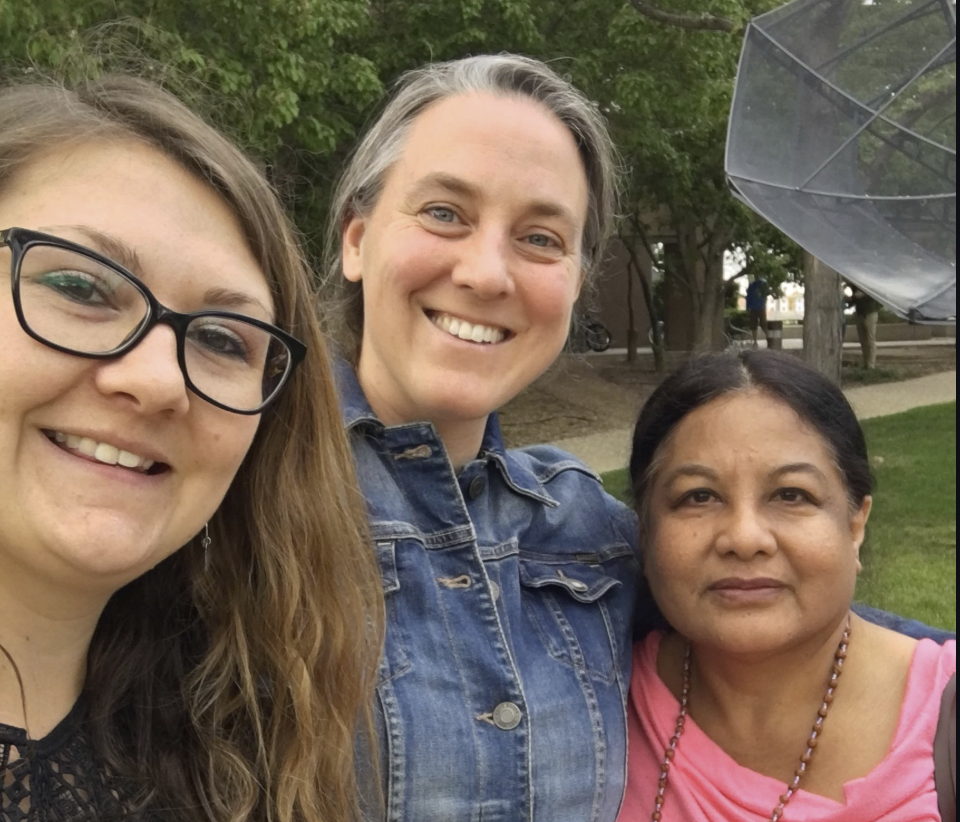
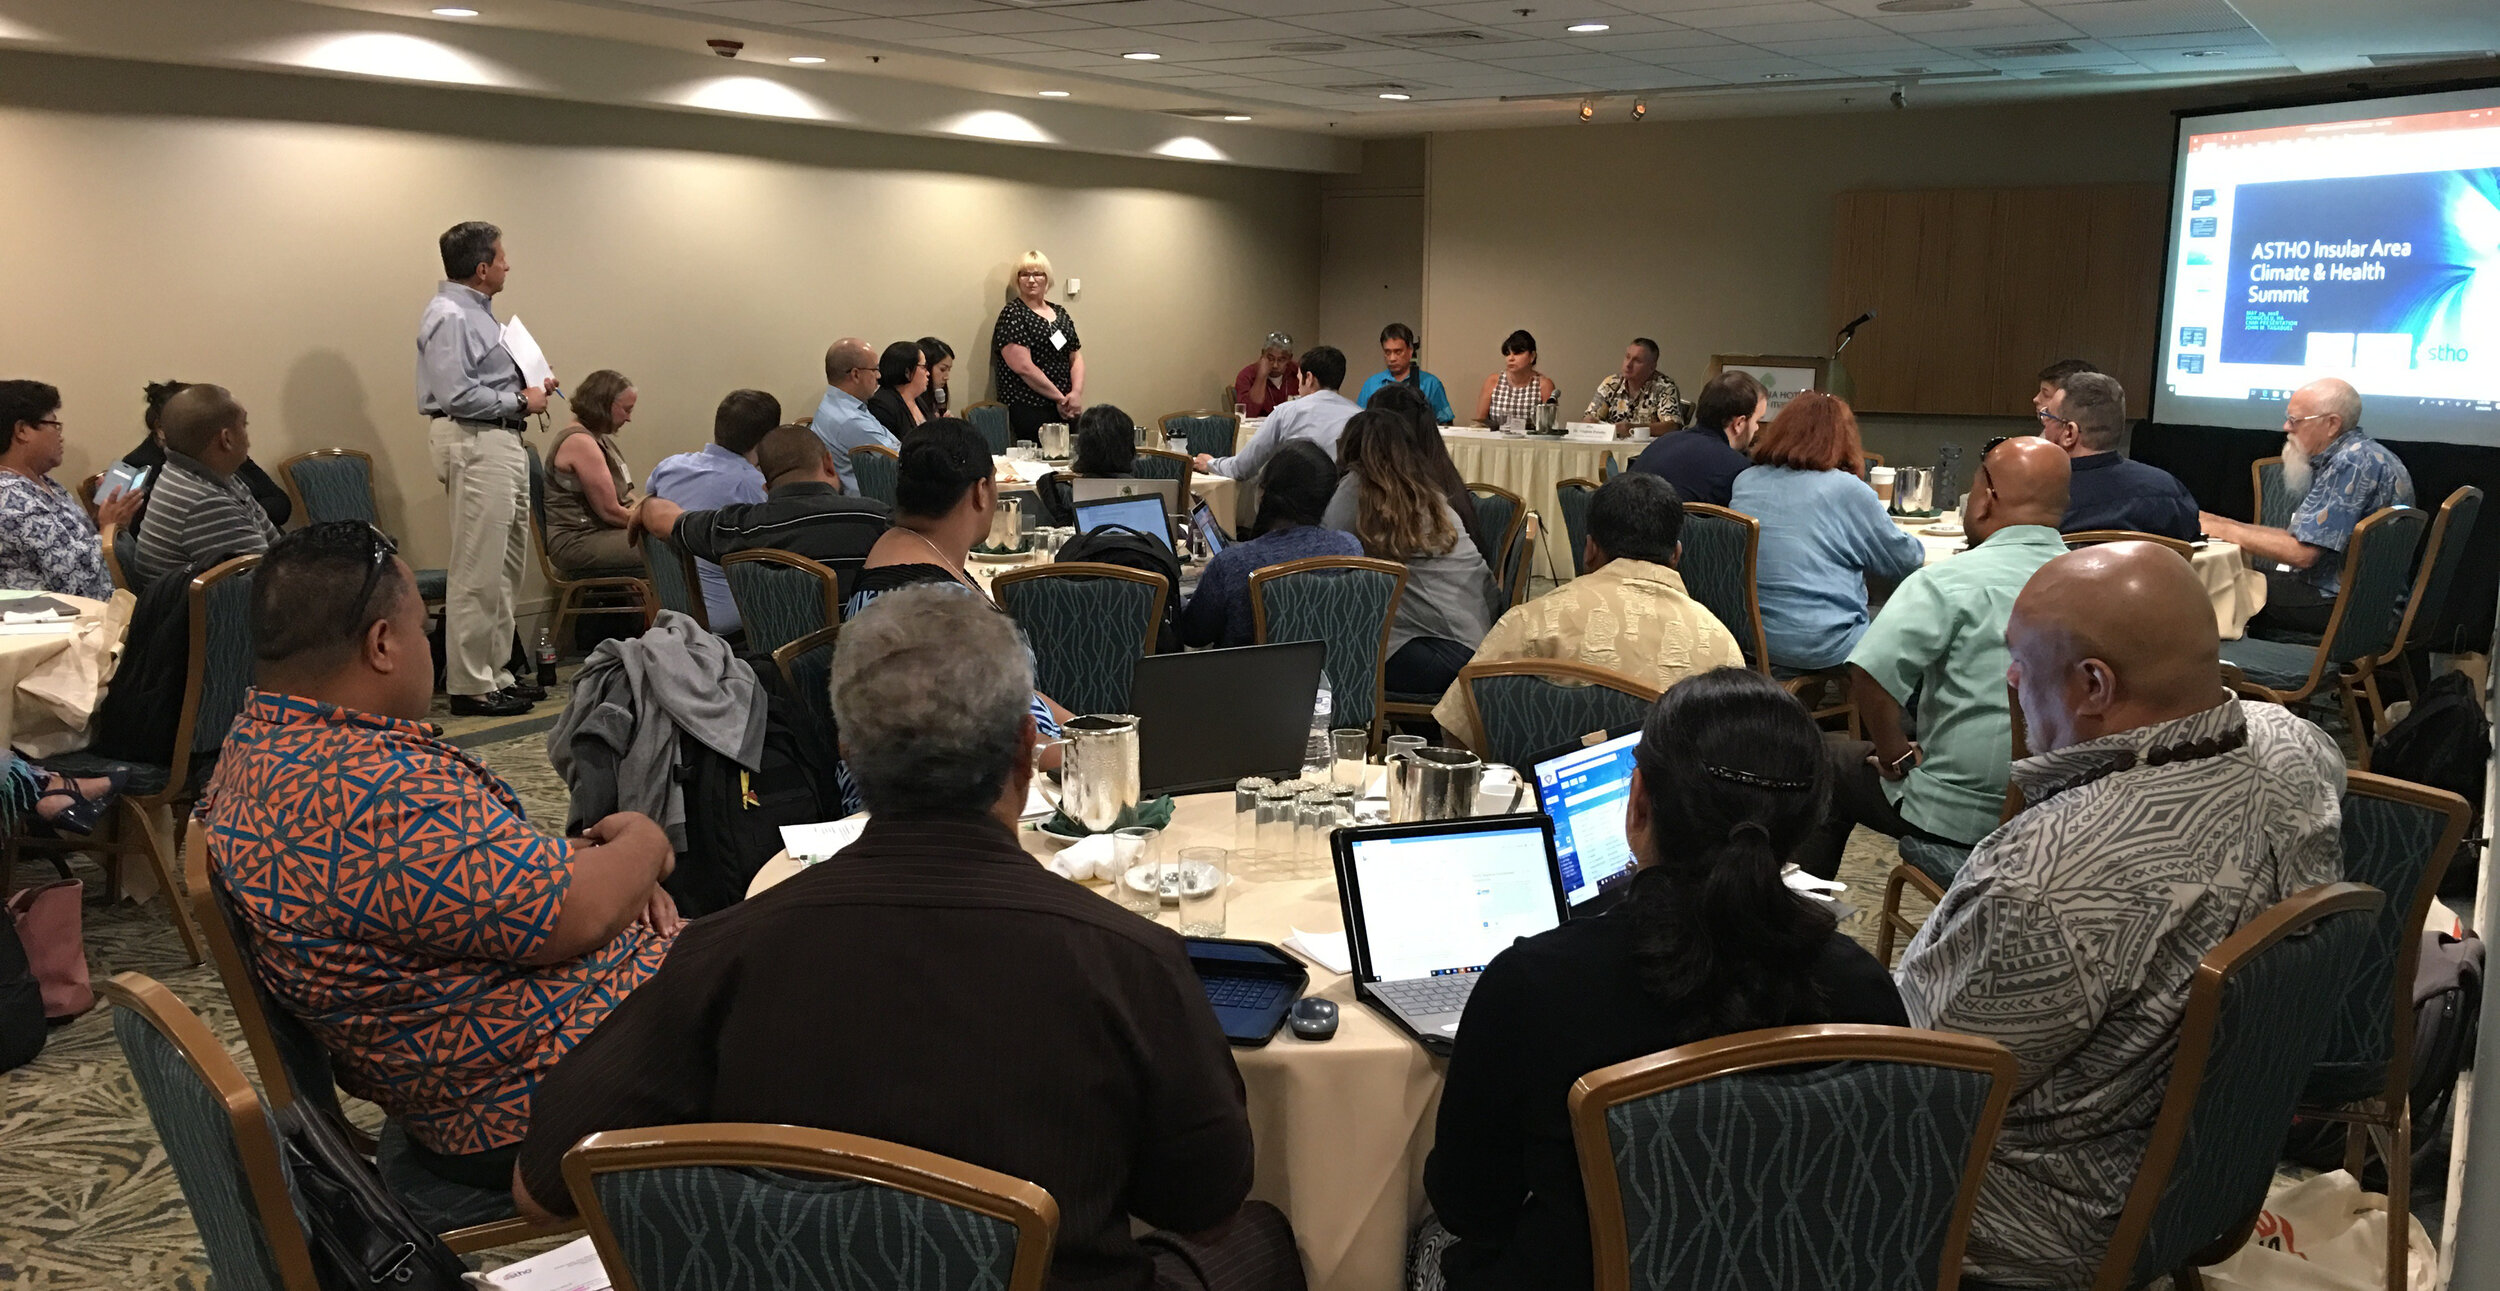
During the last week of May the Community Health Maps team (Janice Kelly, John Scott and Kurt Menke) traveled to Honolulu to participate in the Association of State and Territorial Health Officials (ASTHO) Insular Area Climate and Health Summit. There were representatives from:
- American Samoa
- Commonwealth of the Northern Mariana Islands
- Federated States of Micronesia
- Guam
- Palau
- Puerto Rico
- Marshall Islands
- U.S. Virgin Islands
- Hawaii Department of Health
- Pacific Island Health Officers Association (PIHOA)
- ASTHO
- CDC
- NOAA
 The first afternoon was focused on the impacts of climate change, preparedness and building resilience. There were great presentations on climate change (Capt. Barry Choy - NOAA), an overview of the tools and programs available from the CDC (Paul Schramm), and issues with vector-borne diseases and mosquitoes (Janet McAllister). The ASTHO grantees then gave some some sobering presentations on current issues people are dealing with in the Mariana Islands, Micronesia and the U.S. Virgin Islands.
 The second day focused more on tools and resources. There were more detailed talks given by the CDC on Technical Assistance for Vector Control and Tools and Resources for Climate and Water Safety. That afternoon we taught a 3.5 hour Community Health Maps Train-the-Trainers workshop to a group of health officials from each territory. We went through the entire CHM workflow: A) how to design a data collection form, B) how to collect data, C) how to make a map in Carto and D) how to bring the data into QGIS.
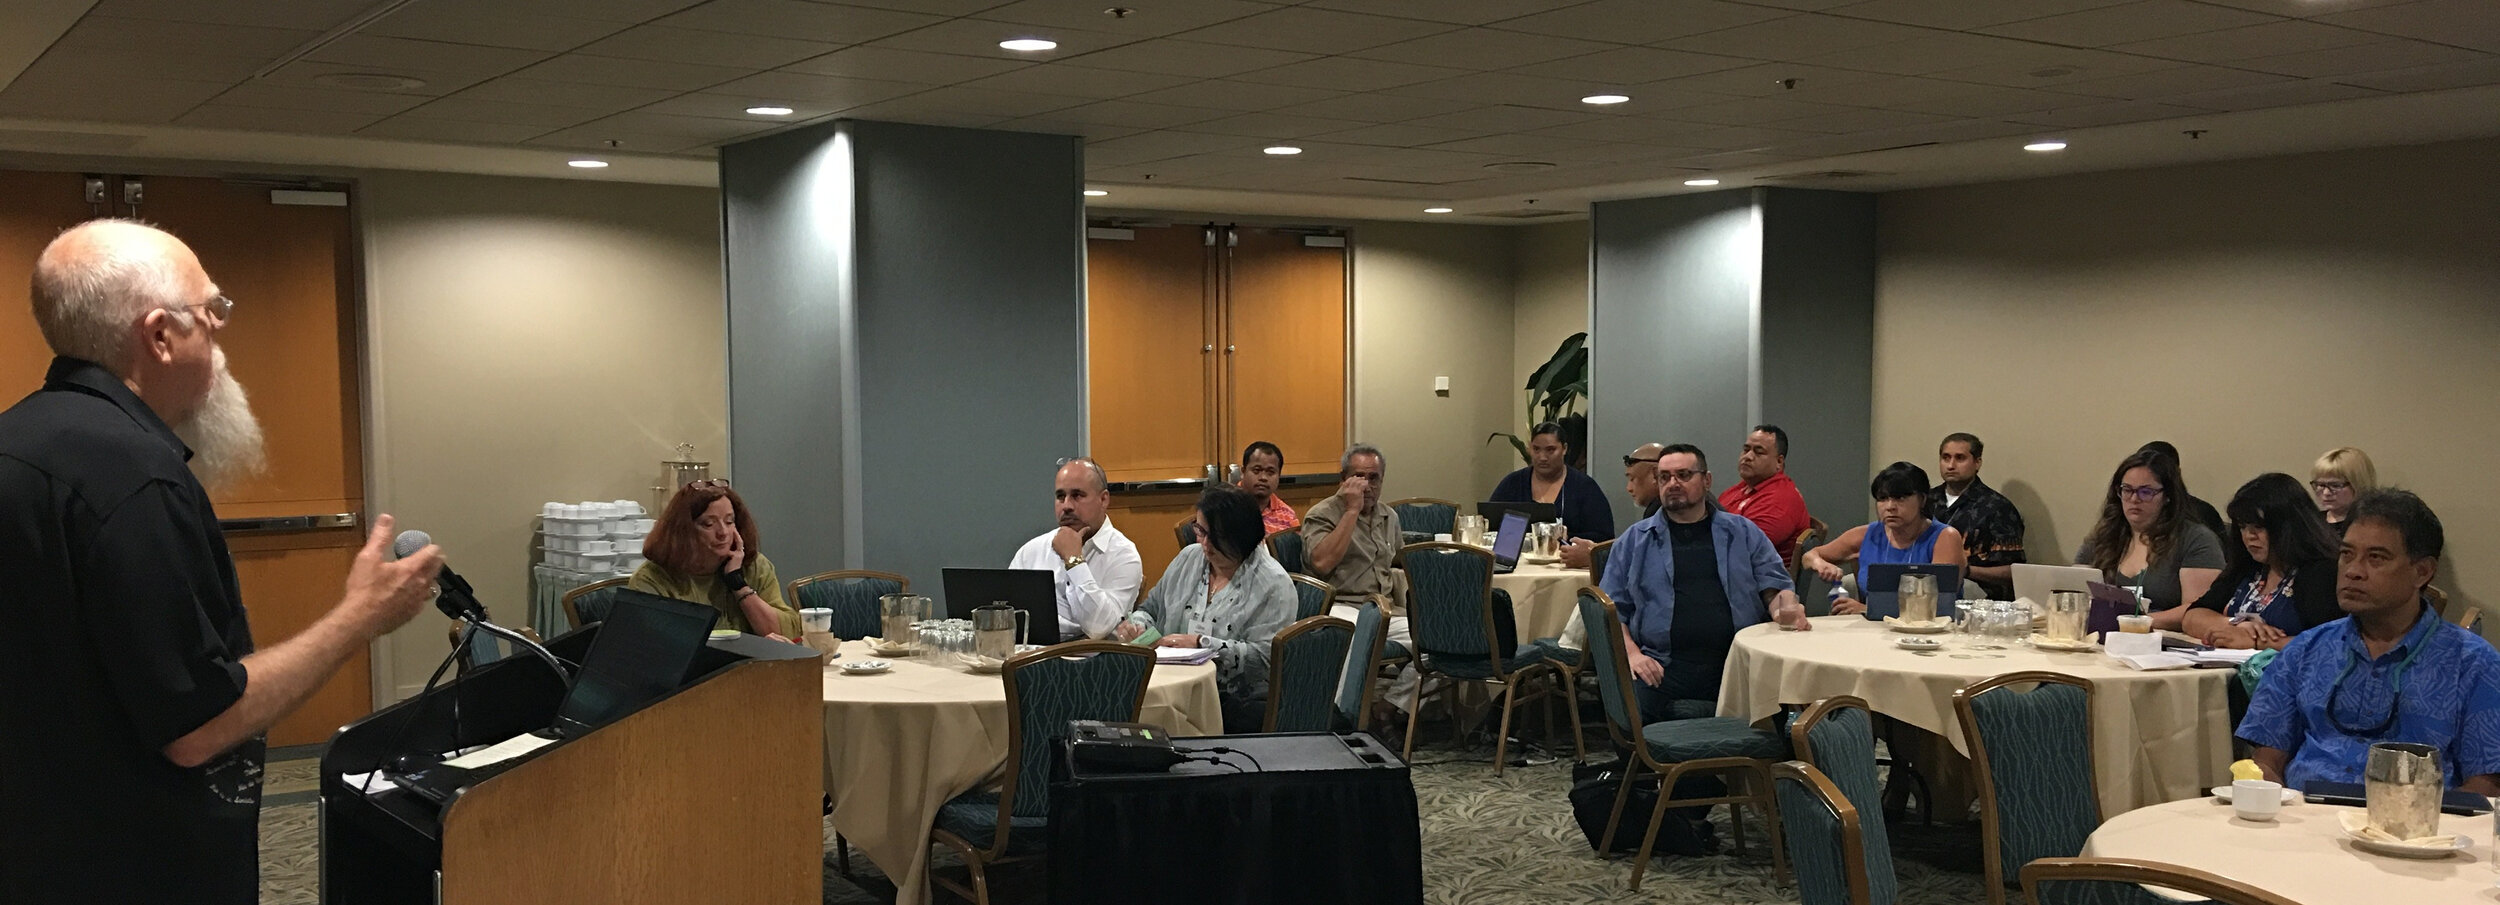 Most of the trainees had little to no GIS training yet instantly knew how mapping could apply to their work and lives. They want to map everything related to hurricane relief, salt water resistant taro farms, infrastructure related to mosquito outbreaks etc. A benefit of having the community do this is that they can be in charge of their own data and it helps build community relationships.Over the three days I heard a lot of side discussions about the usefulness of the free/low cost/open source CHM approach. The cost of proprietary solutions is often a significant barrier to entry into the world of community data collection and mapping. We were gratified to hear some very positive feedback on the workshops and CHM overall during the closing session. There seems to be a lot of potential in CHM helping both U.S. Territories and ASTHO deal with the immediate and long-term health issues related to climate.
A Busy Summer with a QGIS Conference in Denmark and FOSS4G in Boston
This summer Kurt Menke first attended the 3rd Annual QGIS User Conference, Hackfest and Developer meeting in Denmark. From there he traveled to Boston to attend the Free and Open Source for Geospatial (FOSS4G) International Conference. 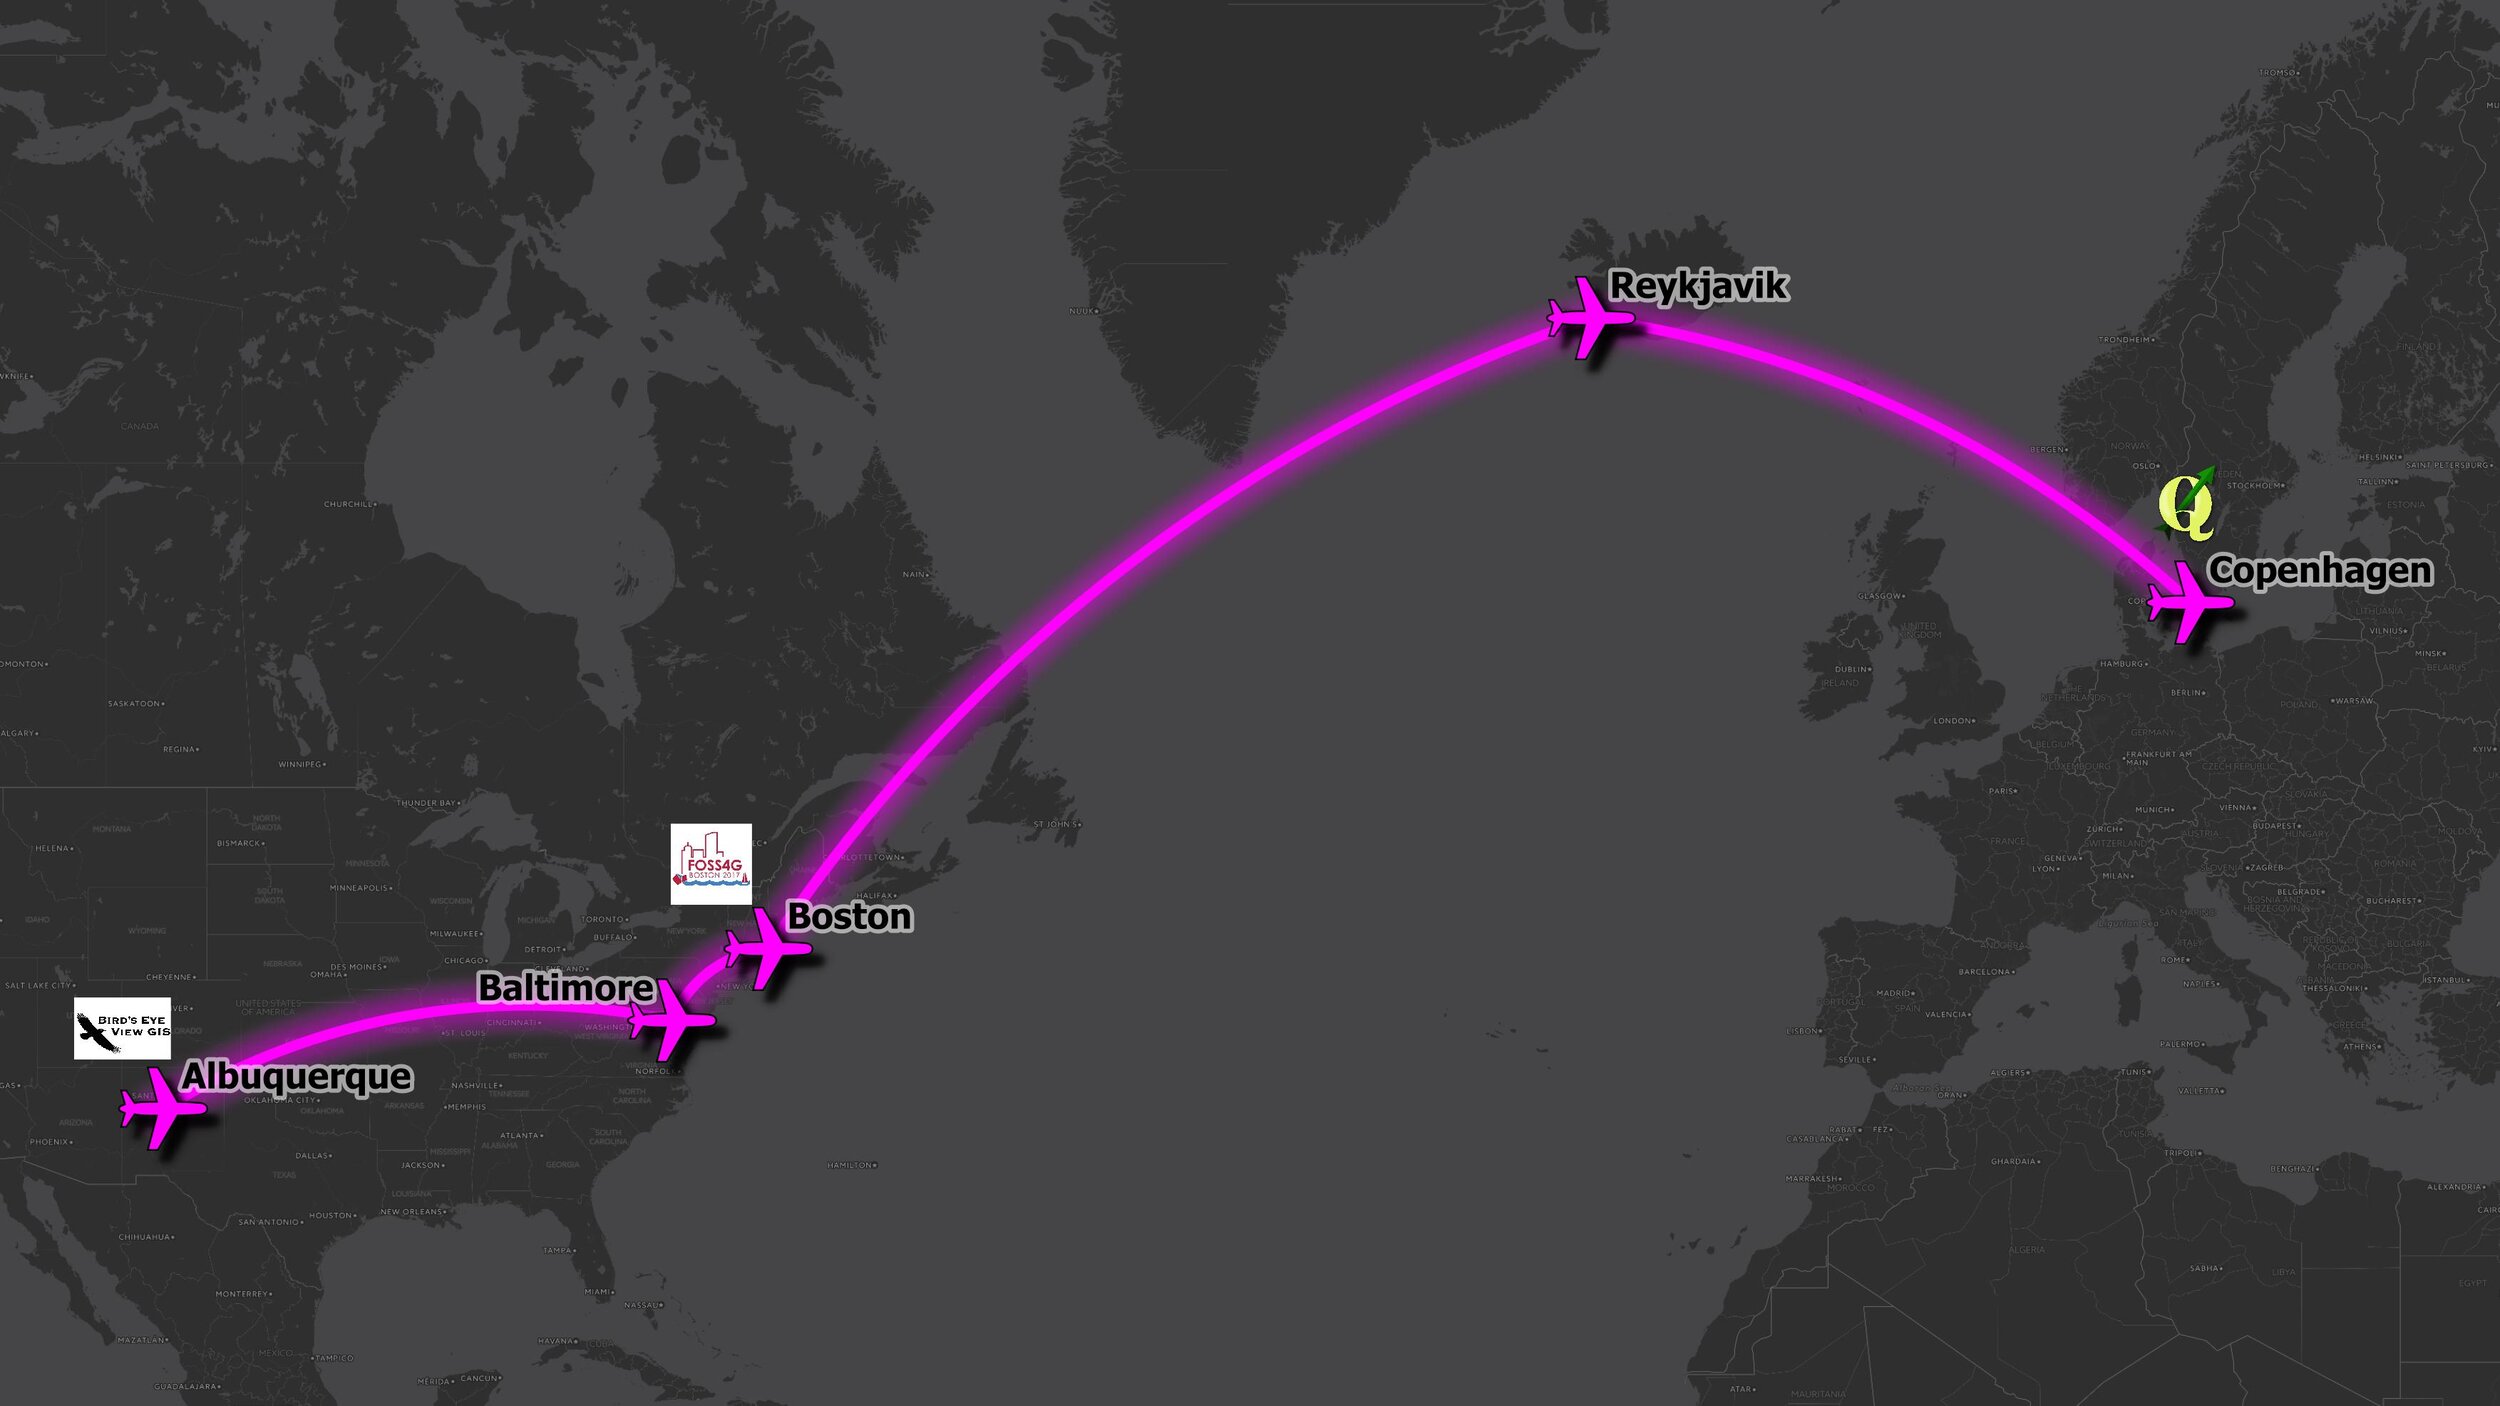 The QGIS conference was small and intimate and a lot of new information was shared by the developers about the future of QGIS.
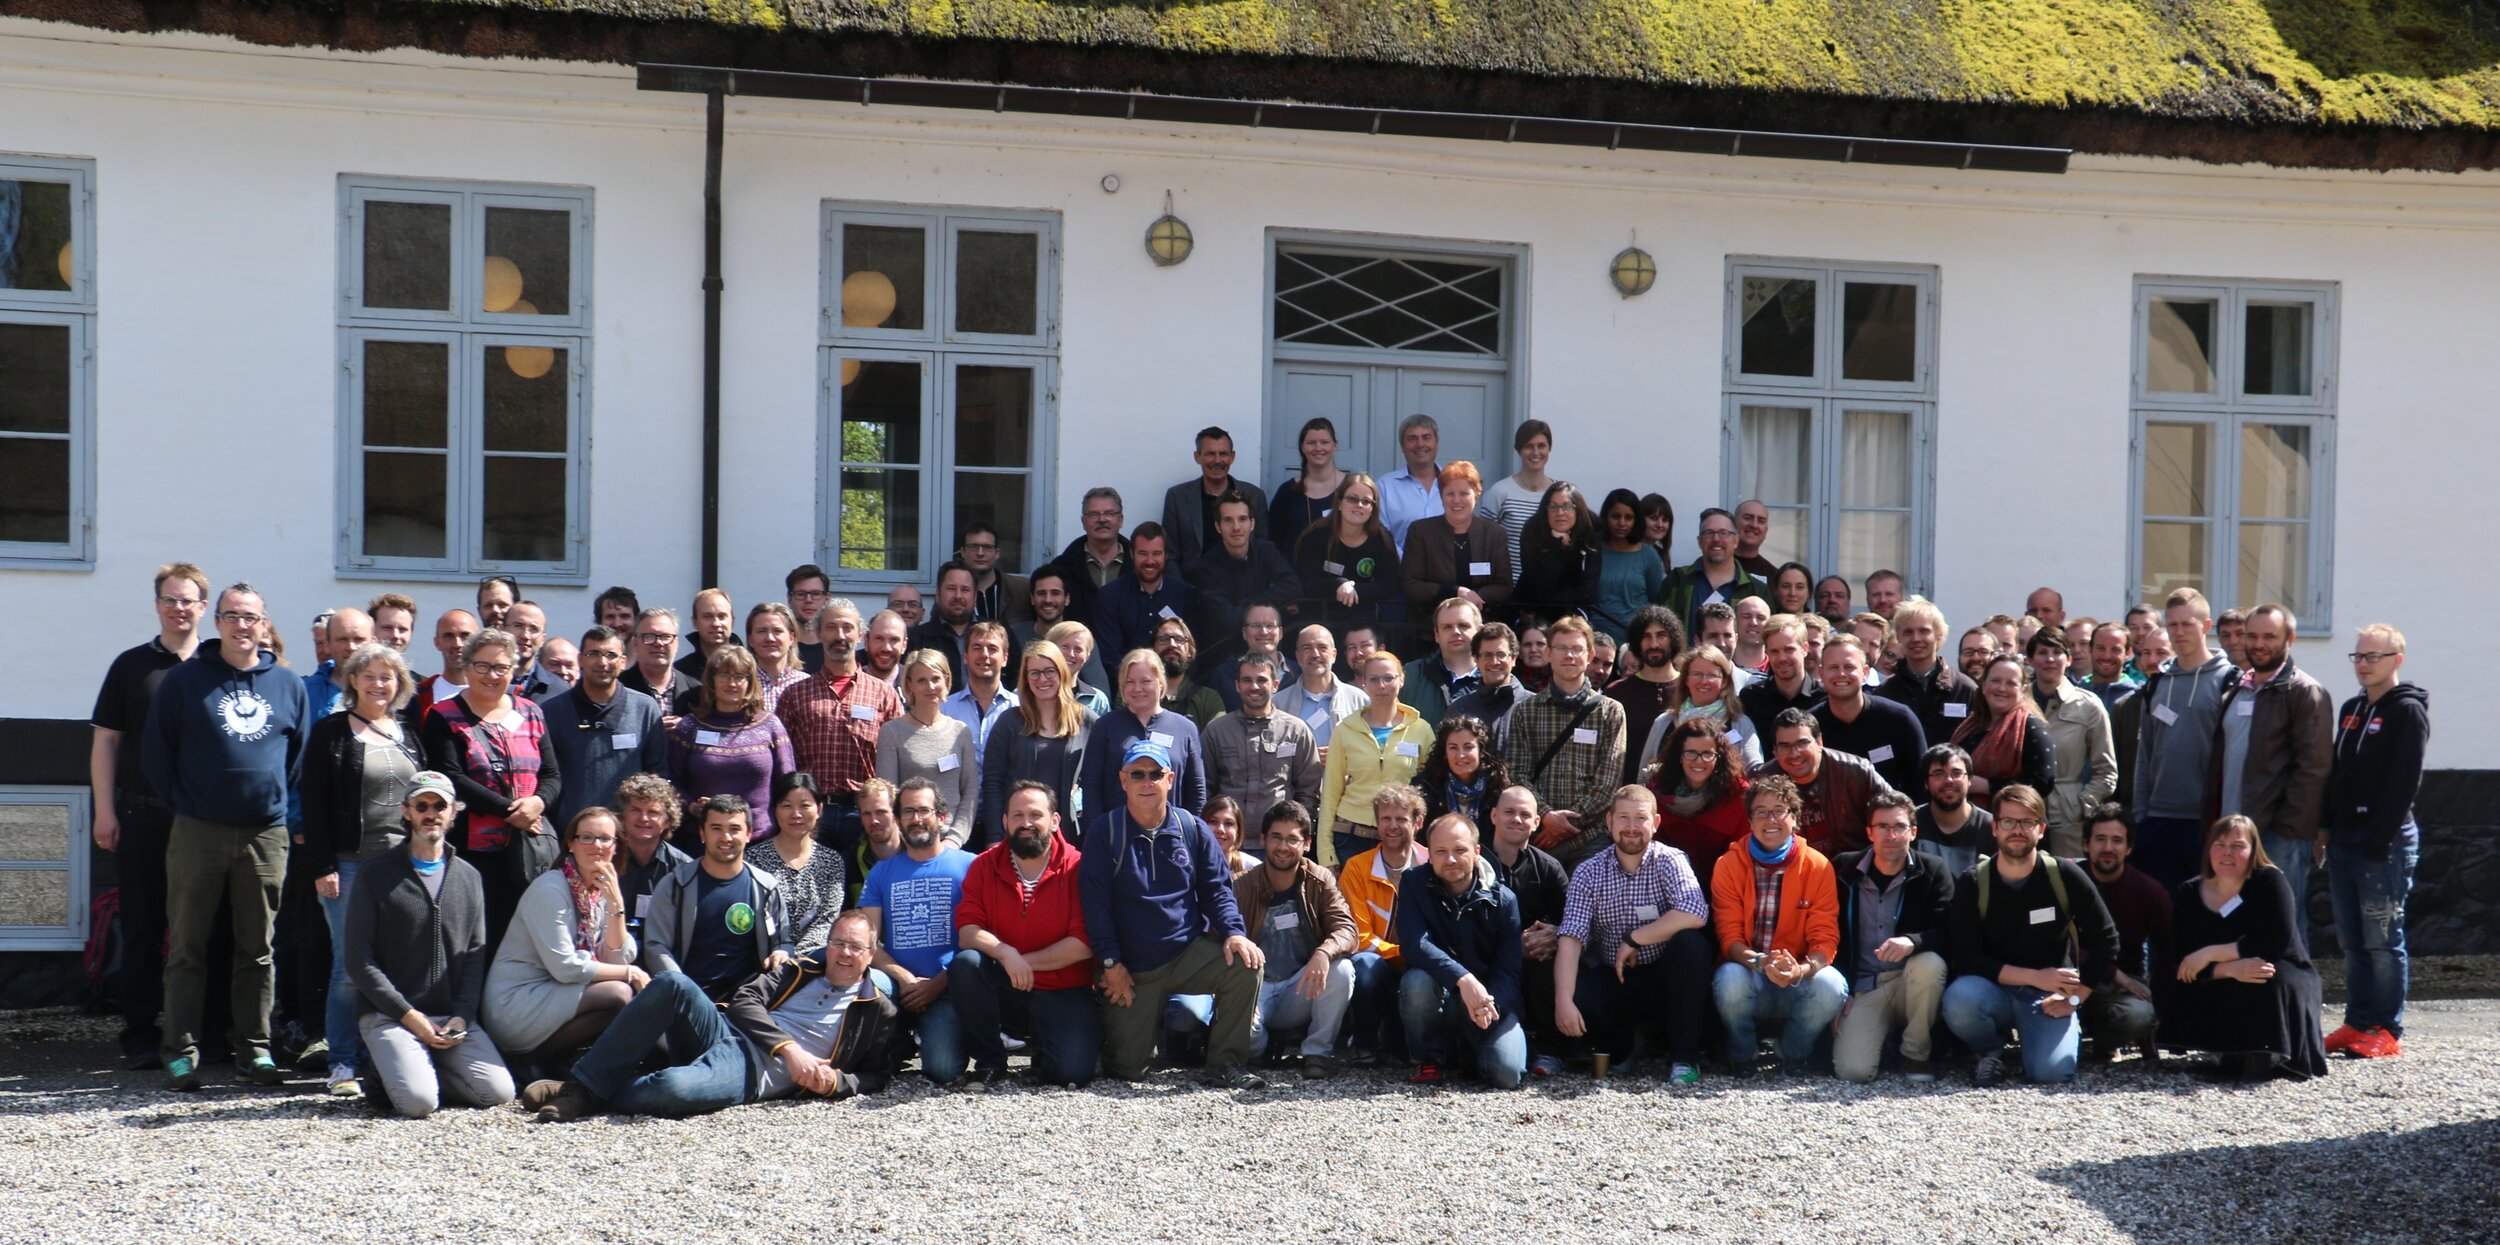 There was so much presented that this will be a separate future blog post. While there Kurt conducted a full day workshop on Data Visualization and Cartography in QGIS.
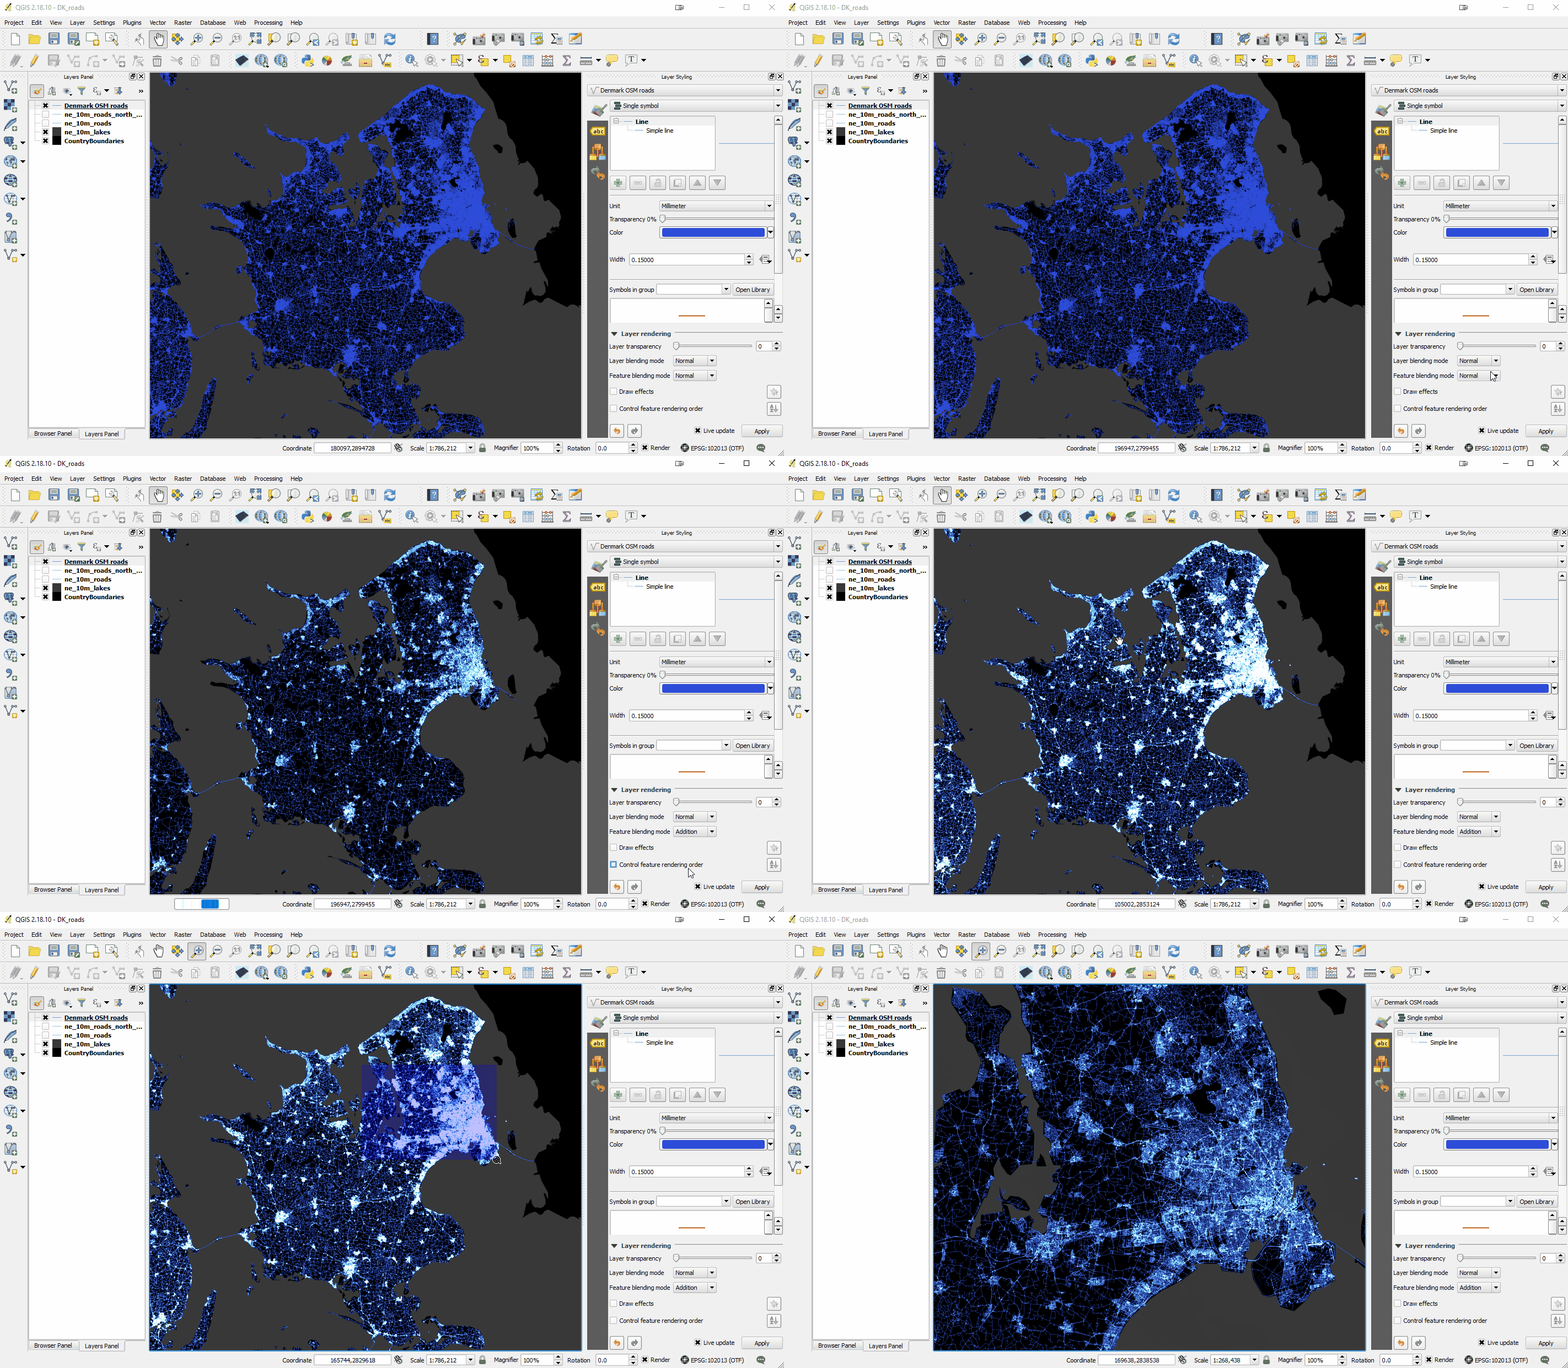
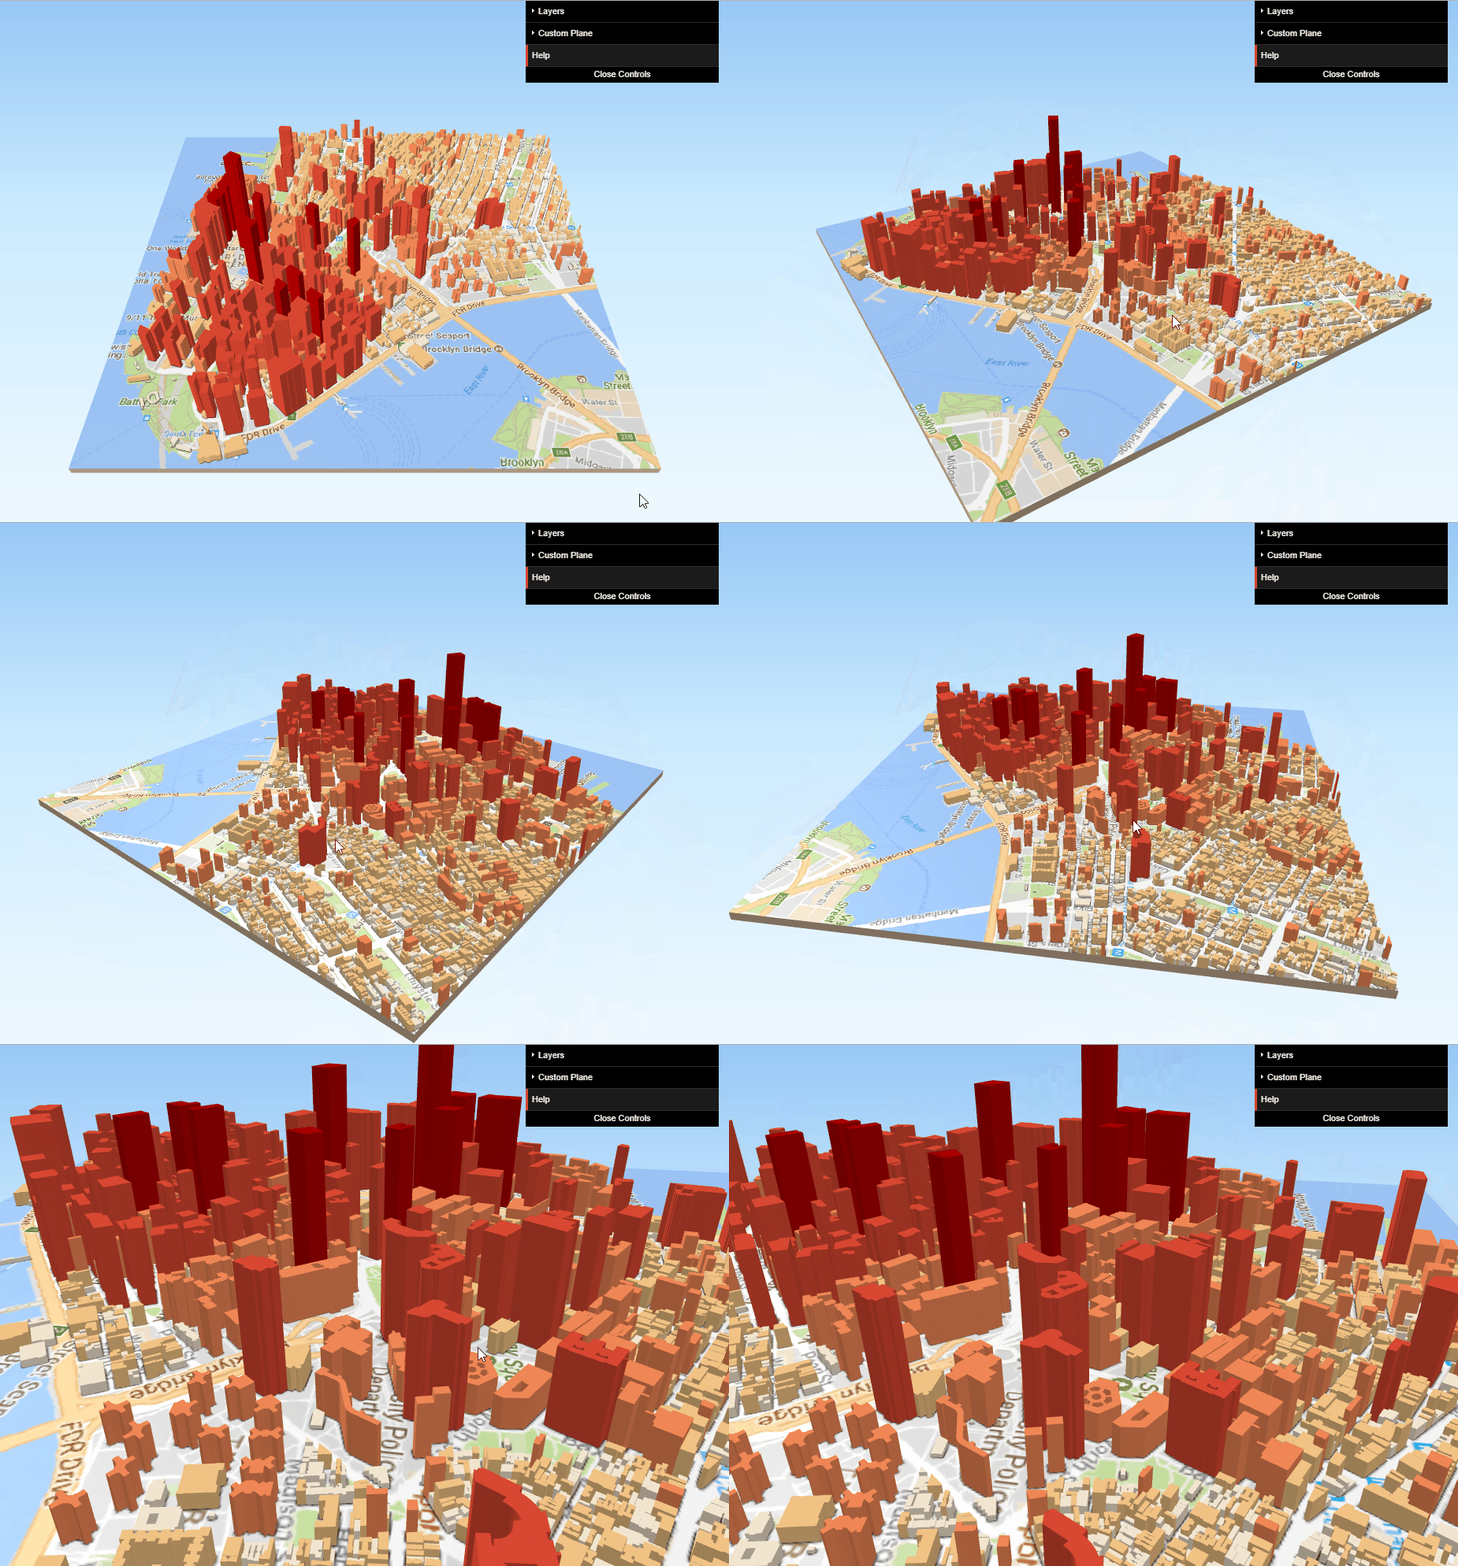
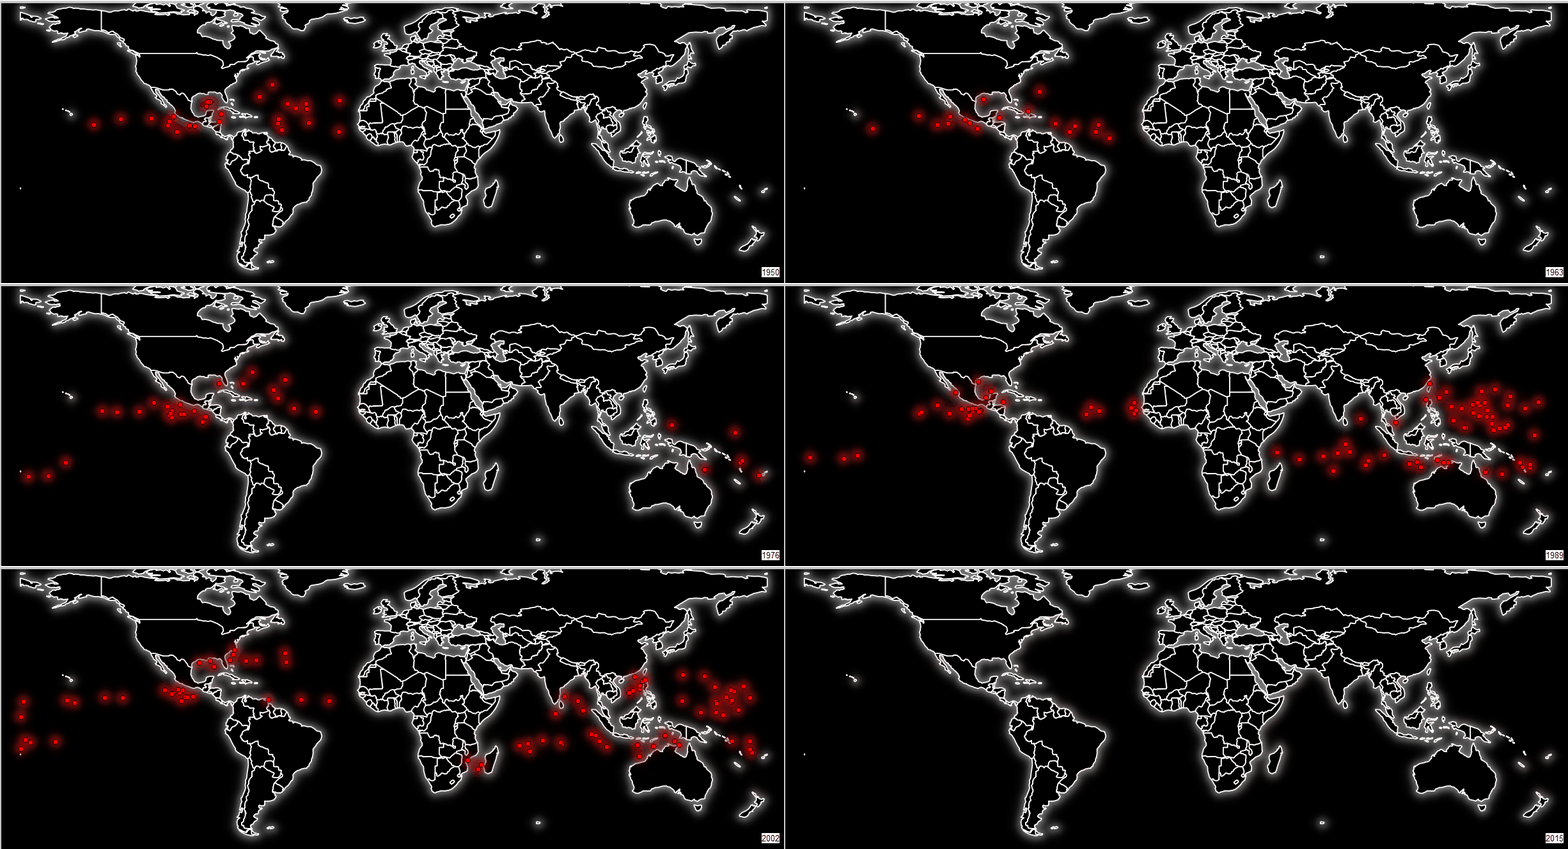
 He shared many of the new sophisticated and powerful data styling tools now found in QGIS including: 2.5D, 3D, Live Layer Effects, Inverted Polygon Shapeburst Fills, Blending Modes, and some plugins such as Time Manager. Perhaps this could be a workshop shared with CHM partners at a future date? Some examples are shown below:
 In Boston Kurt presented the Community Health Maps project. The talk was well attended and there was a lot of interest. Fulcrum was a sponsor of the conference, and Kurt was able to meet with several of the Fulcrum representatives. While there he learned about Fulcrum Community. This is a new initiative designed to help humanitarian agencies, non-profits, NGOs, or Government entities. To begin you need to request a Fulcrum Community account. One important caveat is that data collected via a Fulcrum Community account is anonymized, free, and open to all by default. It is essentially an initiative that will help in larger crowd sourcing efforts. More details will be forthcoming as Kurt explores this and how it may apply to Community Health Mappers.This month (September), Community Health Maps will be travelling to the University of Connecticut (Community Medicine and Health Care) and to Miami to teach workshops. The workshop at the University of Connecticut will be to a large diverse audience. The Miami workshops will be focused on showing community members how to map damage and issues related to King Tides.Stay tuned for blog posts on: 1) the future of QGIS, 2) Fulcrum Community, 3) experiences in Connecticut and 4) Miami.
Community Health Maps Presenting at FOSS4G
This years international conference on Free and Open Source Software for Geospatial (FOSS4G) is in Boston from August 14-19th. Community Health Maps (CHM) will be presenting a talk covering the CHM program along with some case studies. Come and join us! It is a fantastic venue for people of all skill levels. There are usually around 1,000 in attendance. There are keynote speakers, paper sessions, and workshops. Many are suited for beginners while some are targeted at "power" users. Not only can catch up with the latest CHM news, you can also learn a lot about Fulcrum, QGIS, Carto and other useful mapping tools, and what people are doing with them. In fact there is a co-located event hosted by Fulcrum called Fulcrum Live. This is an all day event (Tuesday August 15th) and is free for conference attendees. It will be a great learning opportunity.We hope to see you there. If you have any news on your mapping projects, please share it with Kurt or John. Perhaps we can include some slides highlighting your work at the conference!
Remembering a Community Health Maps Milestone
By John Scott (CPSC)In June 2016, a Community Health Maps (CHM) symposium was convened by the Center for Public Service Communications and Health-Equity.Org. It was hosted by the National Library of Medicine and held at Lister Hall on the grounds of the National Institutes of Health campus in Bethesda, Maryland.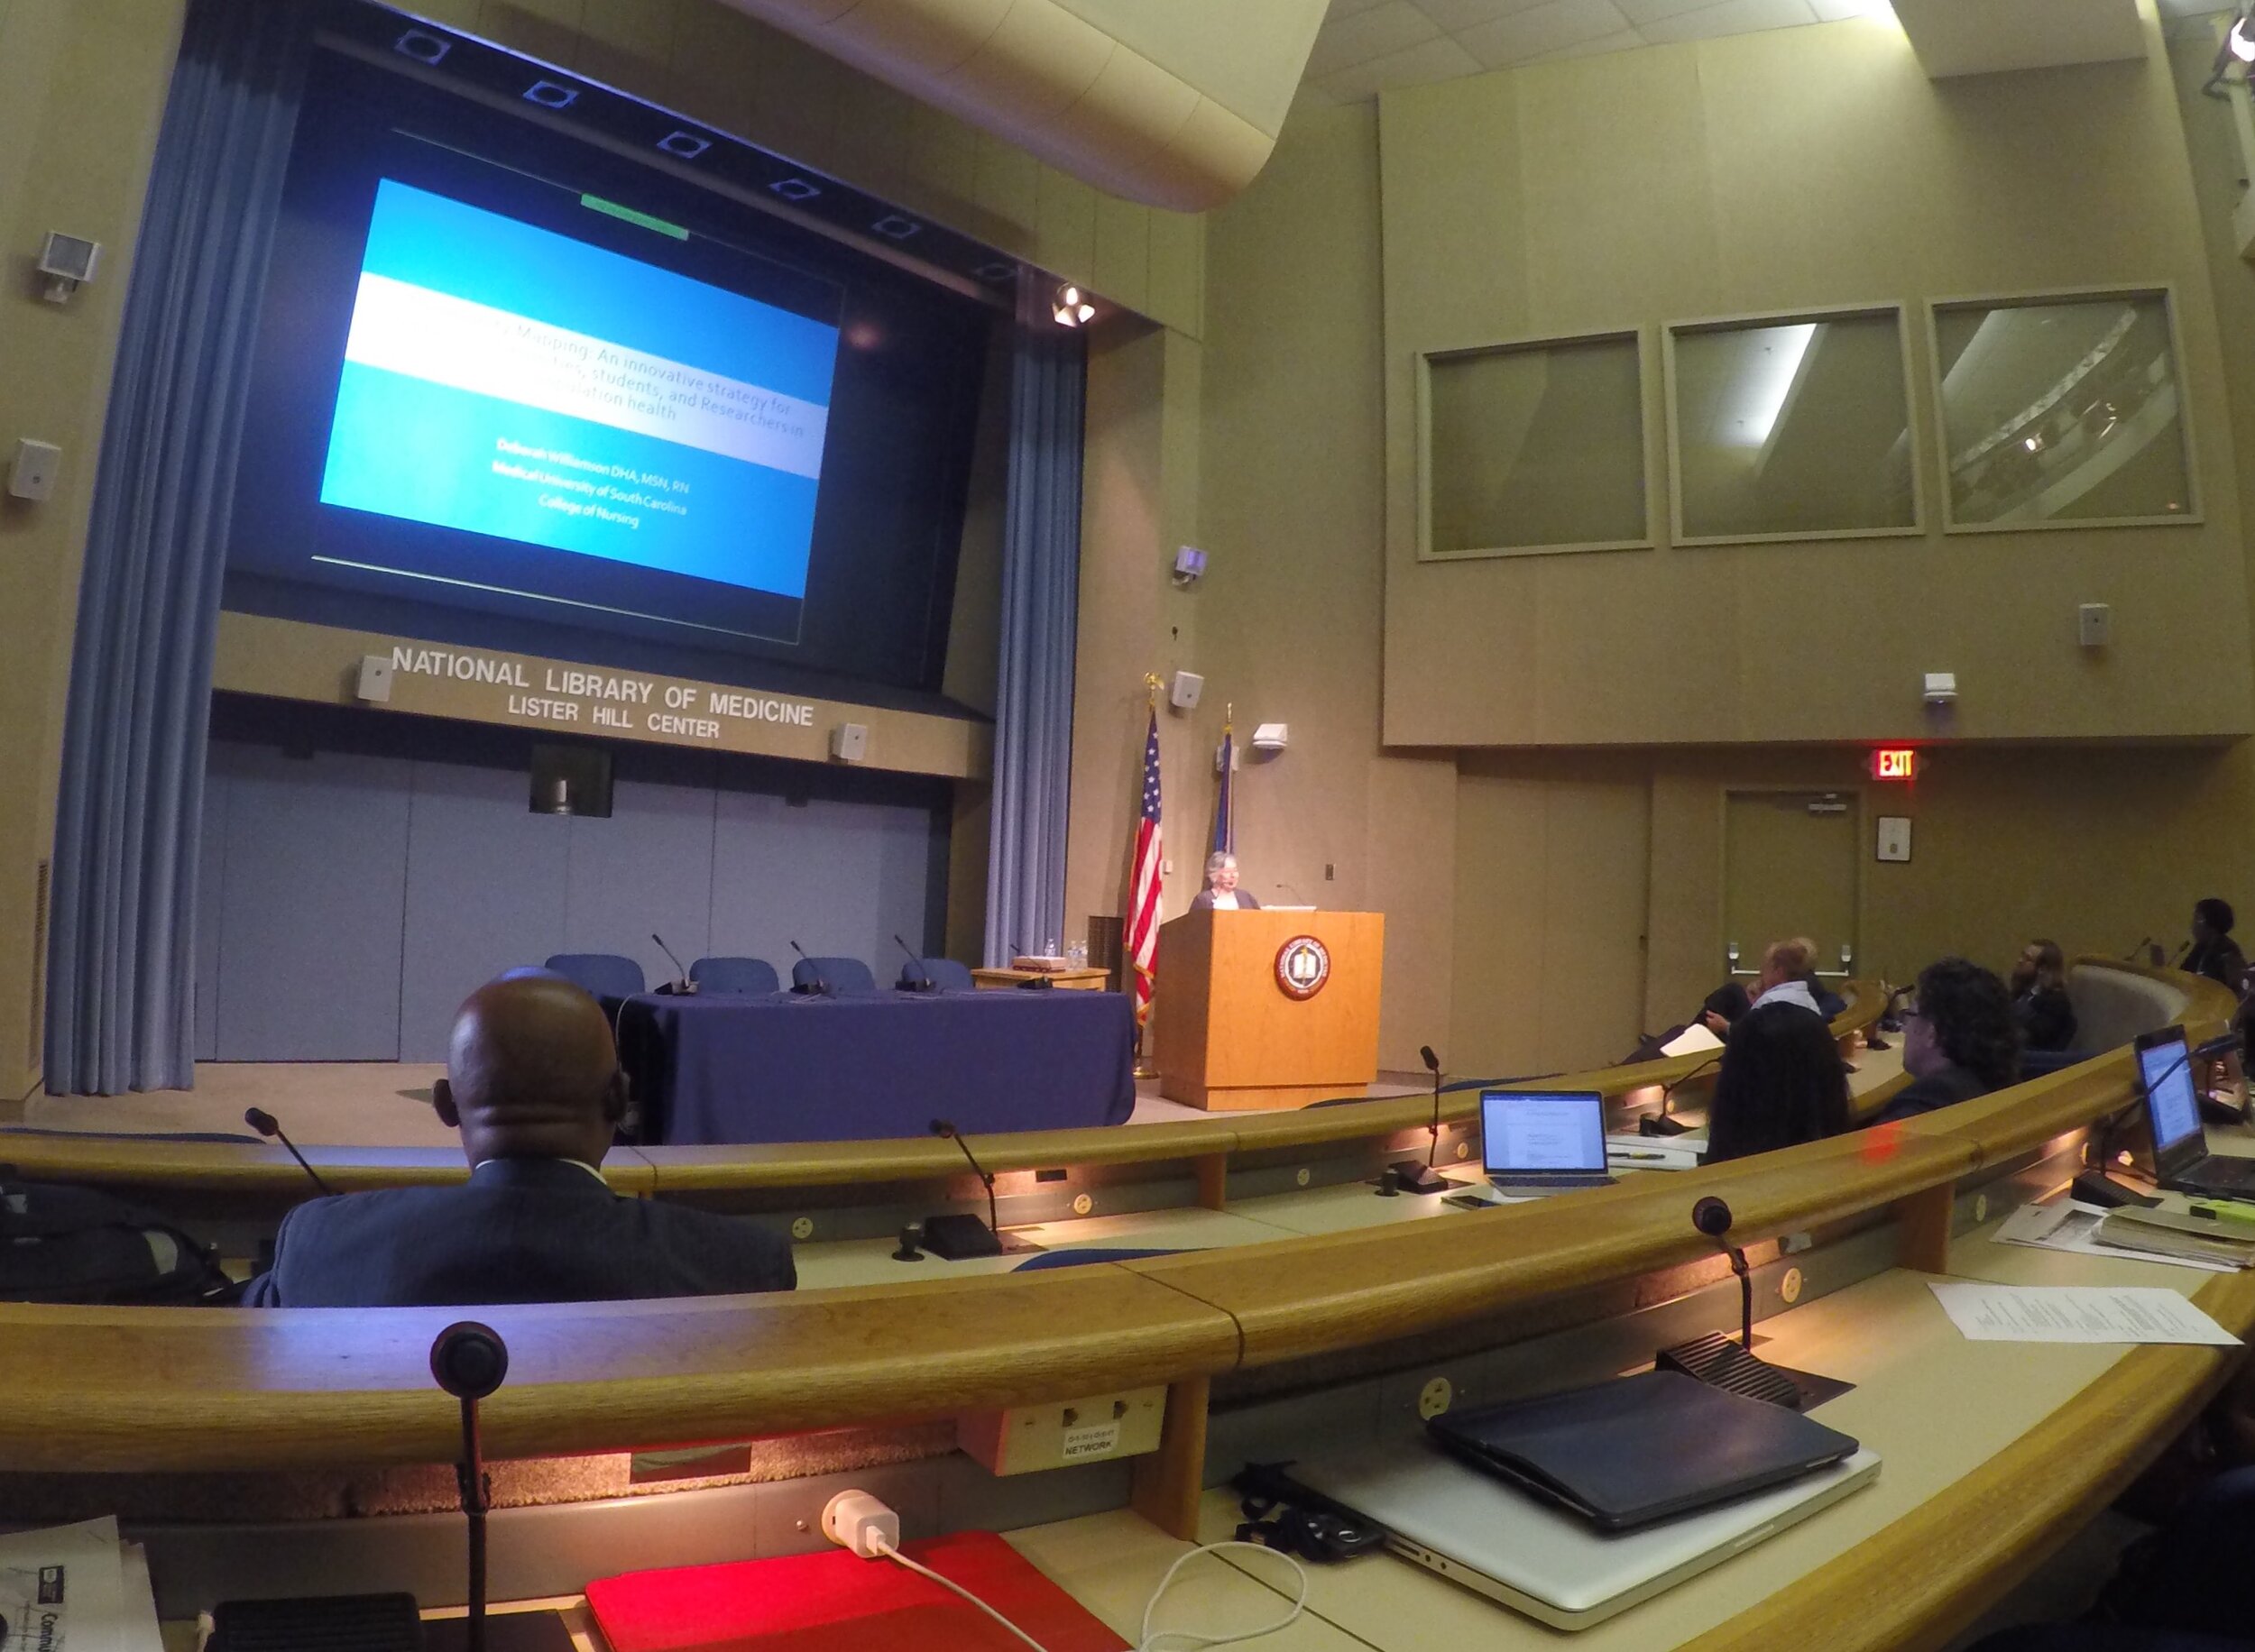 The relevance of the CHM initiative to NLM’s mission has to do with improving the ability of community-oriented organizations (and researchers and other public health professionals) to collect, organize and visualize data and other health information to better-understand health conditions and support decision-making for resource allocation. While access to quality health information is frequently a focus of attention, the ability to visualize data and information -- to better understand and portray their significance to the community -- has received less attention. This is in part because the availability of affordable GIS platforms and data collection and visualization applications is relatively recent. Historically, the cost to procure platforms and applications, to train users and to sustain operations has been prohibitive for communities and community-based organizations whose health budgets are already strained.The purpose of the workshop, therefore was to share the CHM workflow with community-based and minority health organizations so that they would be in a better position to serve their populations by knowing how to collect and maintain their own data, rather than -- or at least in addition to -- having to rely solely on national/state agencies or majority-institution partners to provide data to them.Participating were seventy-six community-oriented health professionals who were drawn from throughout the country. The workshop was made possible with funding by the Robert Wood Johnson Foundation. During the workshop several Community Health Mapping pilot projects were highlighted, including:
- Obesity research at the University of Hawai’i School of Medicine’s Department of Native Hawaiian Health
- Research on noise pollution at the Seattle Indian Health Board/Urban Indian Health Institute
- Projects including a youth initiative measuring community water quality
- Smoking cessation
- Access to health care by migrant workers
- Building a zika awareness curriculum at the Medical University of South Carolina
- University of Washington School of Public Health graduate student capstone projects featuring the CHM workflow.
- Mapping Curb Ramp Accessibility around a Silver Spring, MD Assisted Living Facility
- Visualizing an Intervention for Tobacco Control
- Teens Map Environmental Health of Their Community (Sea Islands, South Carolina)
Kurt Menke, of Bird’s Eye View GIS, and CHM partner, also offered training in the use of CHM tools in five parts:
- Introduction to Community Health Maps
- Learn to use Fulcrum to build a data collection form
- Exercise using data collection form to collect data around the conference center
- Mapping data collected during previous exercise online in Carto
- Brief introduction to mapping the data in QGIS
Learning Objectives for the training session were:
- Describe the Community Health Maps workflow which includes low-cost and open resources for community mapping and data visualization.
- Create a data collection tool on a mobile device that can be used to collect community data.
- Learn how to map data collected online in and on the desktop.
Workshop participants were also introduced to the recently developed set of six online “labs”:
- Field Data Collection
- Bringing Field Data into QGIS
- Combining Field Data with other Organizational Data
- Basic Spatial Analysis
- Cartography with QGIS
- Data Visualization with Carto
These labs are now available on the Community Health Maps Resources page. Other highlights of the workshop include a keynote presentation by Dr. John P Wilson, Professor and Director of the Spatial Sciences Institute at USC Dana and David Dornsife College of Letters, Arts and Sciences, University of Southern California. His talk was titled, "Community Health Mapping: In a World Awash with Geographic Data and Tools." His presentation can be downloaded here as a PDF (3.86Mb).
 Also presenting was John Balbus, M.D., M.P.H., Senior Advisor for Public Health and Director of the National Institute for Environmental Health Science-WHO Collaborating Centre for Environmental Health Sciences at the National Institutes of Health. His presentation was "From the Pump Handle to Hazardous Waste: Mapping Environmental Health and Justice." It can be downloaded here as a PDF (3.48Mb)
Catch Community Health Maps at the Association for Prevention and Teaching Research Conference (APTR) in Savannah next week!
Last year Community Health Maps was invited to present at the Association for Prevention and Teaching Research (APTR) Conference in Albuquerque, NM. We brought two students from the University of Washington Department of Community Oriented Public Health, and two students from the Medical University of South Carolina, to present their capstone project posters.[gallery ids="290,292" type="rectangular"]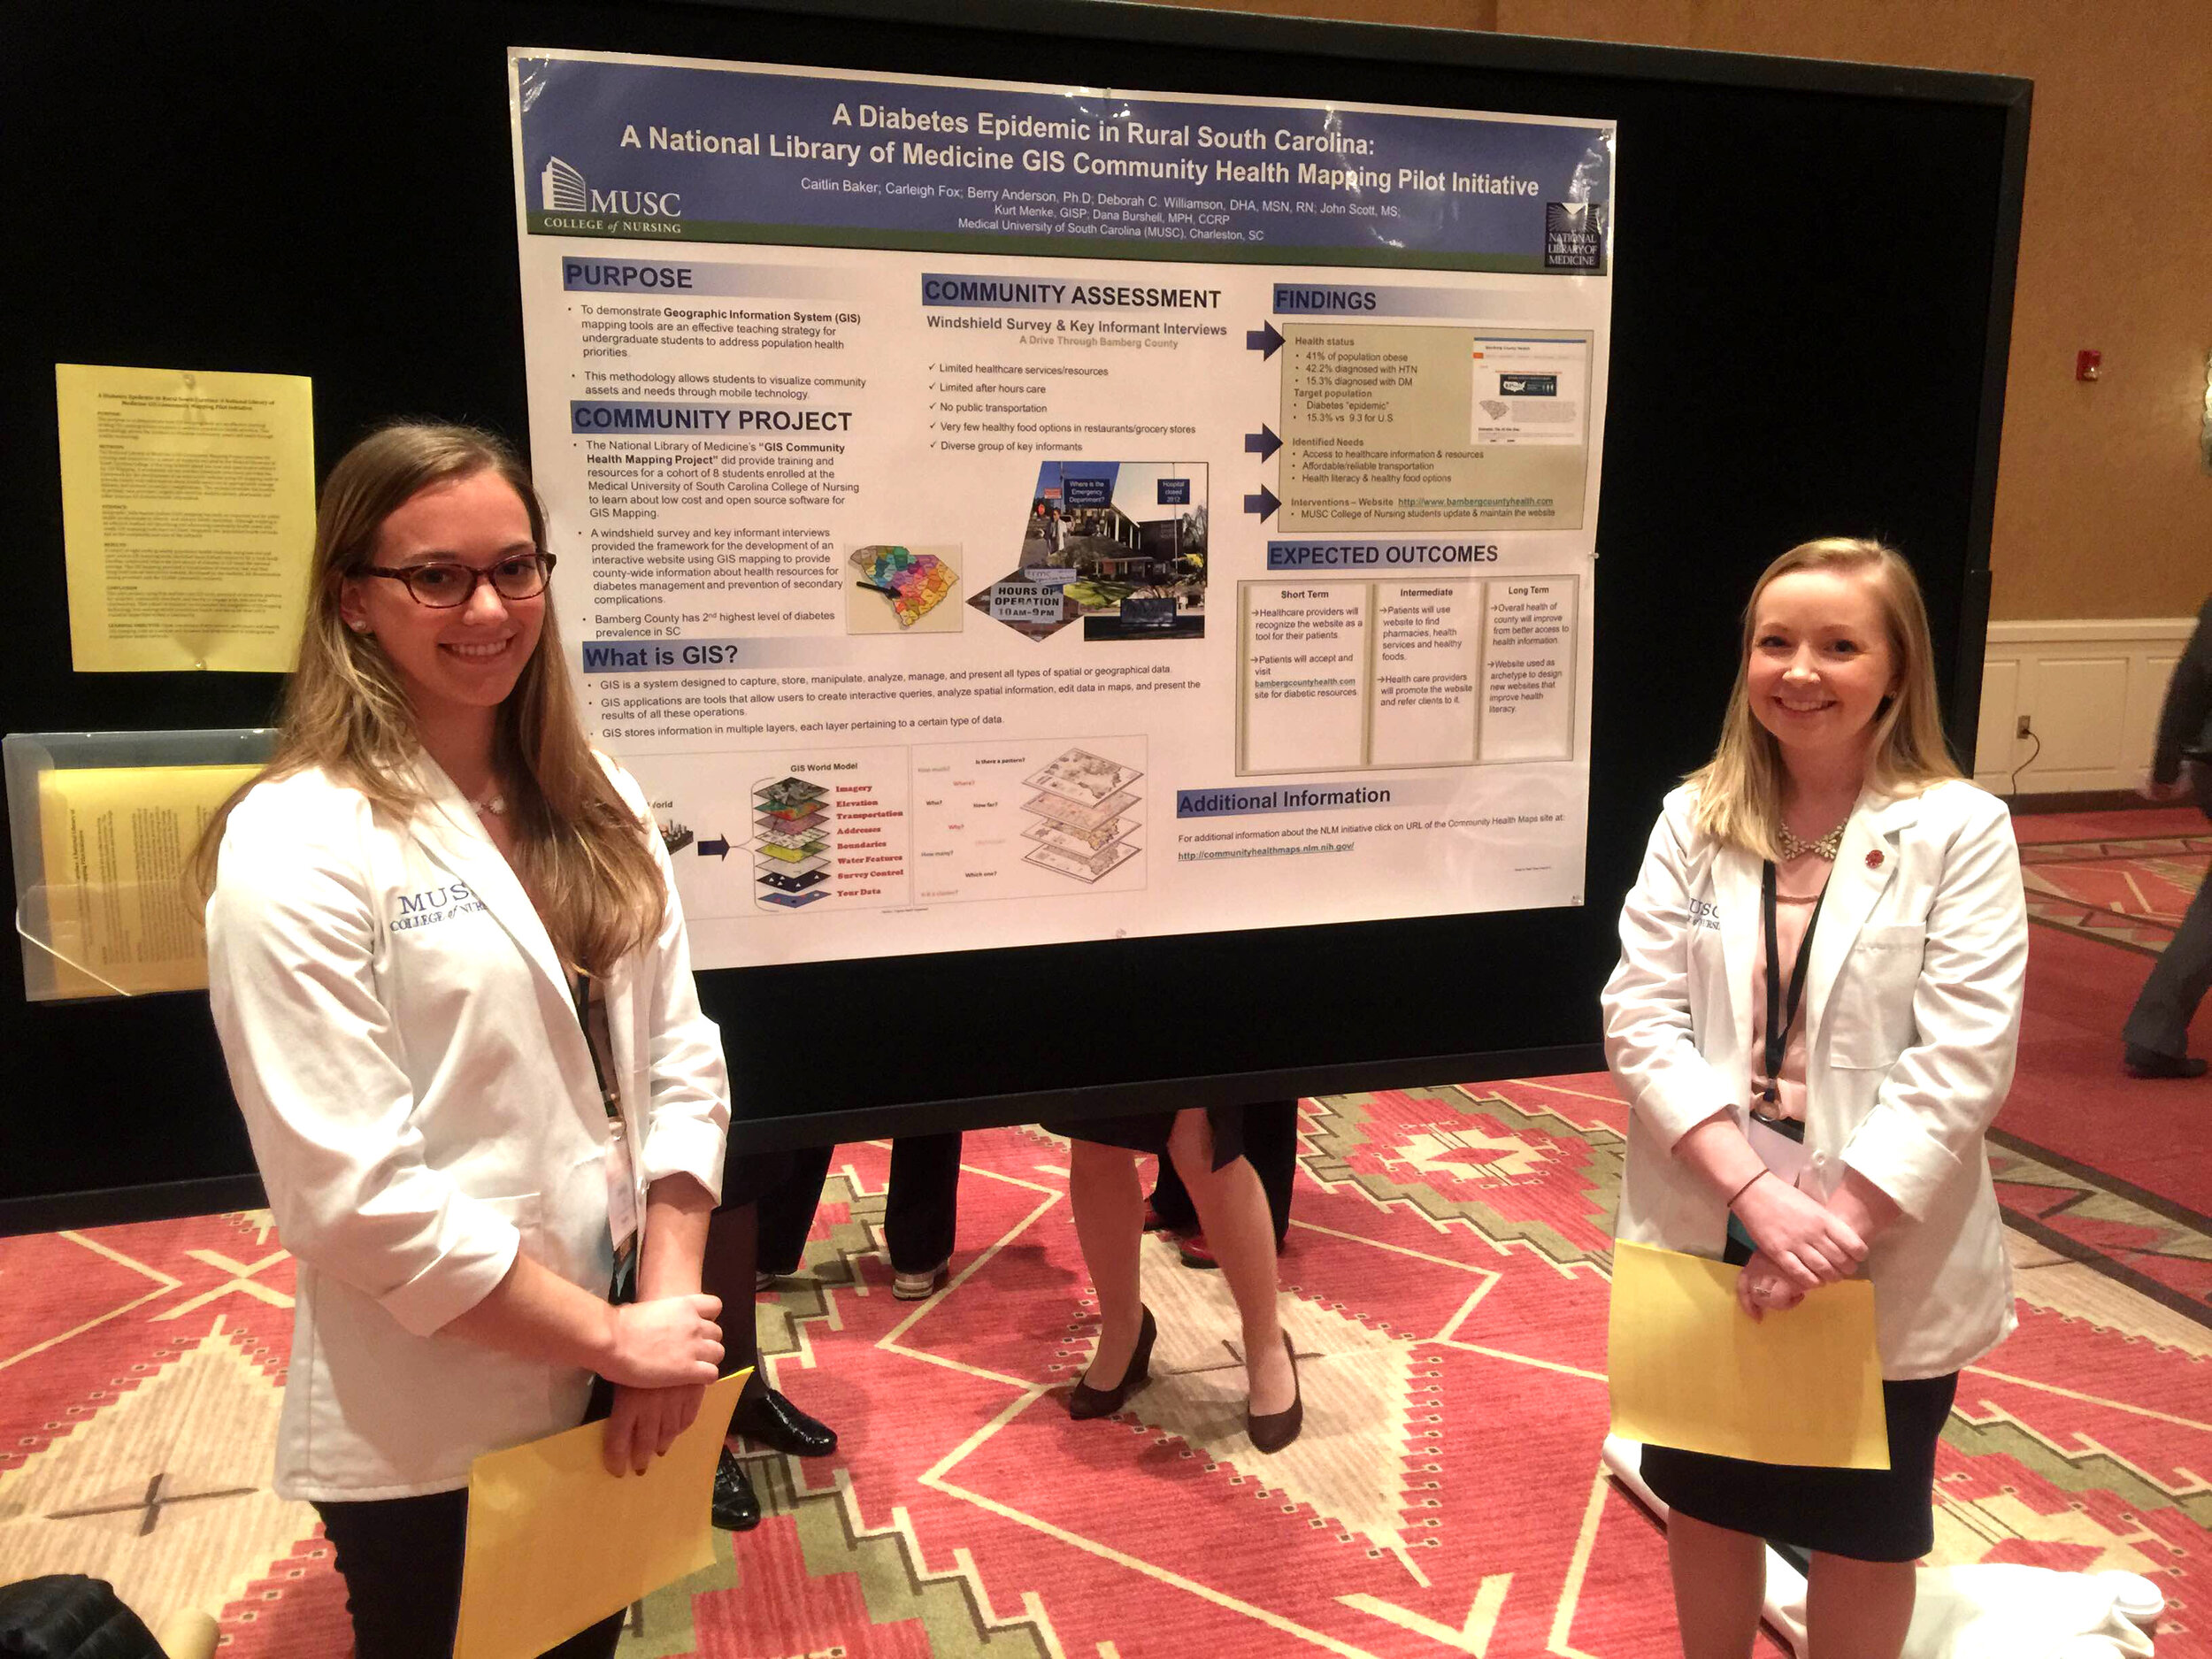 Myself, John Scott, Dr. Williamson and Dana Burshell also combined to create a CHM panel. The panel discussion session was packed and to our collective surprise we heard "oohs" and "ahhs" as we showed some of the mapping tools live. We were approached by some of the organizers about teaching a workshop the following year.
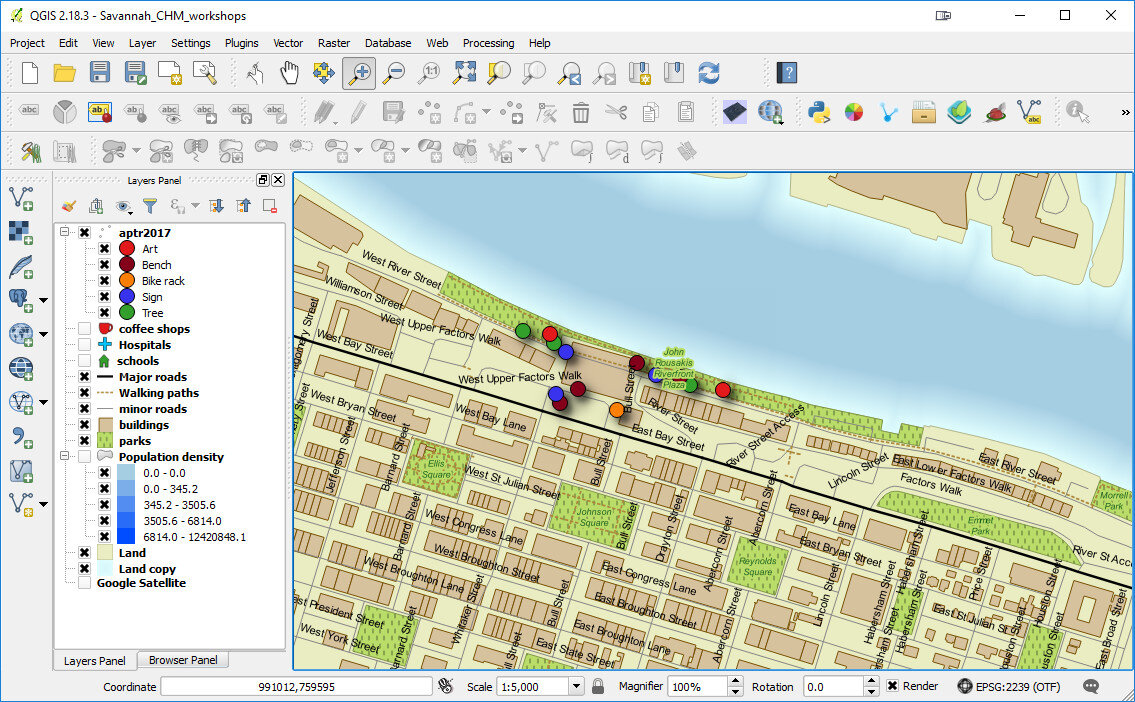
 That brings us to this years conference in Savannah Georgia. We will again have a panel session which will both provide an overview of the project, and highlight recent successes. The panel will be on Thursday April 6th at 3pm.On Friday morning we will teach a 4 hour CHM workshop. This is a hands-on training session where you will learn how to incorporate the Community Health Mapping (CHM) workflow into your research and training programs. You will:
- Learn how to use Fulcrum to create a data collection form
- Go outside with your smartphone/tablet to collect some data around the conference center
- Map the collected data in Carto
- Work with the data in QGIS
 We hope to see you there!
