FOSS4G

Creating a COVID-19 Temporal Animation with QGIS

One of the most powerful new features released with QGIS v3.14 is the Temporal Controller, which allows you to enable time in your maps. It can be used to temporally enable vector, raster, mesh and WMS(T) data. The Temporal Controller is now a core part of QGIS and has several variables associated with it that allow you to create powerful visualizations and animations. It contains most of the functionality found in the Time Manager plugin.

Here you will learn how to use it with the New York Times COVID-19 data to produce a county-based animation of the outbreak in the U.S.

Getting the Data

To begin, download the current New York Times live COVID-19 data, a U.S. Counties with population shapefile and a State boundaries layer from the U.S. Census. Unzip the county and state data.

Add the Data to QGIS & do some basic styling

Add all three datasets to QGIS 3.14, then use either the QuickMapServices or MapTiler plugin to add an OpenStreetMap basemap. If you have not installed these, you can do so from the Plugins menu option Manage and Install Plugins.

Next you will symbolize the States with a simple black outline and no fill. Press F7 to open the Layer Styling Panel. Make sure the states layer is the target layer in the panel.

  • Select the Simple fill component.

  • Change the Fill style to No brush.

  • Increase the Stroke width to 0.46.

The NYT data is structured such that there is an entry for each county for each day of the pandemic. For each date it has both the cumulative number of confirmed COVID-19 cases and deaths.

2020-08-10_162130.jpg

Processing the Data

The only data processing step is joining the COVID-19 data to the counties layer by FIPS code. This is a 5 digit code (2 for the state and 3 for the county) which is a unique identifier for each county in the country.

You will use the Join Attributes by Field Value processing algorithm. Use the Processing menu to open the Processing Toolbox. Use search box at the top of the Toolbox to search for ‘Join’. This will filter the available tools. Locate the Join Attributes by Field Value processing algorithm in the Vector general section. Fill it out as shown below being careful to select the Join type of Create separate feature for each matching feature (one-to-many).

Warning: This is going to create a very large dataset with over 400,000 features. It may take quite awhile to process depending on the speed of you machine.

2020-08-10_163329.jpg

Symbolizing the COVID-19 Data

When the data has been processed you can symbolize it. Again the size of this dataset makes it a bit unwieldy. Since the goal is an animation which builds towards the current total of COVID-19 cases, you want to set up the classes so they make sense for the latest date in the dataset. To figure this out, you will temporarily filter the data for the most current date.

  • Open Layer Properties for the layer.

  • Choose the Source tab.

  • In the Provider Feature Filter section click on the Query Builder button.

  • In the Fields box highlight the date field.

  • In the Values box click All. Again this is a big dataset so it may take a few moments for QGIS to compute a list of all the dates.

  • Form an expression in the Provider Specific Filter Expression box. First double-click on the date field to enter that in the lower box. Then click on the equals operator. Finally double-click on the most current date.

  • Click OK.

2020-08-10_164257.jpg

When finished, a small filter icon will appear to the right of the layer in the Layers Panel. If you hover over that filter your expression will appear. Now you will work on styling the filtered dataset.

  • Make sure the correct counties layer is the target layer in the Layer Styling Panel.

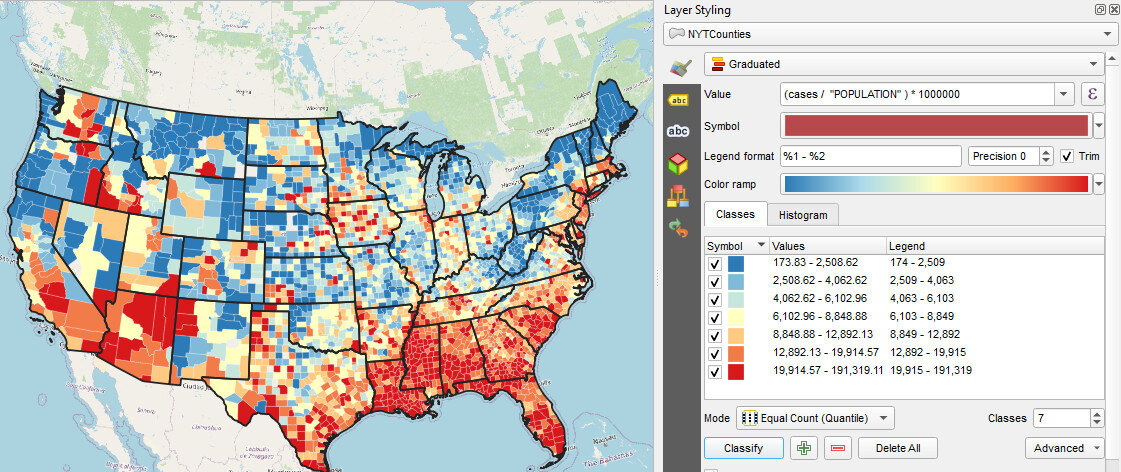
  • Where it reads Single symbol, change it to Graduated. The Graduated renderer allows you to symbolize the counties based on a numeric field.

  • You can begin by simply choosing the cases field as the Value.

  • Click the Classify button and you will see the counties classified into the default 5 classes in your default color ramp.

  • Choose Equal Counts as the Mode.

  • Increase the number of Classes to 7.

  • Use the Color ramp selector to find a nice color ramp. Here I’m using the RdYlBu ramp.

  • Right-click on it and choose Invert. This is necessary if using the RdYlBu ramp so that the counties with the highest number of cases are red.

  • Next you will change all the outlines for all the classes to a thin white line. To do this, click on the colored bar next to Symbol.

    • Select Simple fill.

    • Change the Stroke color to white and the Stroke width to 0.06.

    • Click the blue back arrow button to return to the main layer styling options.

2020-08-10_171438.jpg

Normalizing the data by population

This is now turning into a nice map. However, it will be more informative to normalize the number of cases against the population. Otherwise we risk making a map of just population centers. In the Value section where you chose cases as the field, click the Expression button. The Expression Dialog window opens with cases as the expression. Here you will divide cases by population and multiply by 1,000,000. This will give you the cases as a rate per 1,000,000 people.

2020-08-10_172204.jpg
  • Put your cursor to the right of the word cases and click the / division symbol button.

  • Expand the Field and Values values section. You will see a list of all the attribute columns in the dataset.

  • Double-click on POPULATION to add field to your expression.

  • Next, wrap cases / “POPULATION” in parentheses.

  • Finally, enter a multiplication * symbol followed by the number 1000000 without thousands separators.

  • Click OK.

  • In the Layer Styling Panel click Classify again to see your map as cases per 1,000,000. You can also enter custom values. For example, you can set the upper limit for the first class to an even 2,500 versus the 2,508.62.

2020-08-10_172443.jpg

Now that you have the styling set, you will clear your layer filter. Click on the filter icon in the Layers Panel to open the Query Builder. Click Clear and OK.

Working with the Temporal Controller

Now you can work with the Temporal Controller.

  • Open Layer Properties for the counties layer and choose the Temporal tab.

  • Set the Configuration to Single Field with Date/Time and point it to the date column.

  • Set the Event duration to 1 week.

  • Close Layer Properties.

2020-08-11_081417.jpg

The layer will likely take awhile to render so you may want to turn it off now that you have it set up.

Decorations

Next you will work on some Decorations to add to the animation. These will allow you to add a title, legend and data source to the map canvas.

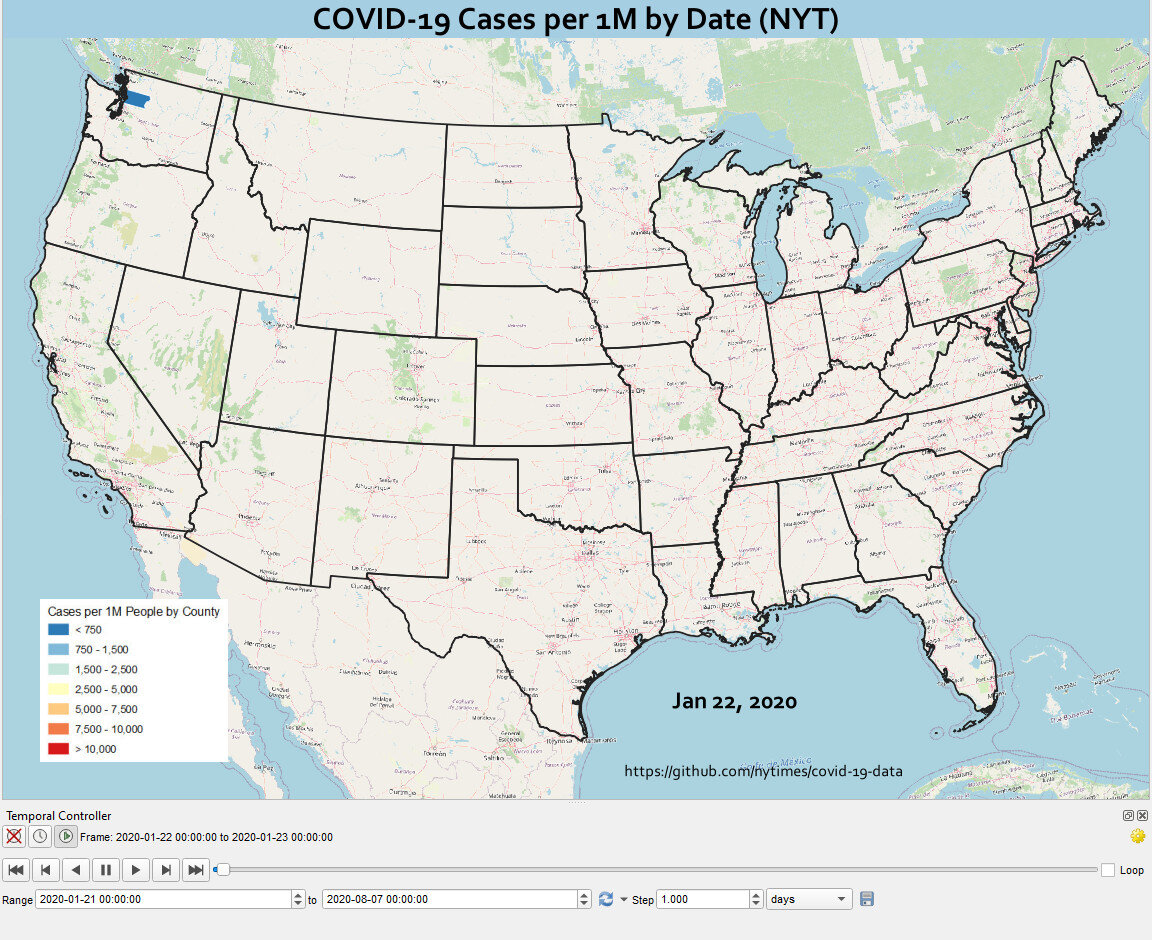
From the View menu find Decorations and choose Title Label. Click Enable Title Label and enter COVID-19 Cases per 1M by Date (NYT). Choose a font and a background color and click OK.

To add the legend to the map canvas, you will set one up in the Print Composer. Start a new Print Composition and add just a Legend. Configure it how you’d like and take a screenshot or reduce the size of the composition to fit to the legend and export it as an image.

Back at the main QGIS window revisit View —> Decorations and choose Image. Click Enable Image and load your legend. Use the Size and Horizontal/Vertical settings to place it in a good spot.

You can use the View —> Decorations—> Copyright Label to put the url to the New York Times GitHub repository on the map.

2020-08-11_082832.jpg

Labeling Time

Finally you will create a point layer to place the current day on the map. Click on the Layer menu and choose Create Layer —> New Geopackage Layer. Be sure to make it a point layer.

2020-08-11_083127.jpg

Put the layer into edit mode and create a point where you’d like the date to appear. Save your edits. Open Layer Properties and select the Temporal tab. Enable Temporal and set the Configuration to Redraw Layer Only. This tells QGIS to redraw this layer each frame.

Now you will symbolize and label this layer. For symbology change the renderer from Single symbol to No symbols. You don’t need to see the point. You will be using this layer to simply label time.

In the Layer Styling Panel switch to the Labels tab. Set labels to Single Labels. Click the Expression button to the right of Value. There are a series of variables tied to the Temporal Controller. Expand the Variables section and double-click on the @map_start_time variable to add it to your expression. This variable represents the start of the map’s time range. As you step through time on the map, this variable will update to represent the current start date for the map. You can use the format_date() function to put this time into your preferred format. If you highlight the format_date() function you will see some help in the right side of the expression window. Reference the example below. Also note that QGIS provides a preview of what your expression returns. Look in the lower left corner of the expression window. You can check this to ensure the expression is formatting the date as you wish. When finished click OK.

2020-08-11_084008.jpg

Lastly, choose a font for your time label.

Activating Time

Now you are ready to activate the Temporal Controller panel. Click on the Temporal Controller button on the Map Navigation toolbar, or use View—> Panels to activate it. Once visible, click the Animated Temporal Navigation button (right-most with green arrow) in the Temporal Controller panel.

2020-08-11_084703.jpg

Exporting Still Images

Set the Step to 1 days. You can now use the Temporal controls to step through time. However, the data are so large it will probably be awkwardly slow. Notice the Export Animation button to the right of the Step. Click this, and set it up to export out a series of still images, one per day.

2020-08-11_084932.jpg

Creating the Final Animation in GIMP

Once the images have exported you can use the open source image editing software GIMP to create the animation. You can install it from the link.

Open GIMP and choose File —> Open as Layers. This will likely take a couple minutes as it loads all the still images.

2020-08-11_085248.jpg

Once it has finished loading the layers click Filters —> Animation —> Optimize (for GIF). This step too will take a couple minutes. Finally choose File —> Export As and export as a GIF. Set the File type as GIF and choose a folder for the export. Click Export and in the Export Image as GIF window be sure to check the As animation box. You can also choose the Loop forever option.

2020-08-11_090309.jpg

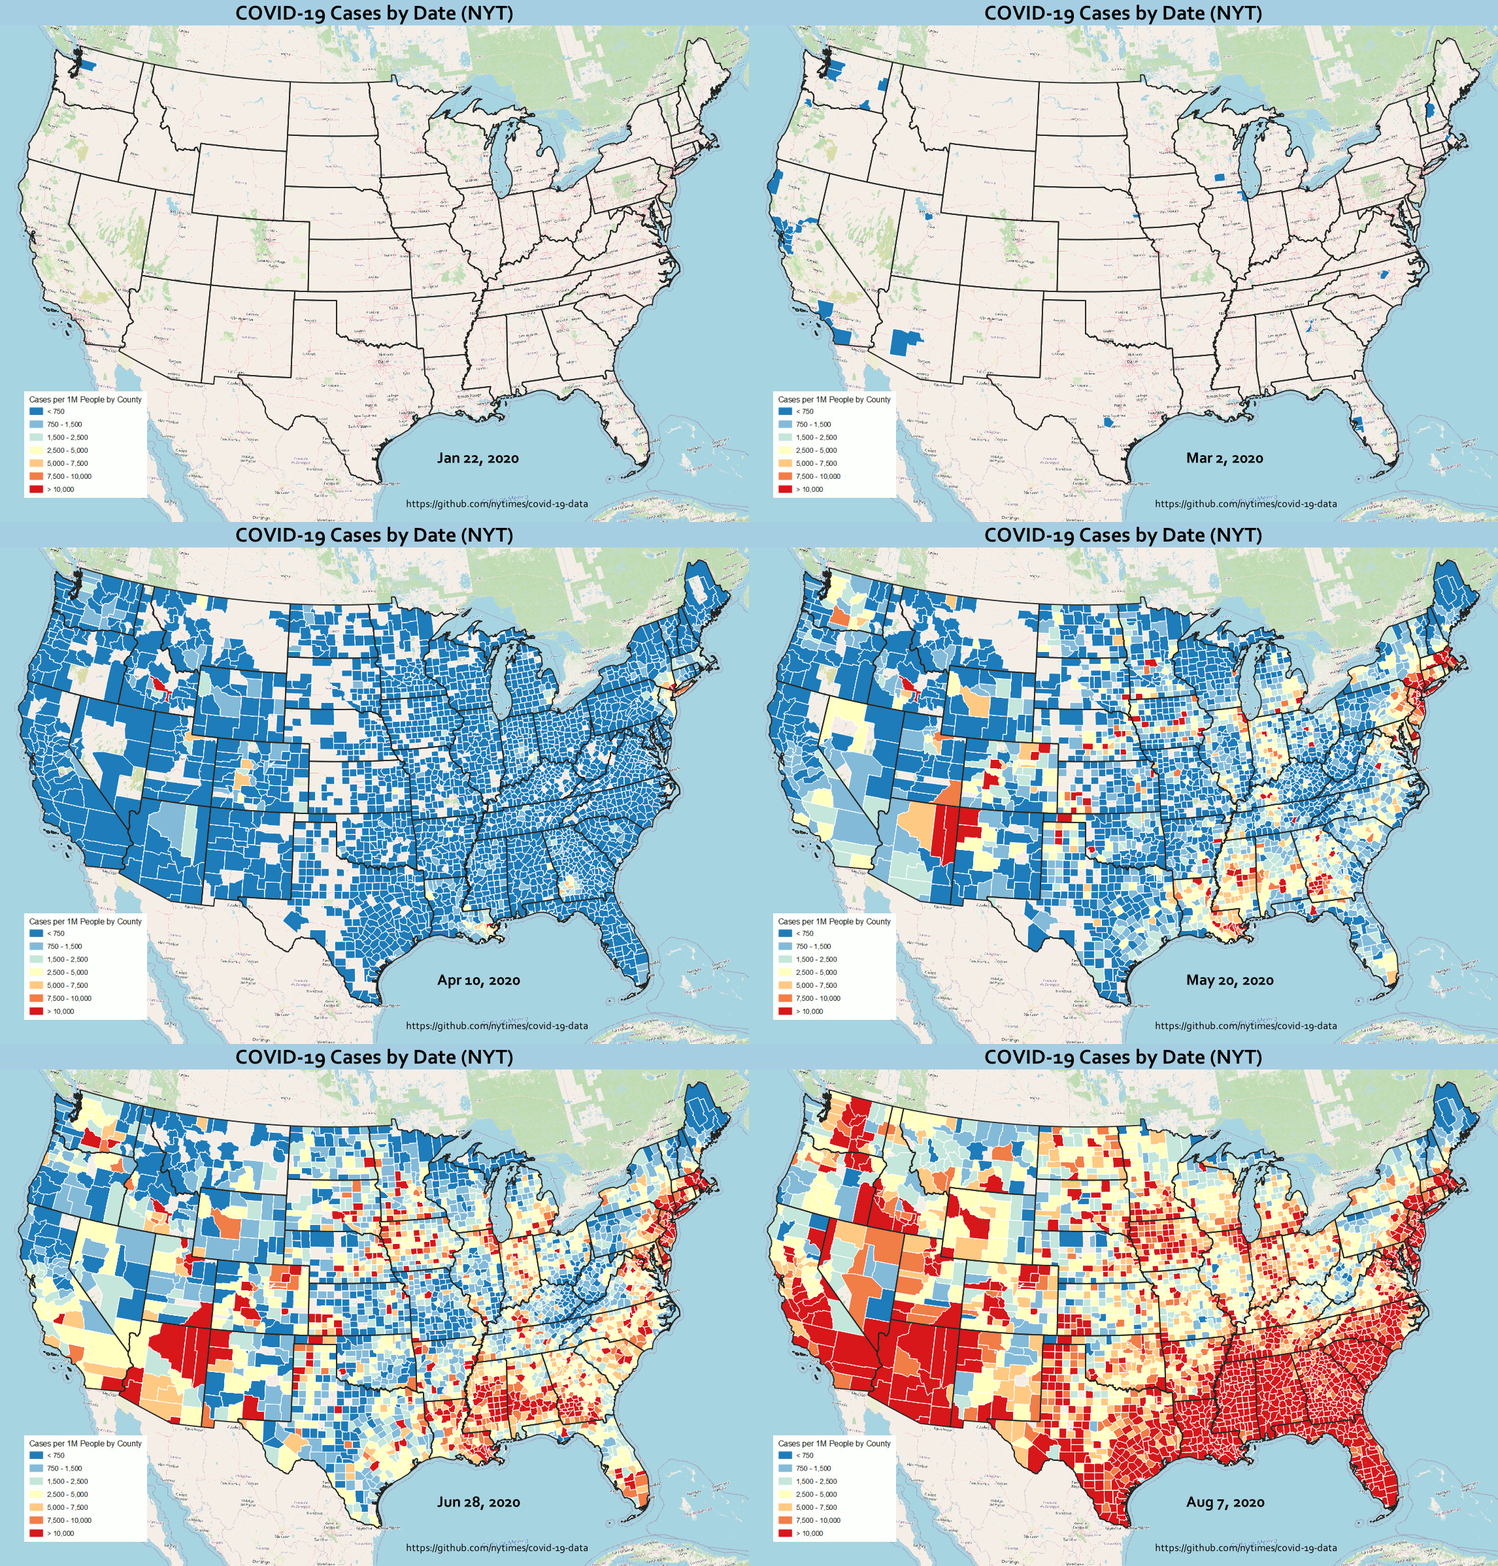
You will end up with something similar to the animation shown below! This same workflow can be used to create similar animations for deaths or for other countries.

DailyCOVID.gif

A Busy Summer with a QGIS Conference in Denmark and FOSS4G in Boston

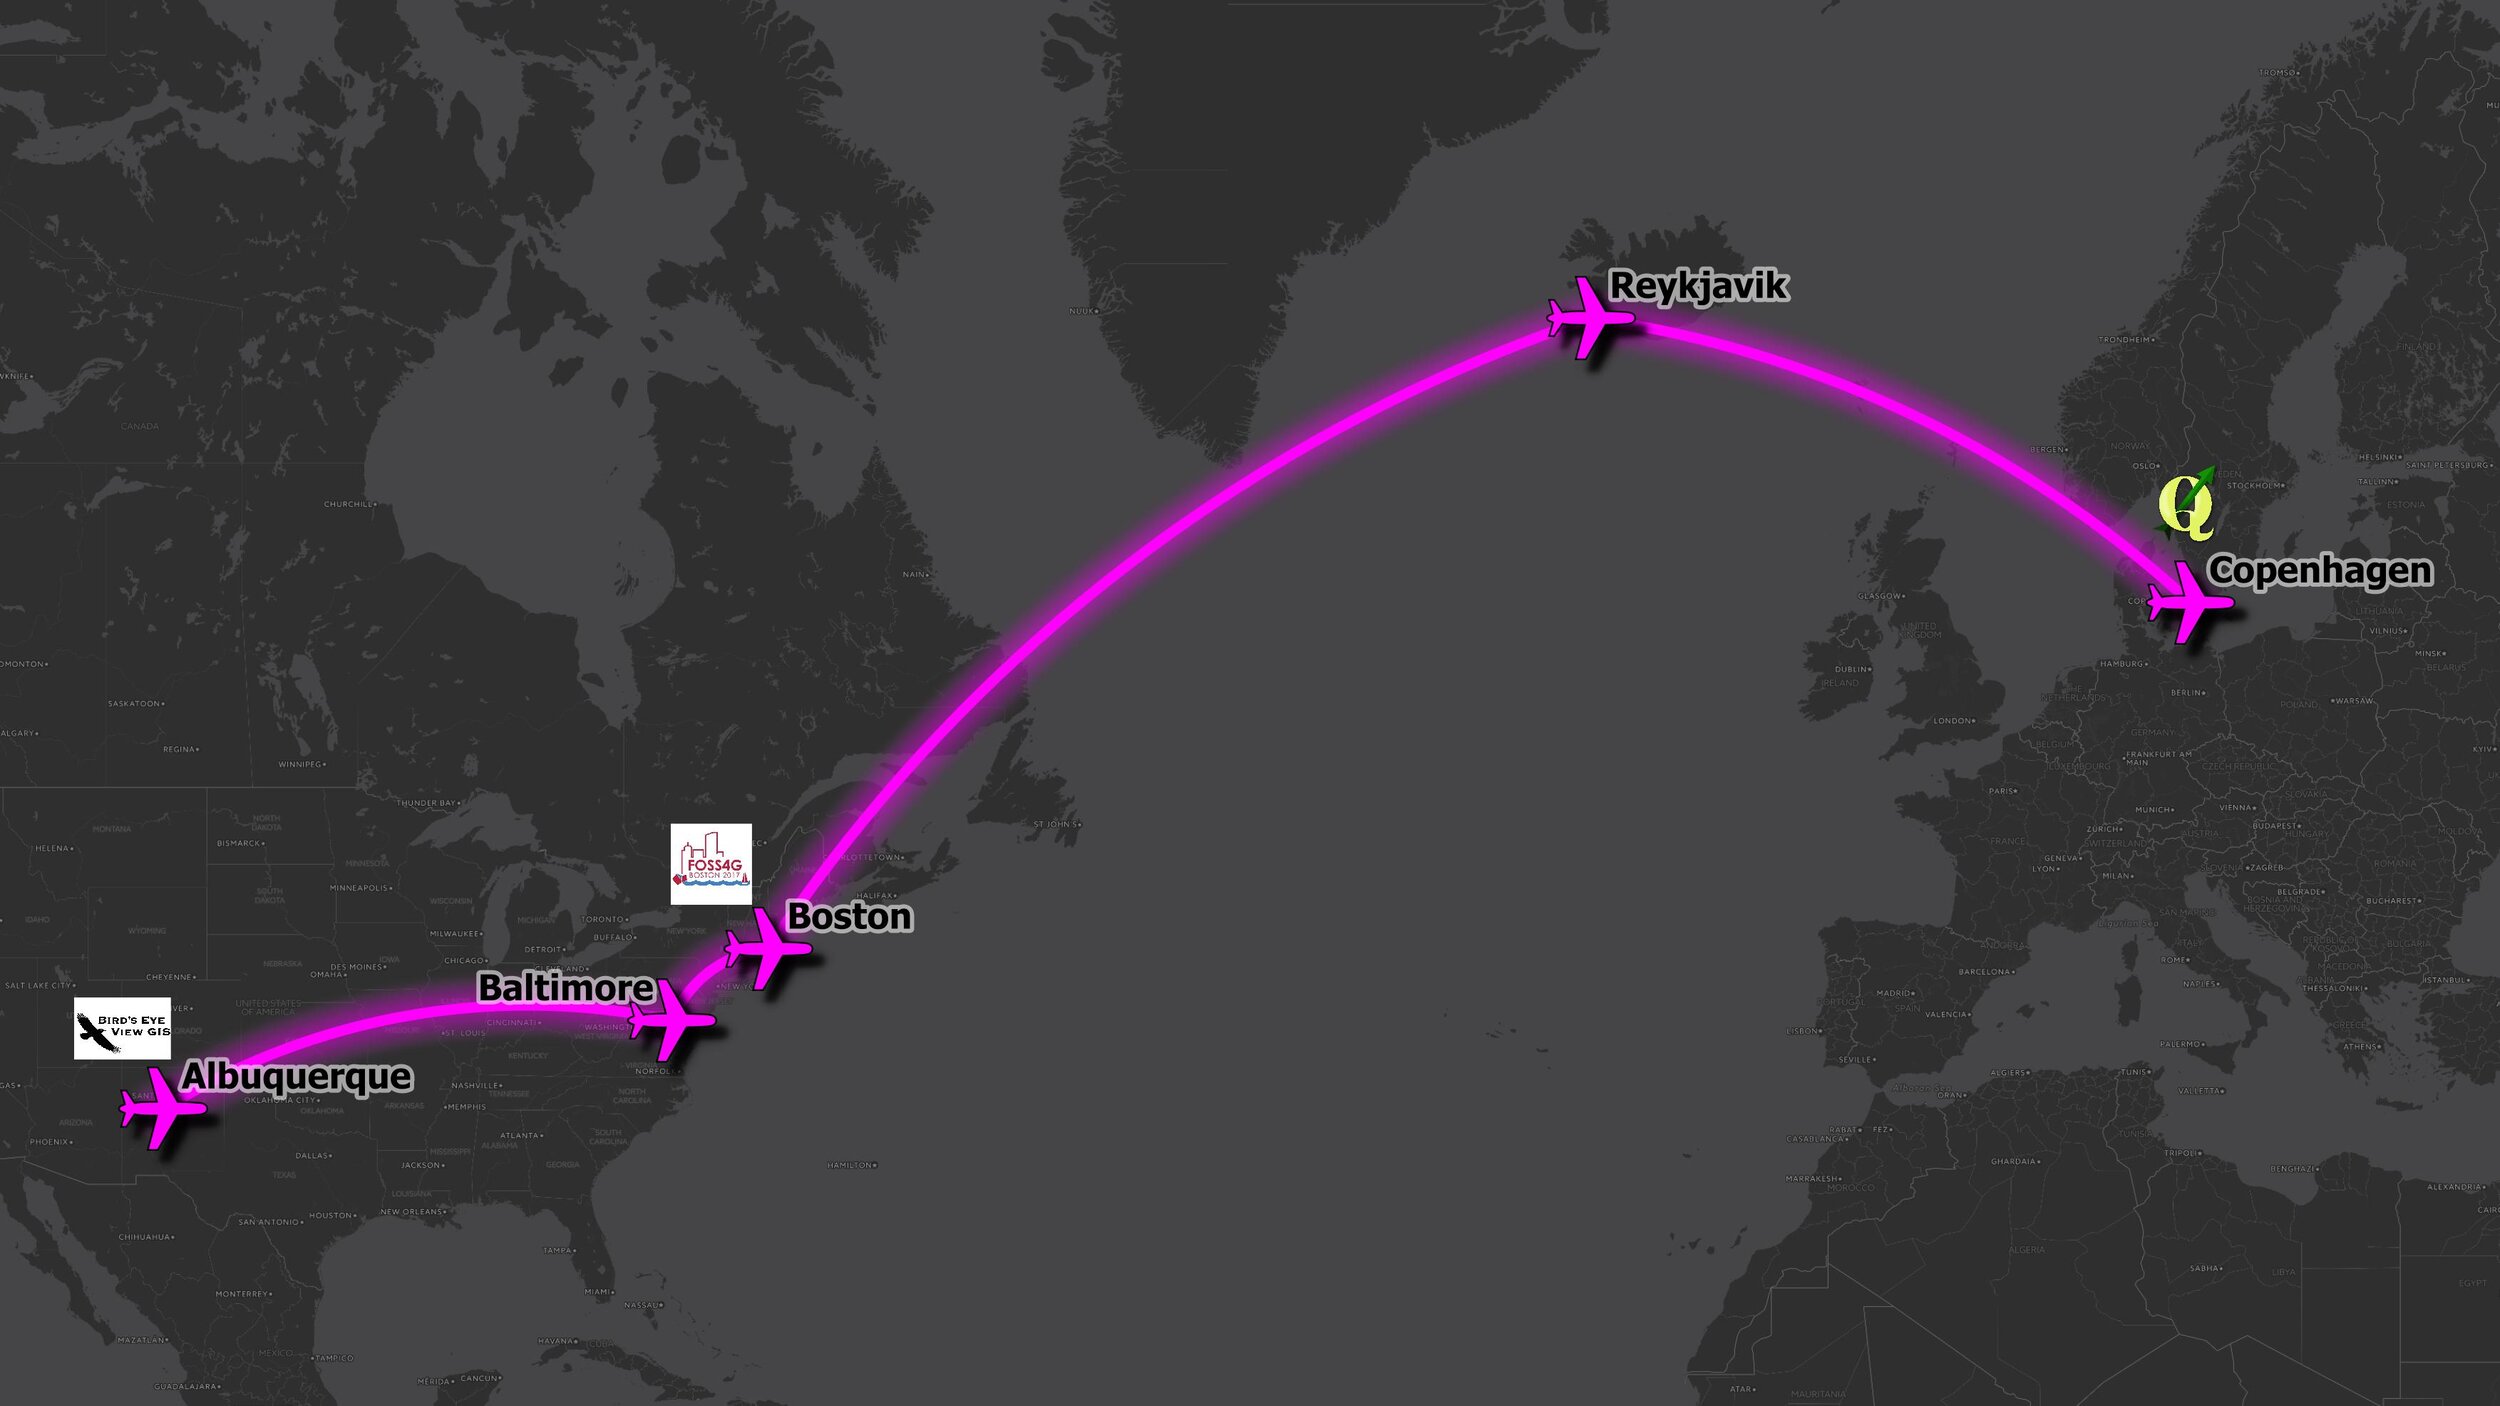
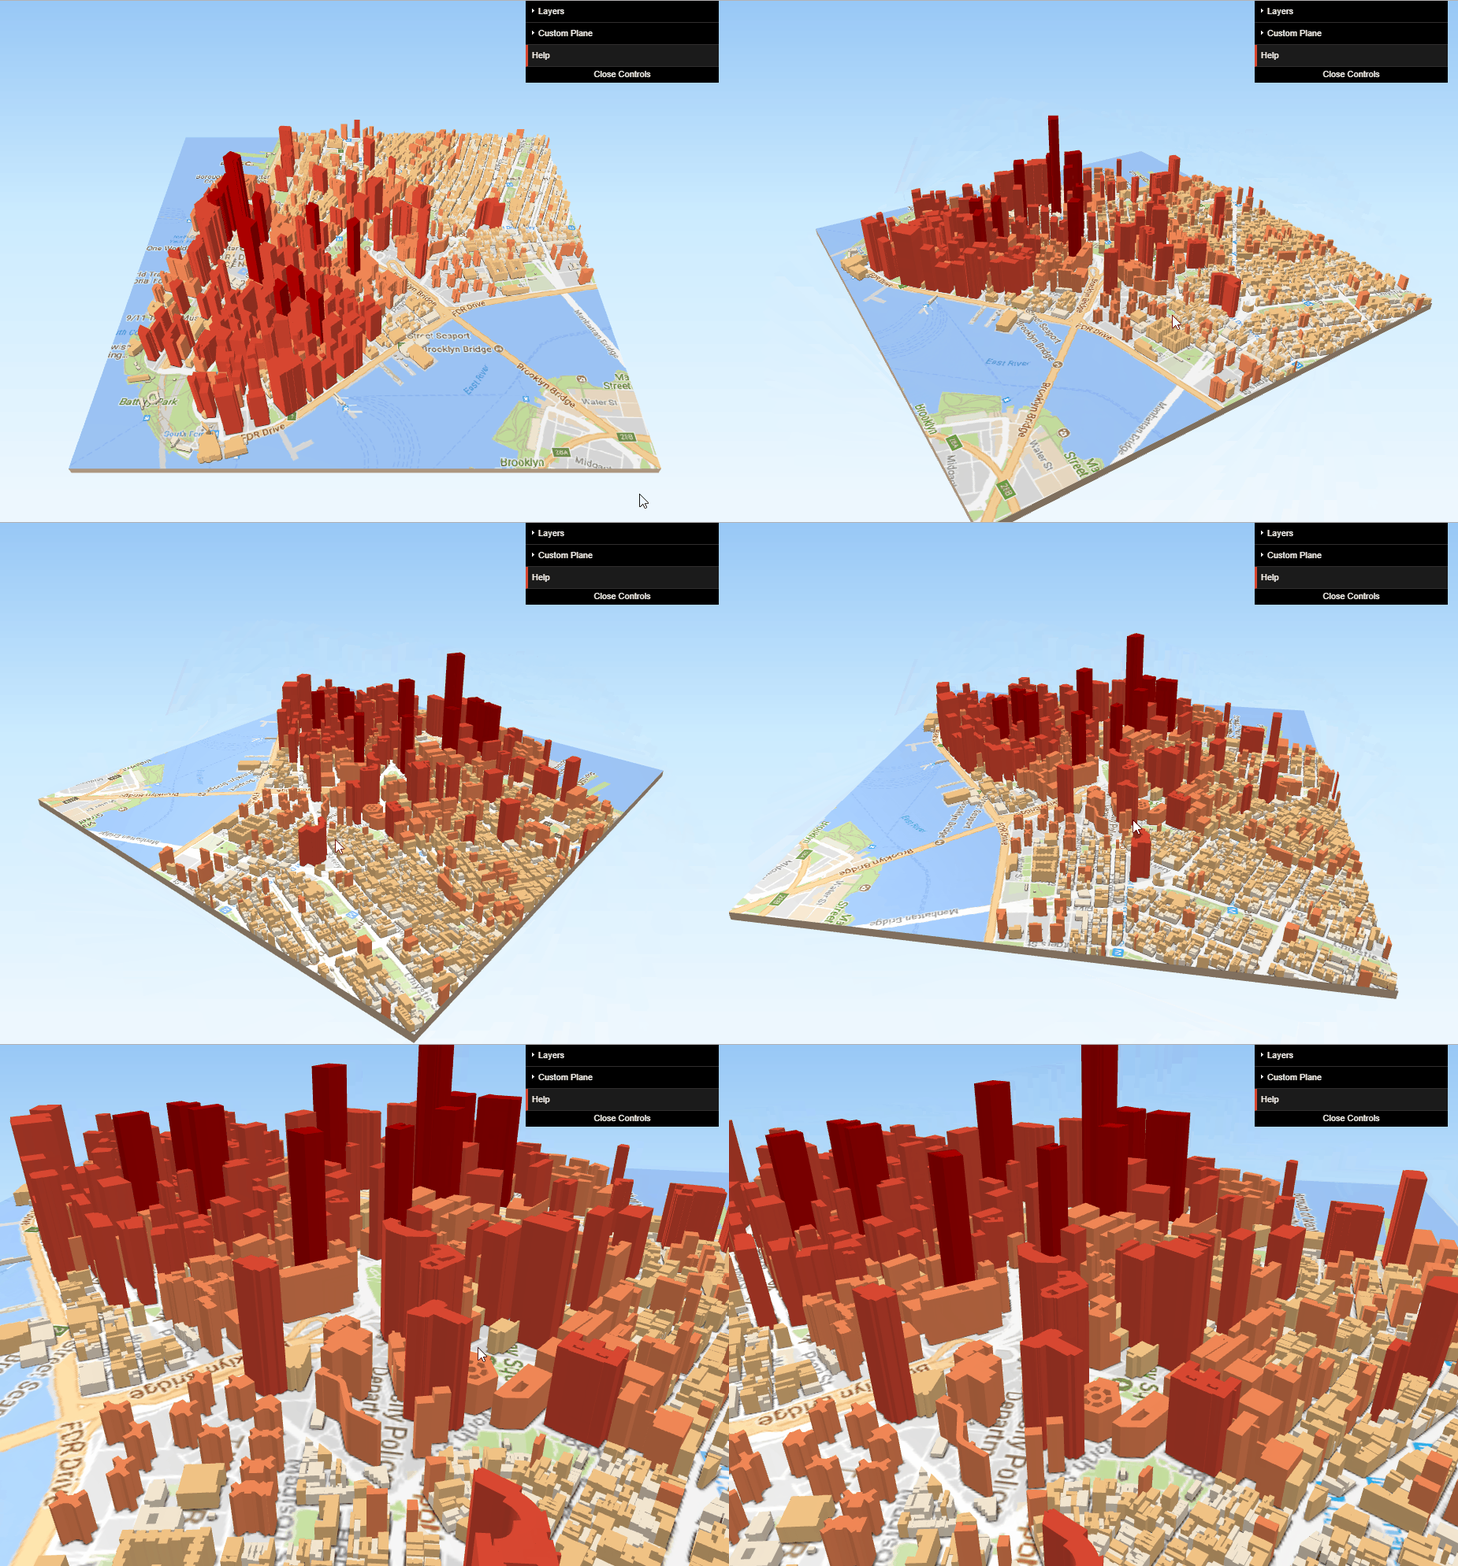
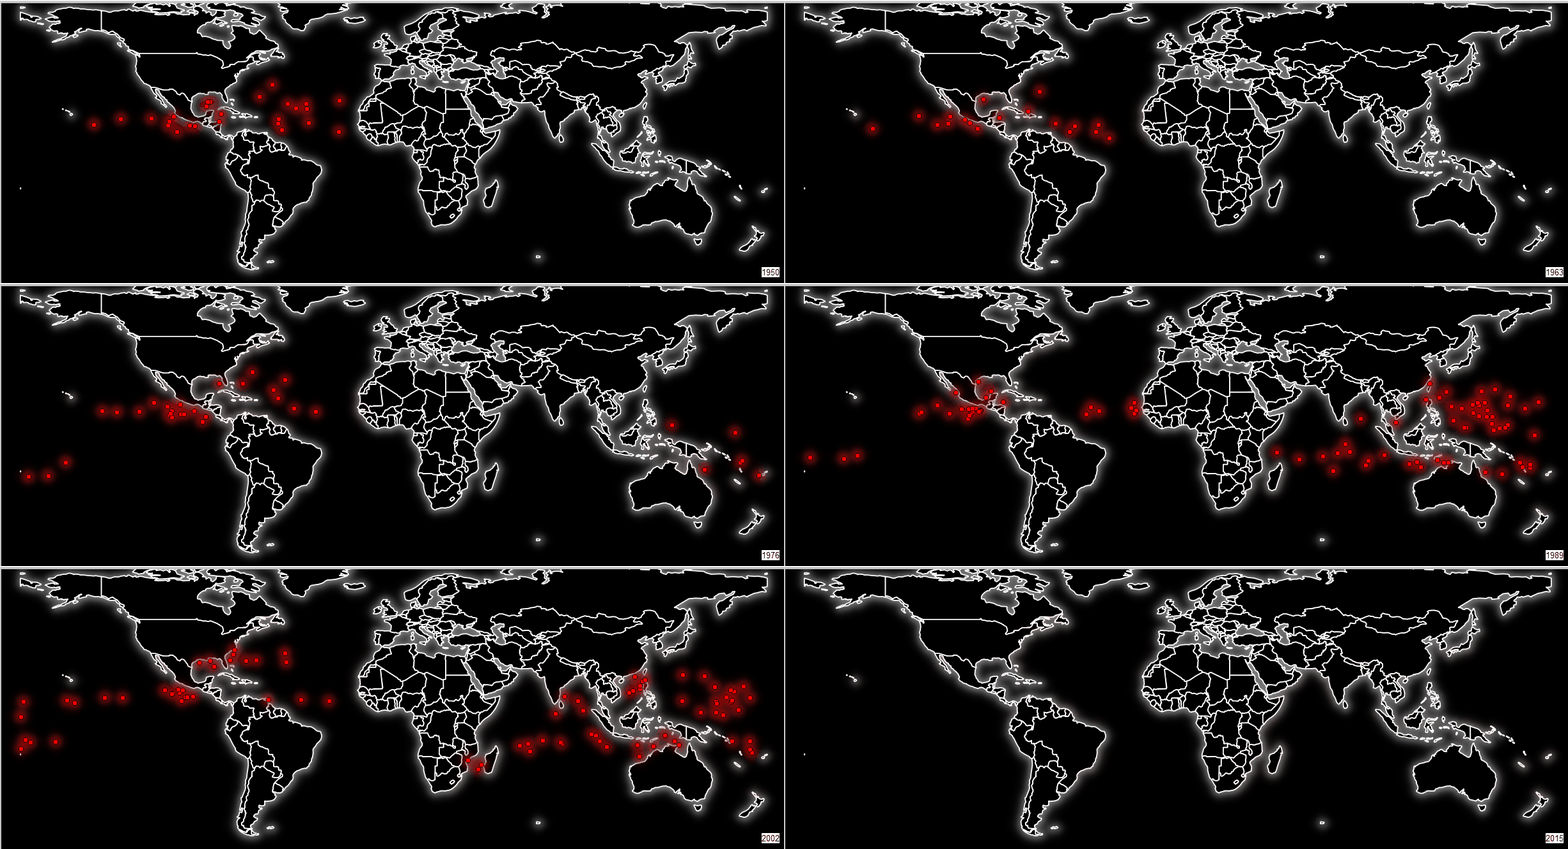
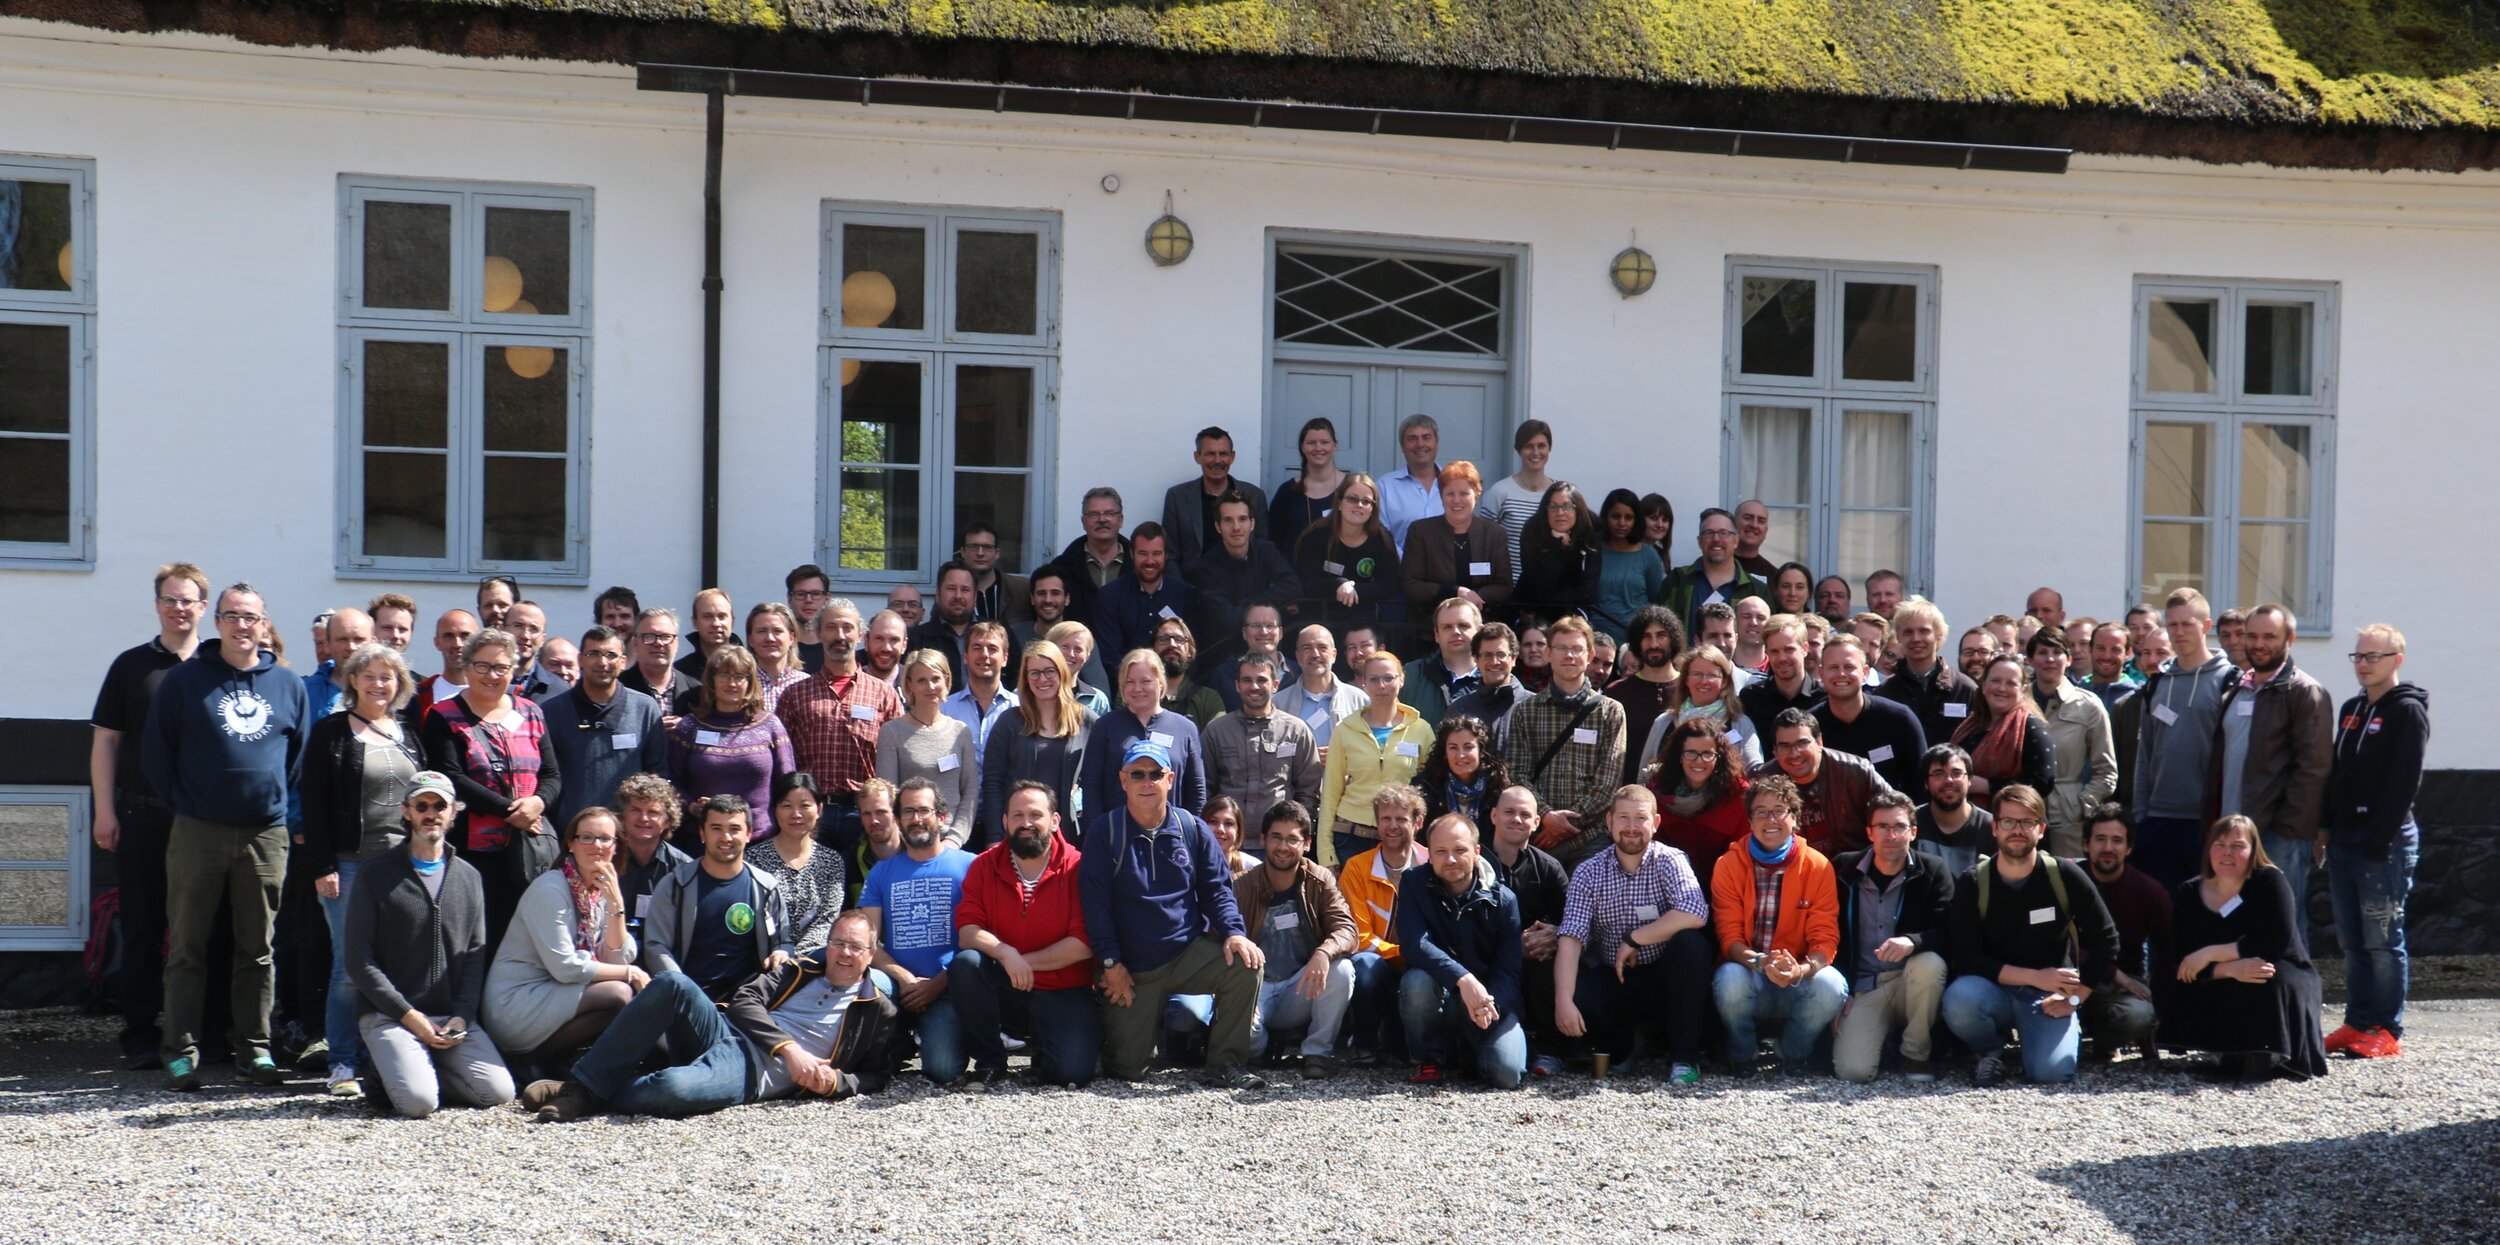
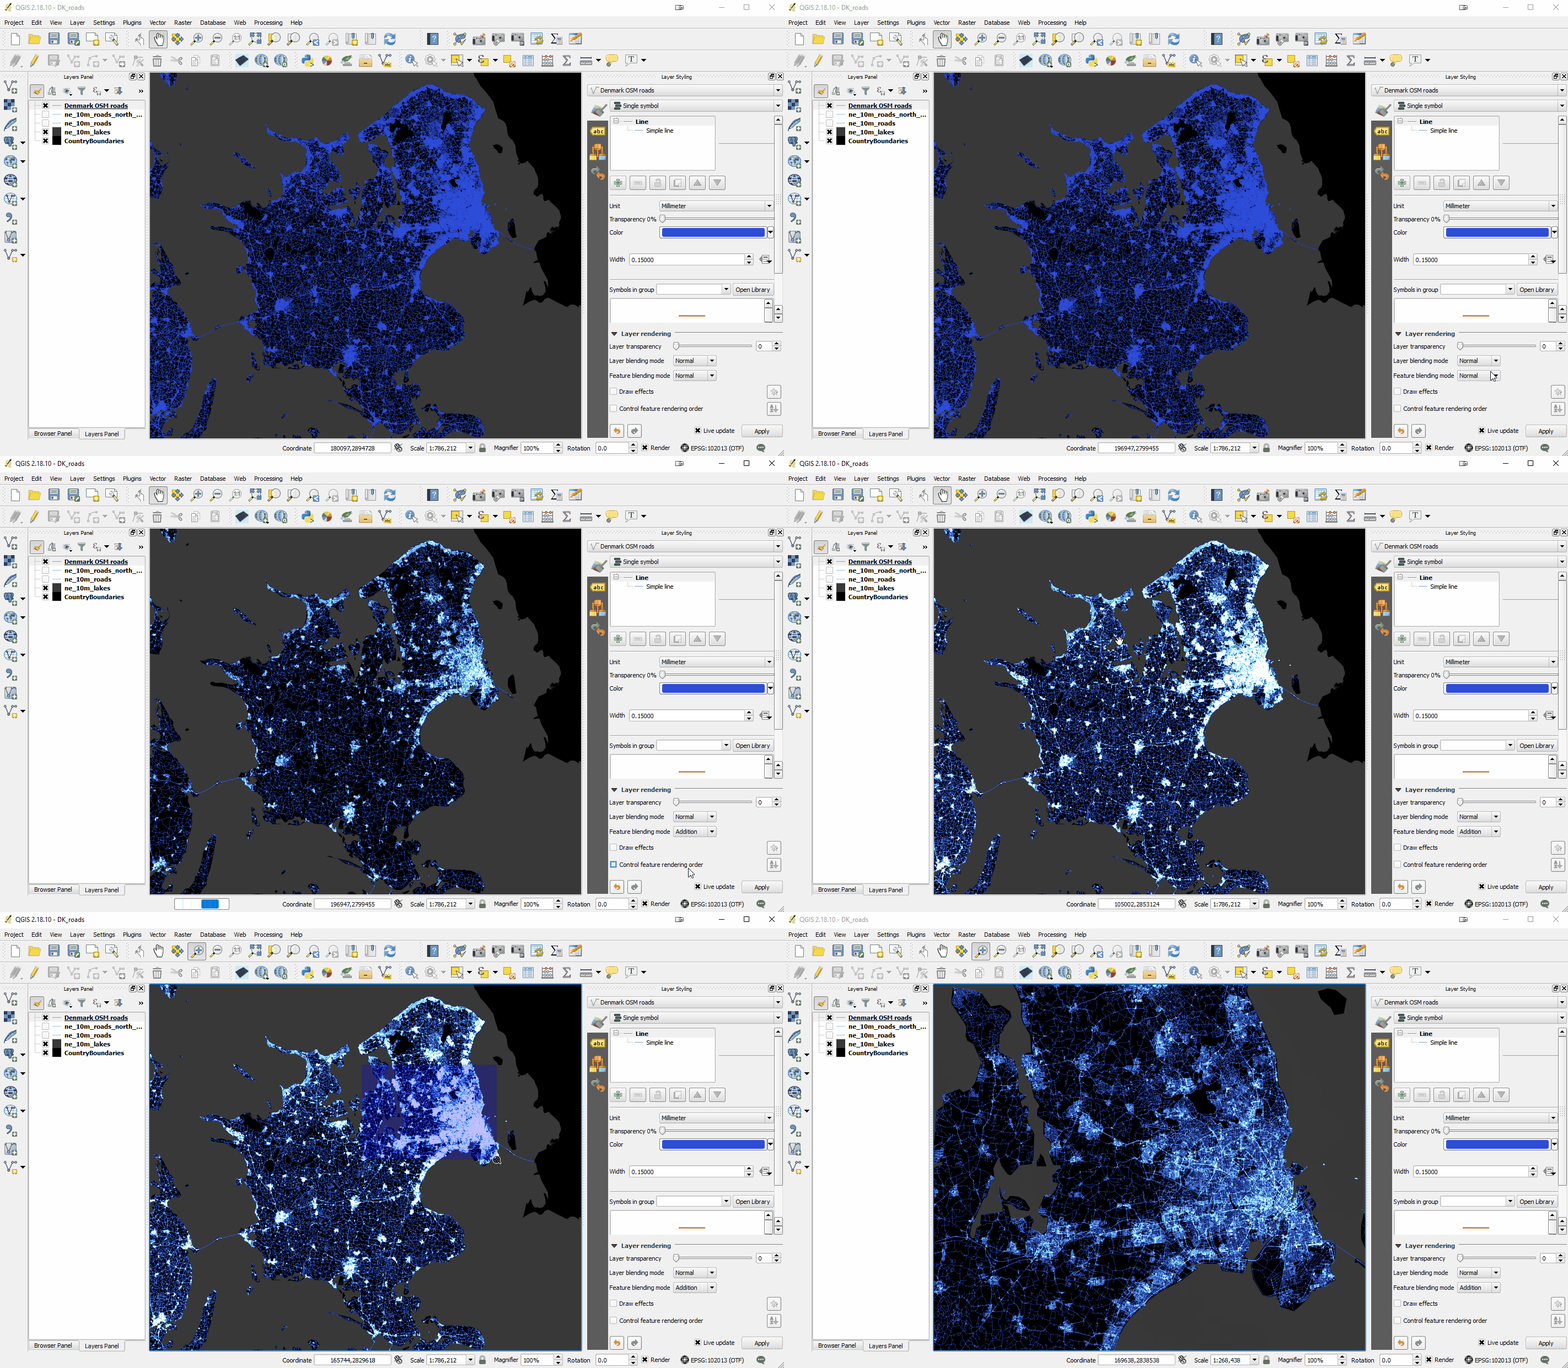
This summer Kurt Menke first attended the 3rd Annual QGIS User Conference, Hackfest and Developer meeting in Denmark. From there he traveled to Boston to attend the Free and Open Source for Geospatial (FOSS4G) International Conference. TriptoNodeboThe QGIS conference was small and intimate and a lot of new information was shared by the developers about the future of QGIS.1k0a4924There was so much presented that this will be a separate future blog post. While there Kurt conducted a full day workshop on Data Visualization and Cartography in QGIS.DG3tVwdXUAAnHgyHe shared many of the new sophisticated and powerful data styling tools now found in QGIS including: 2.5D, 3D, Live Layer Effects, Inverted Polygon Shapeburst Fills, Blending Modes, and some plugins such as Time Manager. Perhaps this could be a workshop shared with CHM partners at a future date? Some examples are shown below:FeatureBlendingDKManhattan3DCyclonesIn Boston Kurt presented the Community Health Maps project. The talk was well attended and there was a lot of interest. Fulcrum was a sponsor of the conference, and Kurt was able to meet with several of the Fulcrum representatives. While there he learned about Fulcrum Community. This is a new initiative designed to help humanitarian agencies, non-profits, NGOs, or Government entities. To begin you need to request a Fulcrum Community account. One important caveat is that data collected via a Fulcrum Community account is anonymized, free, and open to all by default. It is essentially an initiative that will help in larger crowd sourcing efforts. More details will be forthcoming as Kurt explores this and how it may apply to Community Health Mappers.This month (September), Community Health Maps will be travelling to the University of Connecticut (Community Medicine and Health Care) and to Miami to teach workshops. The workshop at the University of Connecticut will be to a large diverse audience. The Miami workshops will be focused on showing community members how to map damage and issues related to King Tides.Stay tuned for blog posts on: 1) the future of QGIS, 2) Fulcrum Community, 3) experiences in Connecticut and 4) Miami.

Community Health Maps Presenting at FOSS4G

This years international conference on Free and Open Source Software for Geospatial (FOSS4G) is in Boston from August 14-19th.rectangle_color_150_350Community Health Maps (CHM) will be presenting a talk covering the CHM program along with some case studies. Come and join us! It is a fantastic venue for people of all skill levels. There are usually around 1,000 in attendance. There are keynote speakers, paper sessions, and workshops. Many are suited for beginners while some are targeted at "power" users. Not only can catch up with the latest CHM news, you can also learn a lot about Fulcrum, QGIS, Carto and other useful mapping tools, and what people are doing with them.  In fact there is a co-located event hosted by Fulcrum called Fulcrum Live. This is an all day event (Tuesday August 15th) and is free for conference attendees. It will be a great learning opportunity.We hope to see you there. If you have any news on your mapping projects, please share it with Kurt or John. Perhaps we can include some slides highlighting your work at the conference!  

So What is Open Source Exactly?

This term ‘Open Source’ pops up in discussions about Community Health Maps and the blog and I realize many may not really know what it means. That’s OK, I’m going to explain it here. From both licensing and software development perspectives, there are two broad categories of computer software: proprietary and open source. The figure below shows some examples of both types.FOSS_vsProprietaryProprietary Software Proprietary software is created and sold by a corporation. They create software and sell it to make a profit. When purchasing it you may also be paying for the privilege to get help and support using the software. Or you may have to pay extra for that privilege. Two examples of proprietary software are Microsoft Office and Esri’s ArcGIS. There is also a license that accompanies a proprietary software package. When you purchase software, you are actually just buying a license that gives you the rights to operate the software. You never actually own the software itself. That software license will restrict use in some way:

  1. the number of computers you are allowed to install the software onto,
  2. the time period that the software will operate, and
  3. the number of features you are licensed to use.

Open Source SoftwareOpen source software (OSS), on the other hand, is created by a community of software developers (programmers). It is created to solve a common problem and is made available freely for everyone’s use. Open Office, Android and QGIS are examples. Open source software also comes with a license. That license tends to grant rights to users. For example:

  1. The freedom to run the software for any purpose.
  2. The freedom to study how the software works.
  3. The freedom to redistribute copies so you can help your neighbor.
  4. The freedom to improve the program.

Access to the source code may not be important to most, but the freedom to use the software as you see fit very well may be.open-sourceWhy Give it Away for Free?To many it is counter-intuitive for something of value to be given away for free.  However, open source software development isn’t entirely altruistic. Most of these programmers work for companies providing services with the software. Those involved in an open source project simply feel that this is a better way to create software. There are several reasons for this:

  1. there are a lot of “eyes” on the code and bugs can be spotted and fixed quickly,
  2. having access to the source code let's you understand how the software is working, it's not a 'black box,'
  3. you are not locked into a particular vendors system, licensing scheme or software release schedule,
  4. you have the freedom to create any missing functionality that you need
  5. you benefit from the contributions of others and vice versa.

Making Money with OSSObviously you can provide services using OSS. However, there are other ways to make money with open source. Companies like Facebook, IBM, Sun, and Google are all heavily involved in open source. Let’s take the example of Google. They may be the world’s largest open source company. One of the keys to their business are vast server farms, which include several million servers. Google never would have been able to get their company off the ground if it weren’t for the Linux operating system. The cost of putting a proprietary operating system like Windows on all those servers would have been prohibitive. Now their open source Android operating system is the most popular on the market with a 66.5% market share. In another example, even Esri's ArcGIS includes some open source software components 'under the hood.' This is because some open source software licenses allow that software to be bundled with proprietary software and sold for profit.Any given open source software is considered a 'project' and they aren’t all user friendly and useful. You still have to determine if the software will meet your needs. An important aspect is getting help and support. Things to look for include a good online manual, ‘how-to’ books, and an active listserv.QGISLet’s take QGIS as an example. It has fantastic support. It has a great online manual, training material, case studies, sample maps, commercial support, email listservs, plus a number of 'how-to' books written by people who use QGIS. The QGIS project does not have a corporation behind it. It has about 30 independent but dedicated core developers. They work in a democratic fashion, voting on new features to be implemented. As an end user you can provide input with feature requests! With QGIS, if there is a feature you need that doesn’t exist, you can hire (sponsor) a programmer to create it. It then may become part of the core program or it may be written as a standalone plugin. That feature then becomes part of the software and everyone benefits. As a user of the software, you can easily contact someone involved in developing the software and ask questions and request features. With proprietary software you never have such direct access to the development team. You can also donate to the QGIS project. Your donation will pay for developers to fix bugs and implement new features. Beyond programming there are many ways people can contribute to a project like QGIS. You can report bugs when you encounter them, write and translate documentation, contribute a case study, and write books.SummaryOpen source is both a development methodology and a software license. In the end it is really impossible to say that a proprietary software like ArcGIS is better than the open source equivalent like QGIS or vice versa. You must decide if either works for you, and freedom and monetary cost may be part of that decision.End Note:There are a lot of acronyms in GIS and specifically open source GIS. Here are some you may encounter:FOSS = Free and Open Source. Historically there were two similar software movements, Free Software and Open Source software. They are so similar that they now are lumped together, and people simply use this acronym when talking about them.FOSS4G – Free and Open Source for Geospatial. This is free and open source software specifically for mapping. OsGeo (below) holds annual open source GIS conferences called FOSS4G. The next is coming up later this month in Bonn, Germany.OsGeoOpen Source Geospatial Foundation – this is a non-profit organization whose mission is to foster global adoption of open geospatial technology by being an inclusive software foundation devoted to an open philosophy and participatory community driven development. To be considered an OsGeo project a software must meet certain requirements. QGIS is a project under the OsGeo umbrella.

How Does Esri Software Fit into the CHM Workflow?

Community Health Maps (CHM) necessarily focuses on low cost and open source tools. This is because our goal is to find mapping tools that can be used by any community group, no matter the budget or resources. However, that doesn’t preclude people from using Esri software or other proprietary mapping tools too.2016-07-28_112719One benefit of using Fulcrum for data collection, and QGIS for analysis and cartography, is that they both support a wide range of common GIS formats. This means that the data you’ve created via these two platforms can be easily brought into Esri’s ArcGIS software. Similarly if you have data you have created with Esri tools they can be brought into QGIS or Carto. This feature is known as 'interoperability' and QGIS is highly interoperable. For example, QGIS can work with shapefiles, Esri personal and file geodatabases, KML and over 100 other formats!From the outset we knew there were many scenarios for mapping software being used in public health and community organizations.  For instance, there are larger organizations who are already using tools such as Esri’s ArcMap, ArcGIS Pro or ArcGIS Online. With this scenario there are still several reasons the CHM mapping tools could be useful.

  • It might be that the organization doesn’t have enough Esri licenses for everyone in the office who’s interested in doing mapping work. In this case Fulcrum, QGIS or Carto could be used to fill the need.
  • An organization may find that their Esri license doesn’t give them access to certain tools they need. They could use comparable tools in QGIS to fill the need, without having to pay extra license fees just for one or two extra tools.
  • There may be smaller affiliated satellite groups that don’t share the same access to the software. In this case, these groups could use CHM suggested tools. Because of good interoperability they would then be able to provide data back to the central hub, where they could be incorporated seamlessly with the rest of the organizations data.
  • There may be certain tasks that are easier and faster to do in one piece of software and others that are easier in another. For example, I use both ArcGIS and QGIS daily to do different things. Many beginners also find QGIS to be more intuitive. GIS is simply a tool and by incorporating QGIS you are giving yourself a bigger toolbox.

If you are in an organization using another software package don’t worry. The tools we are promoting as part of this project can be integrated quite seamlessly with your current tools. It doesn’t have to be Coke or Pepsi, or Ford or Chevy. You can have both!

Discover QGIS - A new QGIS workbook!

Two years ago, myself and several colleagues authored the GeoAcademy which is the first ever GIS curriculum based on a national standard – the U.S. Department of Labor’s Geospatial Competency Model (GTCM). The GTCM consists of the knowledge, skills and abilities needed to be a working GIS professional.  Our team was honored with the 2015 GeoForAll Educator of the Year award for this effort. The GeoAcademy consists of 5 complete college courses.

  • Introduction to Geospatial Technology Using QGIS
  • Spatial Analysis Using QGIS
  • Data Acquisition and Management Using QGIS
  • Cartography Using QGIS and InkScape
  • Remote Sensing Using QGIS and GRASS

This winter I converted the curriculum to fit into a convenient workbook format with Locate Press. The workbook is called Discover QGIS.As you may be aware, QGIS is evolving rapidly. A new version is released every 4 months!  Due to this rapid development pace each spring a long-term release (LTR) is created. The LTR version is supported for a calendar year and is better for production environments. Originally written for QGIS 2.4, the GeoAcademy material in this workbook has been updated for use with QGIS 2.14 LTR. It therefore represents the most up-to-date version of the GeoAcademy curriculum. In addition to working with QGIS, it also includes exercises doing analysis tasks with the powerful GRASS GIS software, both alone and via the GRASS QGIS plugin. The cartography section includes exercises with InkScape. Here you'll learn how to begin a map in QGIS and use InkScape to finish a publication quality map.At the moment the digital version of the workbook is available as a Preview Edition for only $24.99. Purchasing this preview entitles you to the full version when it is released. There are just a few formatting issues to resolve.This book will be a great resource for Community Health Mappers wanting to build their skills. The 470 page workbook comes with exercise data, challenge exercises and solution files!Discover QGIS

A New Version of QGIS v2.14 Has Been Released!

Currently a new version of QGIS is released every four months!  To help users deal with this rapid development pace, the version put out each spring is designated as a long-term release (LTR). This means it will be supported for one calendar year. After that, new stable versions continue to be posted quarterly and any bug fixes associated with those quarterly versions are applied to the LTR. The LTR is recommended for production environments. It has a slower release cycle, and receives regular bug fixes throughout the year. Monday February 29th QGIS 2.14, the next LTR was released. It is nicknamed 'Essen' after the town in Germany where a recent developer meeting was held.essenEssen has a lot of new features. You can visit the Visual Changelog to read about all the new features in detail. You can also see who developed and sponsored each new feature. Community Health Mappers might be especially interested in these new features:

  • the new 2.5 D renderer which allows you to extrude features into space.

With25DandTreesShaddow-832x400

  • improved labeling
  • better control over map elements in the Print Composer
  • an improved Processing Toolbox
  • the new widget you get by right clicking on a layer in the Layers Panel and choosing Style. It allows you to change the color for a symbol without having to open a single dialog box!

2016-03-02_151603If you are using QGIS you should visit the download page and install the latest version! Note that the Mac installer takes a little longer to assemble and may not be available for several more days.Happy GIS'ing!

Using CartoDB for Beautiful Online Maps

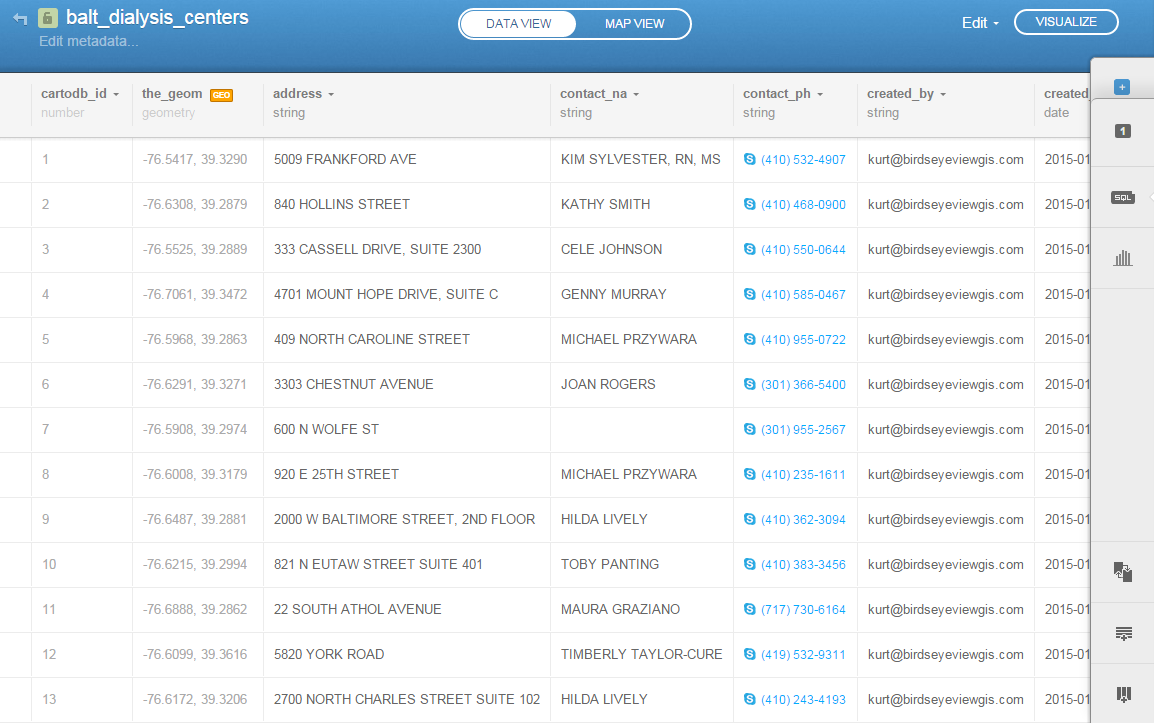
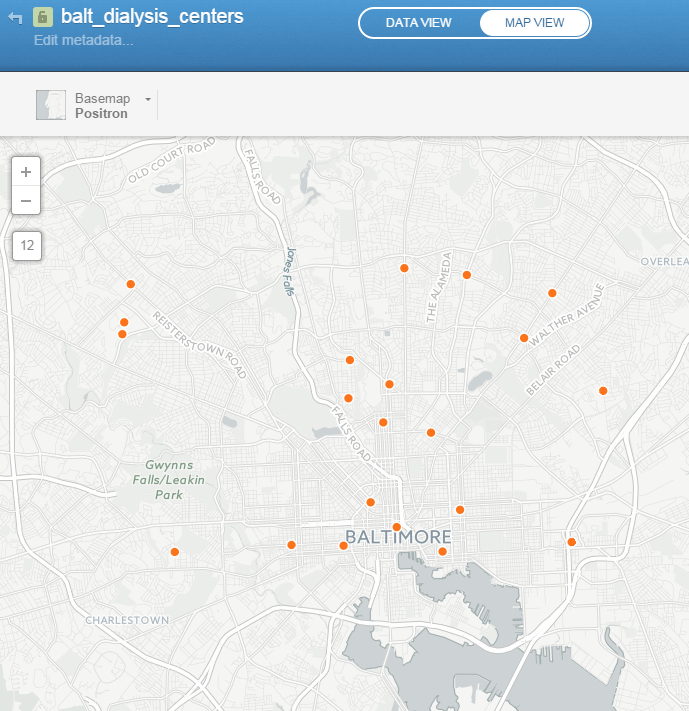
CartoDB is an online cloud based platform for storing and visualizing spatial data. It is the perfect tool for the third part of the workflow (outlined in the Introduction). You can sign up for a free account, which gives you 50Mb of storage space. Data can be collected with a smart phone or tablet with iForm, and brought directly into CartoDB.  It is a very intuitive platform. You can literally drag and drop a spreadsheet onto the CartoDB page and have the data upload to your account.  It will accept the most common geospatial file formats including: spreadsheets and comma delimited text files with addresses or coordinates, KML/KMZ, GPX, and shapefiles. Below is an example of a spreadsheet of Baltimore Dialysis Centers in CartoDB. This shows the spreadsheet in Data View .CartoDB Data ViewAfter telling CartoDB which columns contain the latitude and longitude values, the data can be viewed in Map View (below). Here the default Positron basemap is being used. There are a variety of basemaps to choose from including imagery, Stamen maps and Nokia maps.CartoDB Map ViewOnce multiple data layers have been uploaded you can create a visualization. Below is a map focusing on Balitmore Diabetes. It includes Baltimore neighborhoods classified by the number of diabetics, food deserts and dialysis centers.  CartoDB provides wizards and other tools for styling your data. The dynamic map can be accessed here: http://cdb.io/1G4xP7jCartoDB VisualizationVisualizations can be shared via hyperlinks and embedded into webpages.  CartoDB also has great documentation including:

Sign up for a free account and take it for a spin. On a related note Community Health Maps is almost done with a complete curriculum for community health mapping. It consists of six labs. The final lab shows you how to work with CartoDB from setting up an account to sharing a visualization. Stay tuned!

QGIS 2.8.1 Released

Today the next stable version of QGIS was released. It is being called QGIS version 2.8 'Wien'. Wien is German for 'Vienna' which was the host city for the QGIS developer meetings in 2009 and 2014.QGIS2.8_splashRecently a new version of QGIS has been released every four months. This rapid pace of development has its pros and cons. On the plus side, the software is rapidly growing and improving. On the con side it has made it difficult to maintain documentation. It has also been an issue for people working on large projects. They have had to deal with the software changing every four months.QGIS 2.8 is a special release because it is the first in a series of long-term releases (LTR's). The idea is that one release per year will be an LTR. This means that the LTR release will be supported and available for download for one year. This way people needing stability can use this until the next LTR is released a year from now.Some of the highlights are:

  • Numerous bug fixes and stability improvements
  • QGIS Browser is more responsive
  • Ability to select the units in the Measure tool
  • Improvements to editing: better control of snapping and a new suite of Advanced Digitizing tools
  • Improvements to the Map Composer such as better control over coordinate graticules and map rotation.
  • Symbology improvements such as filling polygons with raster images, ability to have multiple styles per layer.

The detailed list of new features can be found here: http://www2.qgis.org/en/site/forusers/visualchangelog28/index.htmlVisit the download page and take the new version for a spin. Remember you can install it on Windows, Mac and Linux! 

FOSS4G Academy Launched

For the first time there is a complete GIS curriculum based on free and open source (FOSS4G) software! Better yet the material are freely available to everyone. The curriculum consists of five courses:

  • GST 101 - Introduction to Geospatial Technology
  • GST 102 - Spatial Analysis
  • GST 103 - Data Acquisition and Management
  • GST 104 - Cartography
  • GST 105 - Remote Sensing

Examples of FOSS4G Academy QGIS LabsThe courses were developed via the National Information Security and Geospatial Technologies Consortium (NISGTC), under the leadership of Phil Davis (Del Mar College). Kurt Menke (Bird's Eye View), and Dr. Richard Smith (Texas A & M - Corpus Christi), authored the material which includes: theory, lecture, labs, data and task oriented video tutorials for each lab exercise.The courses are aligned with the Department of Labors Geospatial Technology Competency Model (GTCM). The GTCM  was published in 2010 and will be revised in 2015. It describes the complete set of knowledge, skills, and abilities required by GIS professionals. It is designed around a hierarchical tiered model of knowledge and promotes use of open source technology.GTCMQGIS is the featured software for all courses. When appropriate other FOSS software's are also included such as GRASS and InkScape.The vast majority of US based colleges and universities use a single vendor's proprietary GIS software, making this series of courses very unique. In fact it is the first national attempt at a completely open source GIS curriculum. By their very nature of open source software, there is no marketing engine promoting them. This has slowed the adoption and overall use of open source GIS. One hope is that this material will entice people to learn about the same low cost mapping workflows that the Community Health Maps program is promoting.The targeted audience is broad and includes:

  • Secondary school educators and students
  • Two and four year college educators and students
  • Students in need of GIS skills
  • Workers seeking to broaden technology skills
  • Anyone desiring QGIS and open source knowledge and skills

The courses are available online at the FOSS4G Academy. Over 2,500 students have already enrolled for these courses demonstrating how in demand these materials are. Visit the FOSS4G Academy now and explore the material!FOSS4G Academy