By Angela Kim & Colette HochsteinOn October 4, 2018, National Library of Medicine® (NLM) Research Assistant Julian Argoti and University of Maryland (UMD), School of Public Health intern Angela Kim spoke to the “Professional Preparation in Community Health” class at the University of Maryland, School of Public Health, College Park. The 75-minute class was attended by approximately 45 undergraduate students in the UMD Behavioral and Community Health (BCH) program. The presenters introduced NLM’s Community Health Maps (CHM) blog and facilitated a hands-on activity. The presentation covered a basic introduction to the tools and workflow in CHM. The students were asked to use Fulcrum, a low-cost tool, to build a custom data collection form for the first step of the CHM workflow – data collection. They discovered first-hand how intuitive the tool is. After creating their own custom data collection form on the topic of their choice, the students left the classroom to collect data points around the School of Public Health building.
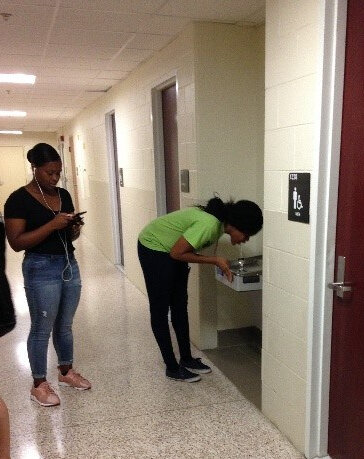 On their return, the students explored maps of their data points on Fulcrum. Many noted that the process of collecting data points was easy and fun. UMD Professor James Butler mentioned that although drinking a good amount of water is emphasized at the School of Public Health, he had not previously noticed that there is no water fountain near the faculty lounge. His comment underscored that issues are often not observed until actively examined, as during the mapping process.
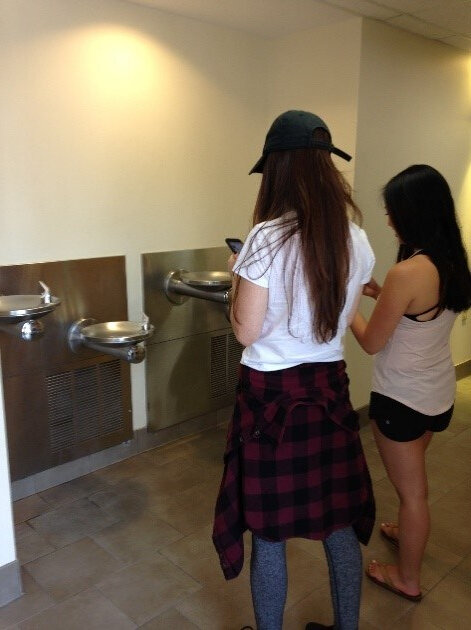 The class ended with Professor Butler concluding the class by reiterating how CHM can serve as a useful tool for visualizing many of the different health issues discussed in class.The students were alerted to the free new online Community Health Maps online tutorial, a self-paced course from the NLM designed to help users gain the skills needed to use Community Health Maps.
QField - A QGIS Related App for Data Collection
QField is an application for collecting field data via an Android device. It was started 4-5 years ago by the Swiss company OPENGIS.ch LLC which also employs several core QGIS developers. QField has reached the point where it rivals most data collection apps. The only reason we have not been using it for Community Health Mapping workshops is that it is not available for iOS. This is simply because the open source license used by QField does not allow it to be wrapped into a proprietary software license like the one Apple employs for it's store. If however, you are a Community Health Mapper who uses Android it is a fantastic choice.NOTE: It is possible to set up an app which is compatible with iOS but does not participate in the App Store. This solves the licensing issue. Setting up an app this way necessitates becoming part of the iOS Enterprise Program which costs money. QField developers would like to make this happen, and it will likely involve iOS users donating to QField. Although QField is rooted in QGIS code it is not a miniature version of QGIS. Rather it is a streamlined data collection app. As they say, "the buttons are few and they are large," so you can work with it out in the field. QField lets you create a map in QGIS and upload that map to your mobile device. From there you can collect data.The workflow for QField looks like this. You begin by making a QGIS project on your computer. Importantly this project will contain the point, line or polygon layer(s) you want to populate in the field. (NOTE that Fulcrum only allows the collection of points!) This means you think of your survey form and data to be collected in the office, and create fields in your GIS layer(s) for each question you want to answer. With a little bit of QGIS editing familiarity this isn't any more difficult or time consuming than creating a form in Fulcrum. You then upload the folder containing the QGIS project and data to your mobile device. The GeoPackage data format, which is the default for QGIS 3.x, works great with QField. There is even a QGIS Plugin named QFieldSync that facilitates migrating your project to your device. Once the data has been copied to your mobile device you can open your QGIS map file using QField.
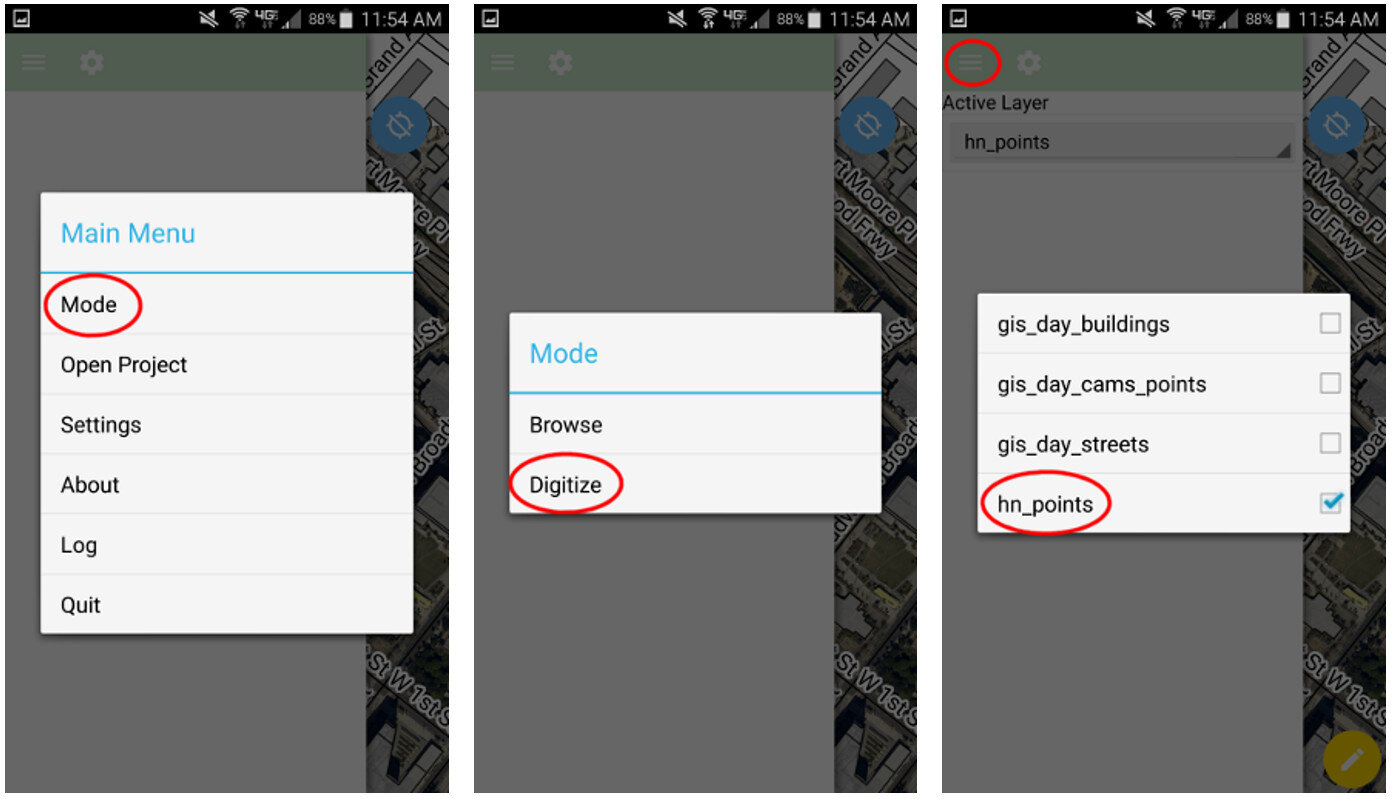 QField uses the same rendering engine as QGIS so the map will look identical to how it did in the office. Once the map is open you can select from one of two modes: Browse or Digitize. When collecting data you would choose Digitize. Then select the layer you want to work with.
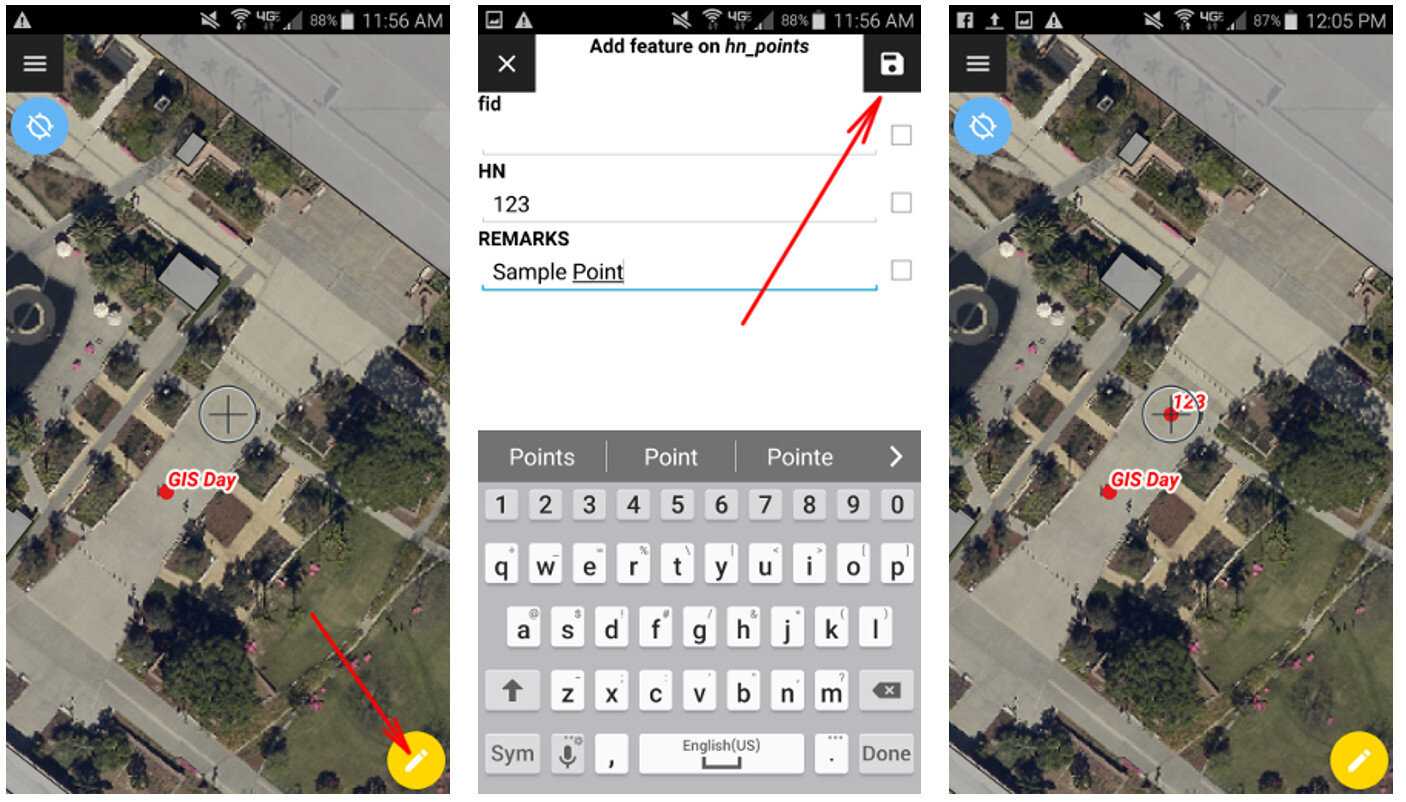 For public health officials with security concerns QField is a great fit because there is no third party cloud platform involved. The data is not being streamed across the internet. All the data is stored locally on your mobile device. You can simply use the My Files app on your device to navigate to your GeoPackage file and email it to yourself. If it is too large you can connect your device to you computer to download it or use a data sharing app such as DropBox or Google Drive.Since this is an open source project you can request new features and report any bugs you encounter by contacting the developers! Since QField doesn't cost anything to download and use, you can also consider donating to the project to help it continue. Even small donations are helpful to projects like this. Doing this makes QField better for everyone. I encourage you to try it out.
Editing Points in Fulcrum
I am often asked if and how points can be edited in Fulcrum. Yes, you can edit points in Fulcrum! This short post will show you how. Fulcrum is not only a way to collect community data, it's also a platform for showing that data on a map and a database you can edit. For this example, I will use the App I designed for the recent ASTHO workshop in Hawaii. We collected points around the conference facility at the Ala Moana Hotel. If a point isn't located correctly I can go in and edit the location in Fulcrum.To demonstrate this I have opened my ASTHO app. To see the data I will click on the records icon to open the data in map view. From here I simply click on a point I want to edit. The data form for that point opens. To put the data into Edit mode I click the pencil icon . To change the location I click the Edit Location button. Then I click on the map at the location where the point should be moved. To save my edits I click the green Accept edits button
  .
.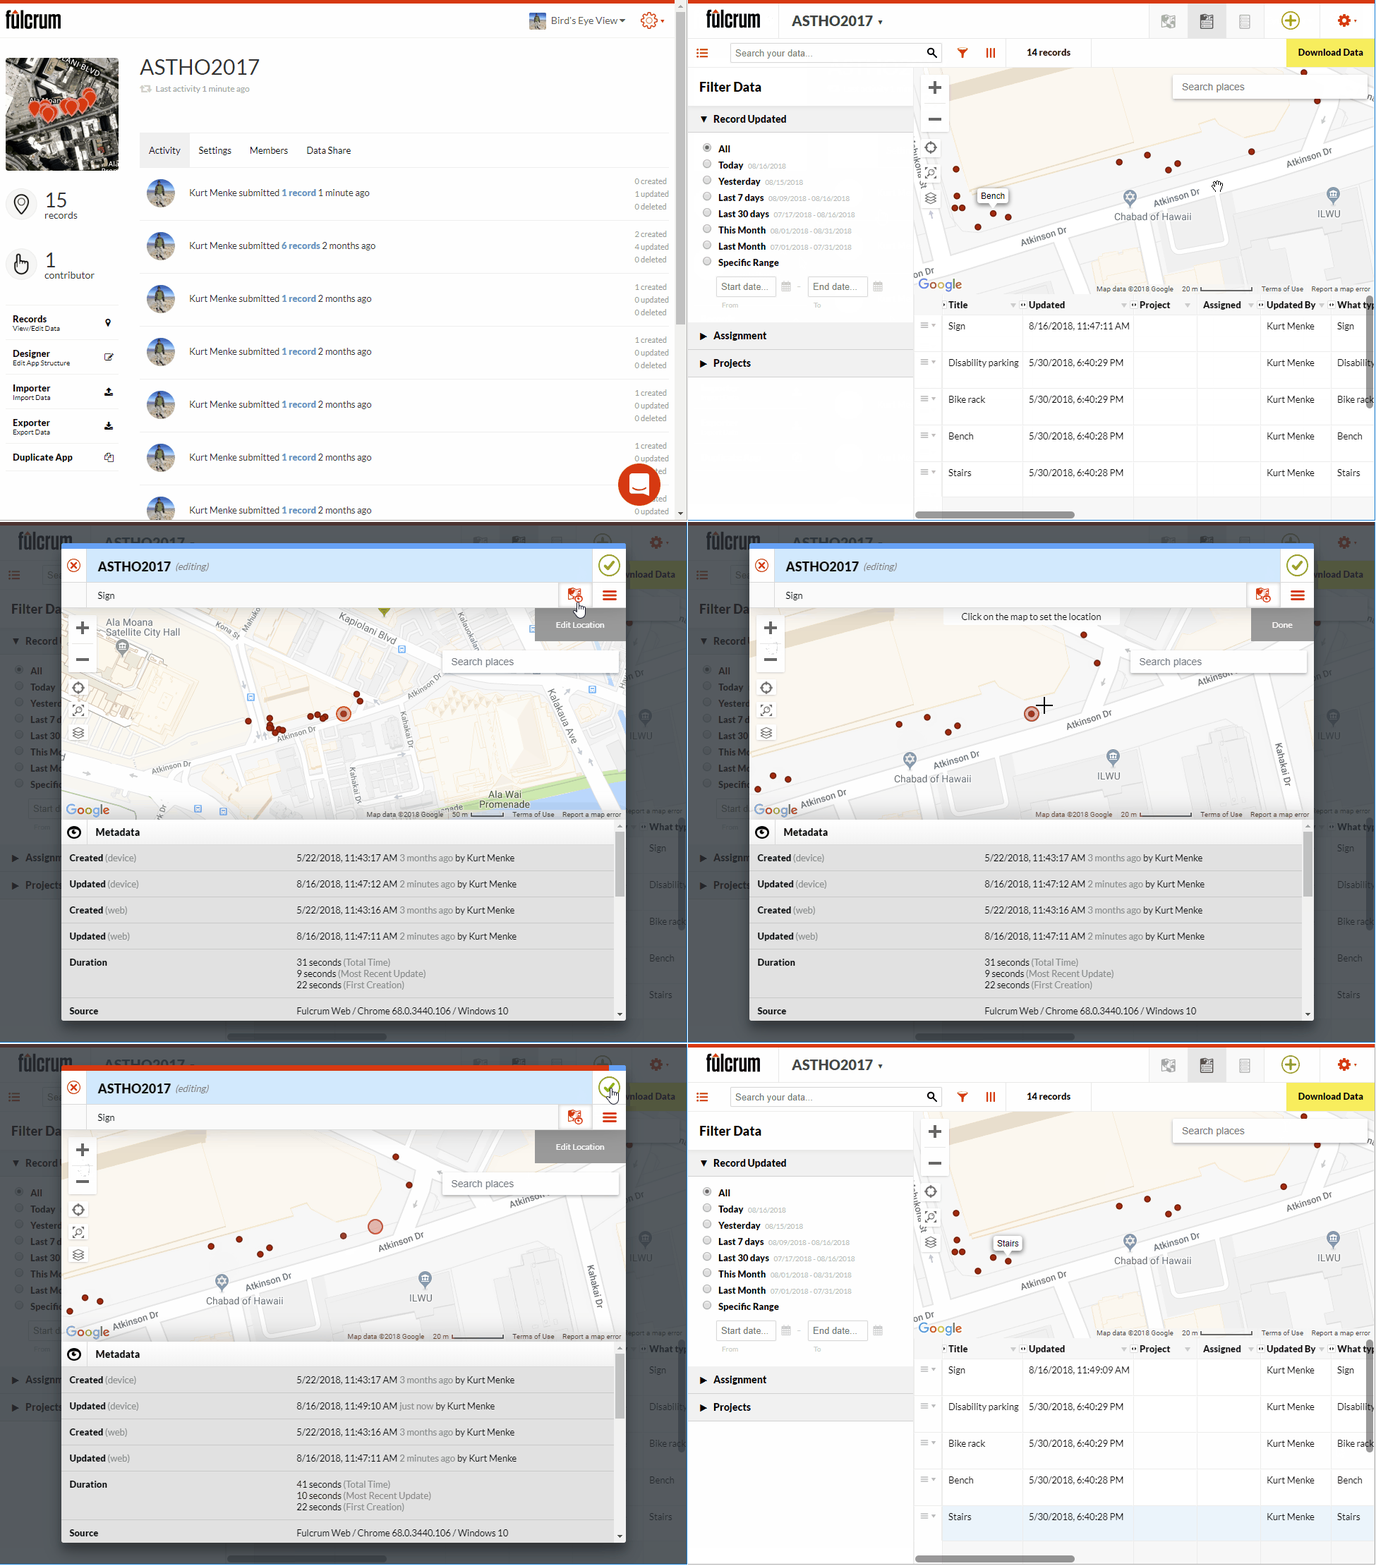 I can also edit the attributes of a point. It is a similar process. First I click on the point I need to edit. Then I click the pencil icon. I scroll down to find the attribute I need to edit and make the change. Once done click the green check mark button to accept the changes.
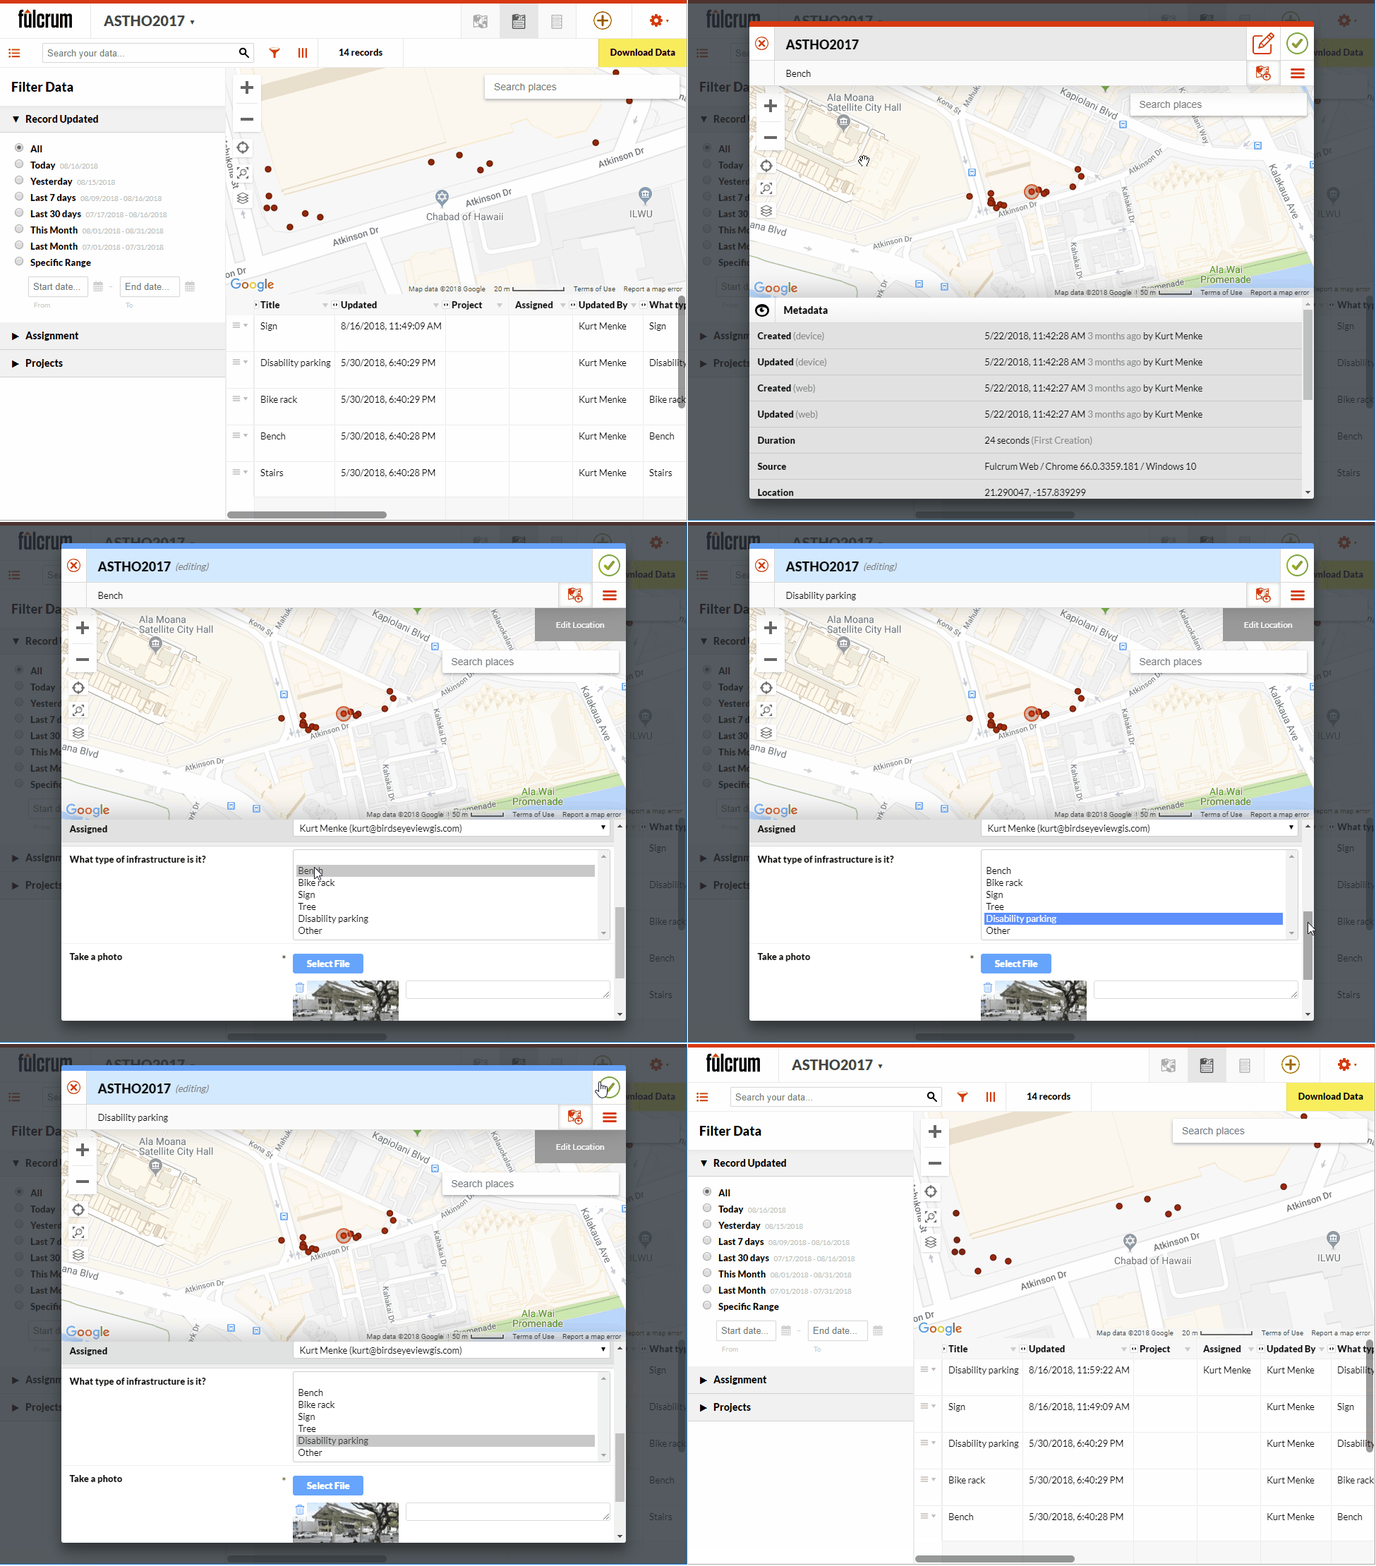 I can also add new points from this interface in Fulcrum. To do this I simply click the green Add point button
  and populate the attributes. If I have elements where were set to required in my App, I will have to populate them here, just as I did with my mobile device in the field.So if you have collected some data and realize it needs some correction you can do that directly in Fulcrum prior to downloading it. Also note that the data can also be edited in QGIS and Carto. I'll cover those procedures in future posts.Happy mapping!
The Carto Grant Program
Carto, the platform for making online maps, recently abandoned it's free license option. The reason they gave was that many users were creating accounts, sometimes several accounts, and simply not using them. This became expensive overhead for them to manage. As a result they now offer a Professional or Enterprise plan once your free trial expires. This new pricing scheme is shown below: Note that non-profit organizations receive a 20% discount off this Professional license. This license also affords you many more benefits than the previous free license. For example, the free license gave you 50Mb of cloud storage space while the Professional plan gives you 500Mb. It also allows you to set permissions on your datasets to make them private. It also gives you email and online support.If that price is beyond your organizations budget you will notice that directly below the pricing plan is a section covering FREE Plans for Students and Great Causes!
 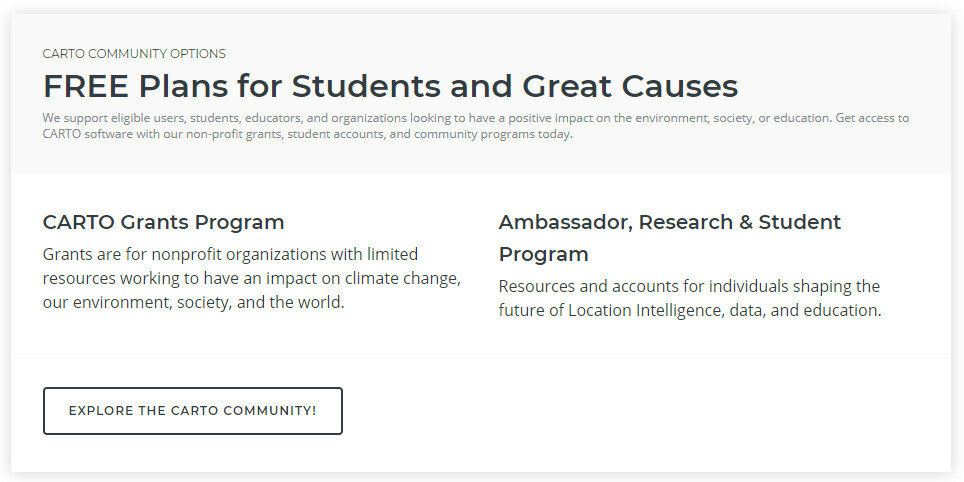 Carto has a grant program. You can read about this program here. All it takes to apply is filling out an application form!
A Pair of Community Health Maps Workshops at the ASTHO Climate and Health Summit
During the last week of May the Community Health Maps team (Janice Kelly, John Scott and Kurt Menke) traveled to Honolulu to participate in the Association of State and Territorial Health Officials (ASTHO) Insular Area Climate and Health Summit. There were representatives from:
- American Samoa
- Commonwealth of the Northern Mariana Islands
- Federated States of Micronesia
- Guam
- Palau
- Puerto Rico
- Marshall Islands
- U.S. Virgin Islands
- Hawaii Department of Health
- Pacific Island Health Officers Association (PIHOA)
- ASTHO
- CDC
- NOAA
 The first afternoon was focused on the impacts of climate change, preparedness and building resilience. There were great presentations on climate change (Capt. Barry Choy - NOAA), an overview of the tools and programs available from the CDC (Paul Schramm), and issues with vector-borne diseases and mosquitoes (Janet McAllister). The ASTHO grantees then gave some some sobering presentations on current issues people are dealing with in the Mariana Islands, Micronesia and the U.S. Virgin Islands.
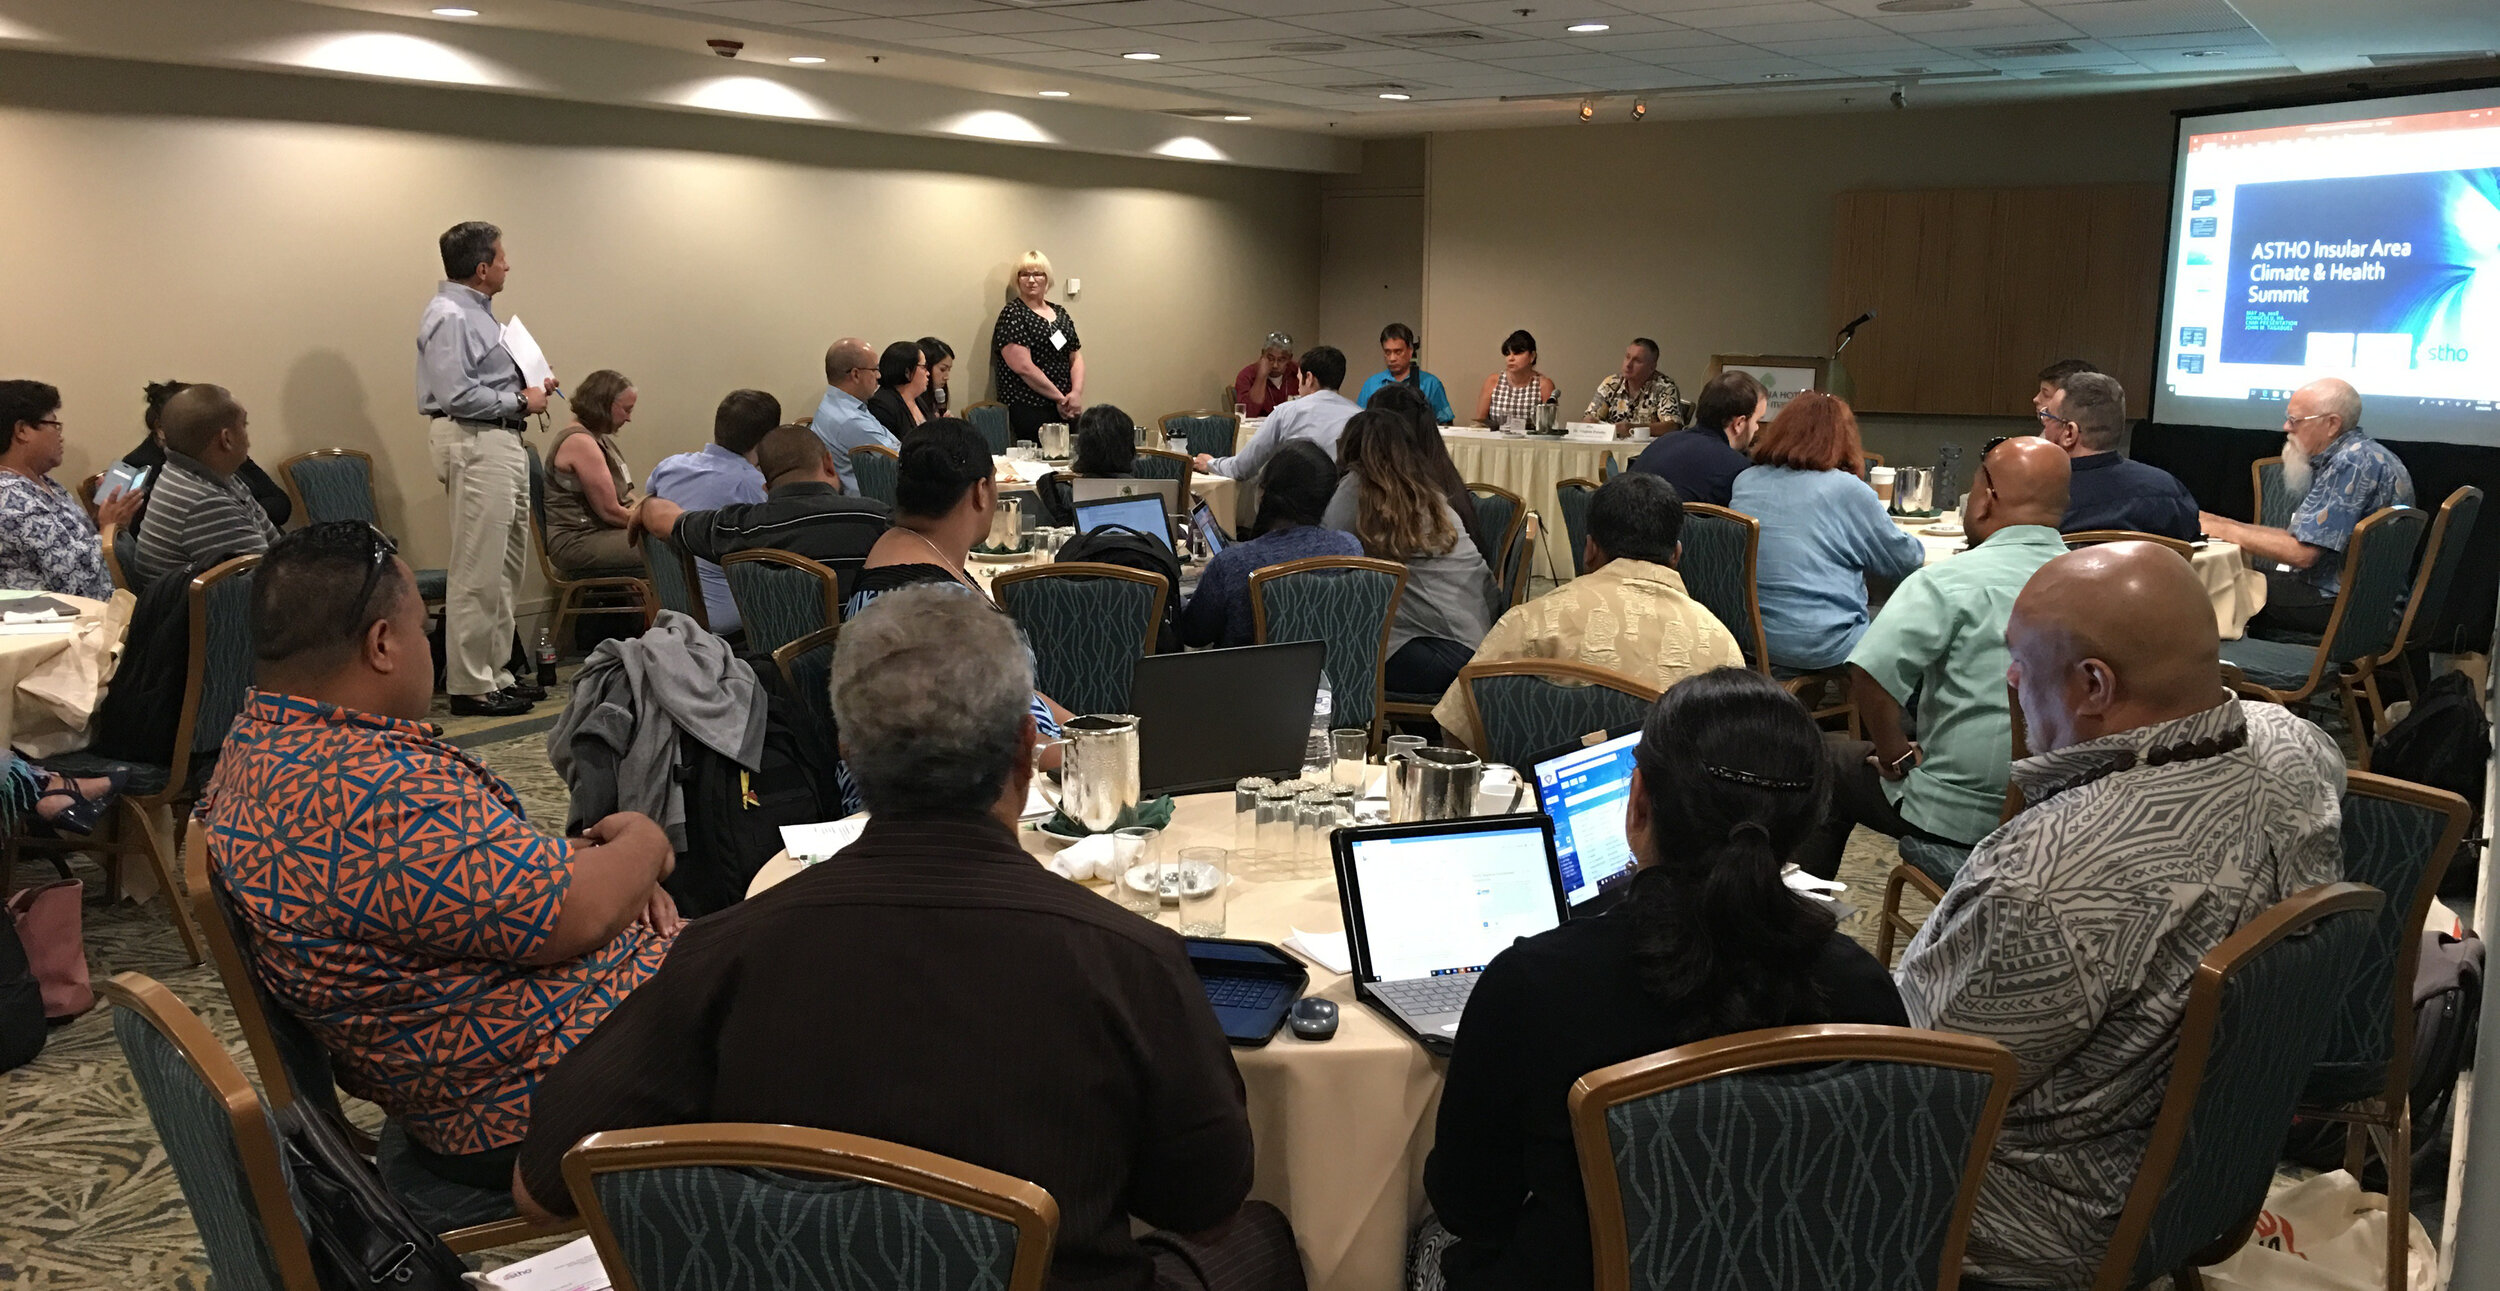 The second day focused more on tools and resources. There were more detailed talks given by the CDC on Technical Assistance for Vector Control and Tools and Resources for Climate and Water Safety. That afternoon we taught a 3.5 hour Community Health Maps Train-the-Trainers workshop to a group of health officials from each territory. We went through the entire CHM workflow: A) how to design a data collection form, B) how to collect data, C) how to make a map in Carto and D) how to bring the data into QGIS.
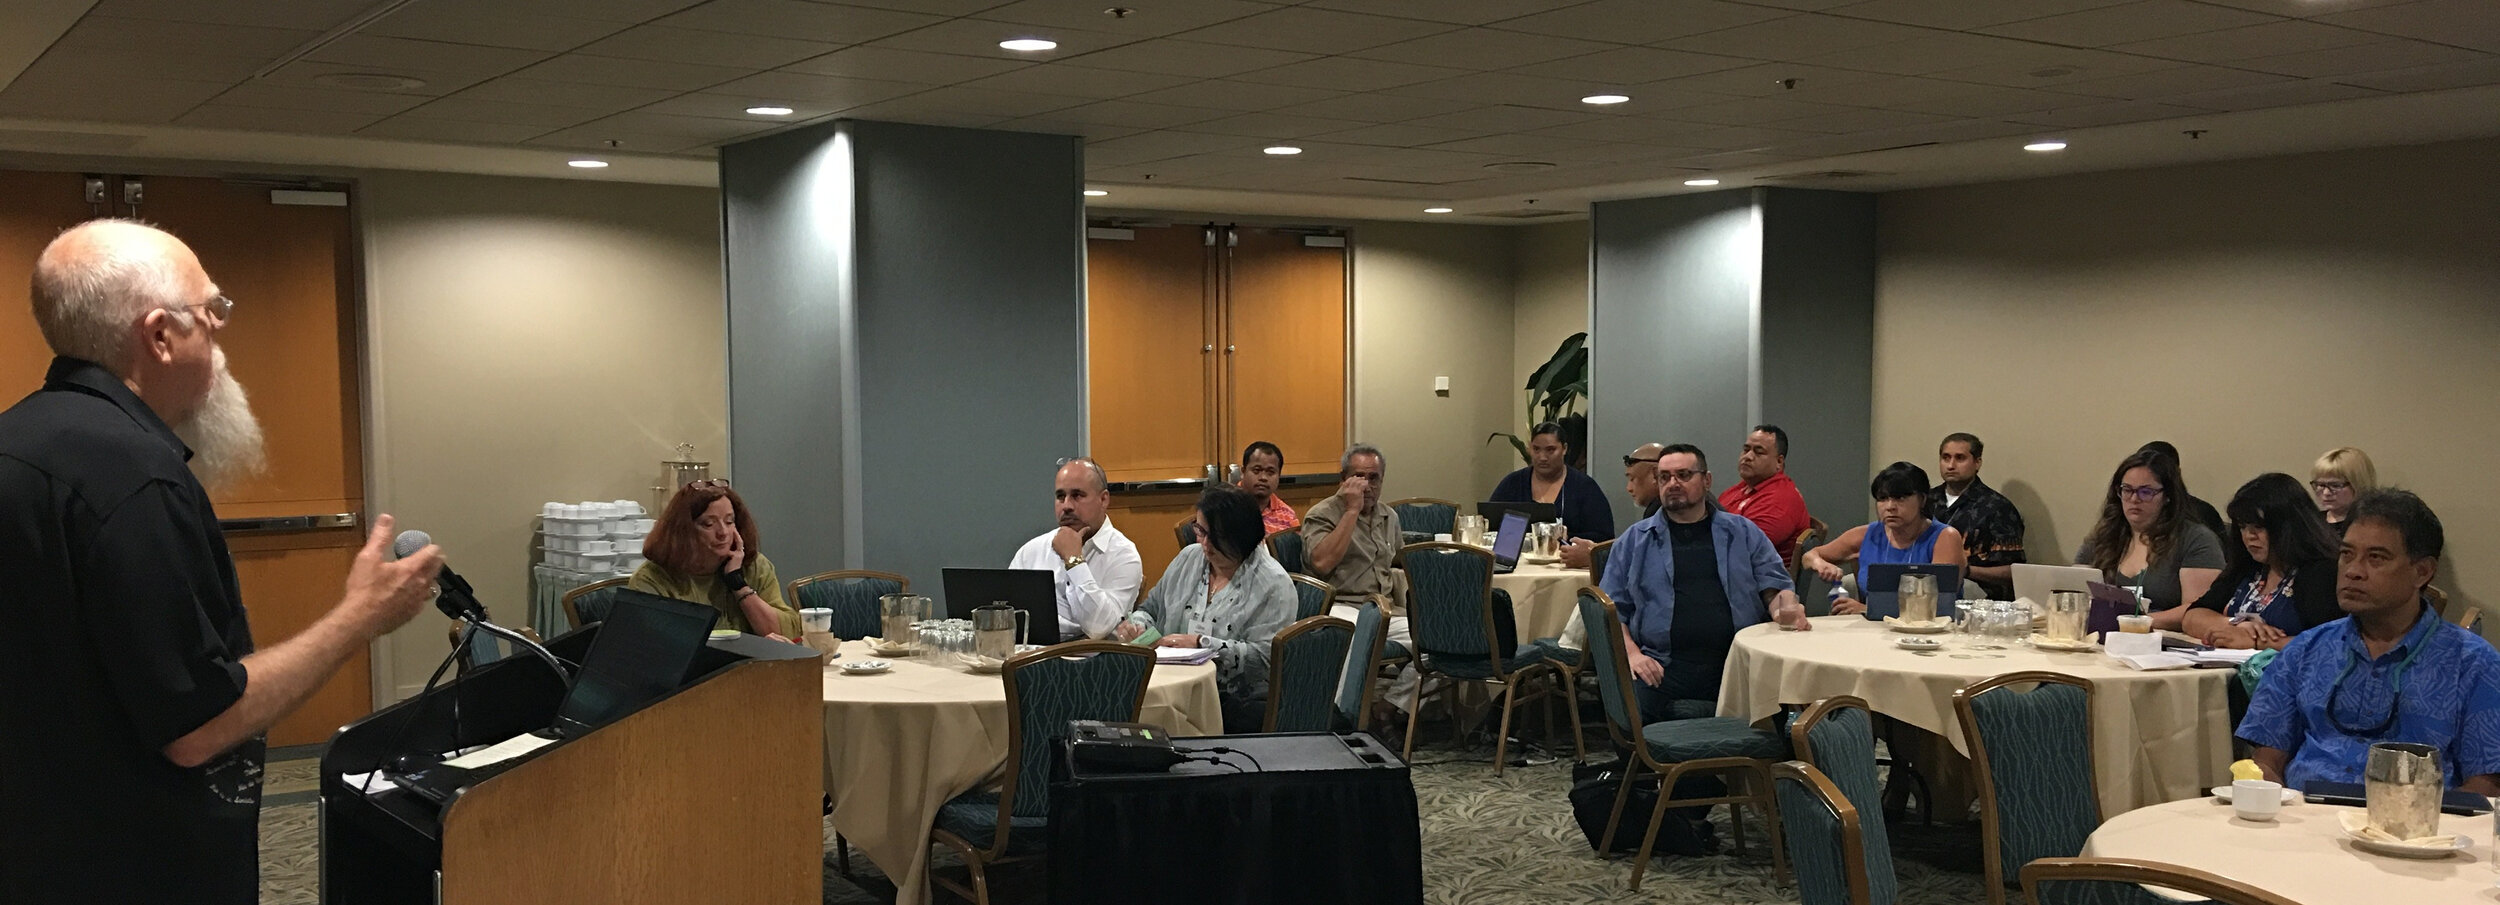 Most of the trainees had little to no GIS training yet instantly knew how mapping could apply to their work and lives. They want to map everything related to hurricane relief, salt water resistant taro farms, infrastructure related to mosquito outbreaks etc. A benefit of having the community do this is that they can be in charge of their own data and it helps build community relationships.Over the three days I heard a lot of side discussions about the usefulness of the free/low cost/open source CHM approach. The cost of proprietary solutions is often a significant barrier to entry into the world of community data collection and mapping. We were gratified to hear some very positive feedback on the workshops and CHM overall during the closing session. There seems to be a lot of potential in CHM helping both U.S. Territories and ASTHO deal with the immediate and long-term health issues related to climate.
Exploring Accessibility and Sustainability at the University of Maryland School of Public Health
By: Jessica Throwe, Sofia Marmolejos, and Colette HochsteinThe National Library of Medicine (NLM) periodically hosts classes to introduce aspiringpublic health professionals to the benefits of using low-cost GIS mapping tools incommunity health research. Recently, NLM interns Jessica Throwe and SofiaMarmolejos, along with NLM Research Assistant Julian Argoti, presented CommunityHealth Maps (CHM) to University of Maryland School of Public Health undergraduateand graduate students.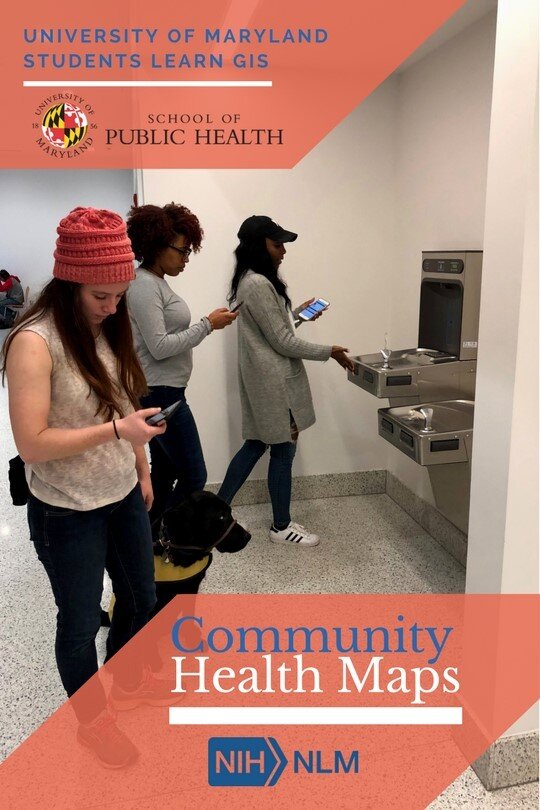 The first presentation was held during a seventy-five minute “Principles of CommunityHealth” class of twenty-five undergraduates. A second was provided to a close-knitclass of ten graduate students studying community health and health literacy.After an introduction to Community Health Maps and to the history and ideology ofGIS/mapping in health research, students used Fulcrum, a mobile data-collectionutility, to create customized forms for collecting data on their mobile phones. Theywere then given thirty minutes to explore the classroom building and collect data on thehealth topic of their choice. The data collected included the geographic location,functionality, and visual appearance of the points of interest.The larger undergraduate class chose a wide variety of subjects, ranging from nearbybus stops and curb ramps to building water fountains and bathroom stall colors. Thesmaller graduate class focused on the school building’s resources, including handsanitizer dispensers, bike racks, compost bins, wheel chair accessibility, and foodofferings. After the data collection and review process, problems with the building’sresources became more apparent, which sparked ideas regarding potentialimprovements.One group noticed that although the school has a new sustainability initiative, of thetwenty locations in the building with trash and recycling bins, only three included acompost bin. Another group found that the hand sanitizer dispensers functionedeverywhere except right outside the gym, a site where this product is in high demand. Athird group discovered the school has a limited number of locations to purchase snacks,and that each of these contains just one vending machine which does not offer healthyfood options.This introduction and exposure to Community Health Maps allowed University ofMaryland undergraduate students to explore the concept of mapping and to makeconnections with community health research. UMD graduate students actively appliedthe CHM processes to discovering geospatial inconsistencies in their built environmentand to brainstorming areas for potential improvements within the building.NLM looks forward to learning how students of varied educational levels will applyCommunity Health Maps to future educational and professional experiences.
CHM Frequently Asked Questions (FAQ's)
There are some questions I am asked regularly when teaching CHM workshops. This blog post addresses those common questions, many of which deal with data security.Can more than one person collect data at the same time with Fulcrum?Yes it is possible add users to your Fulcrum Organization for team based data collection. You set this up from your Fulcrum Settings page. When adding users you can give them a Role as a Standard User, Manager or Owner. You can also grant member access to your individual data collection apps. At that point those users have the access you granted them via their Role in your organization.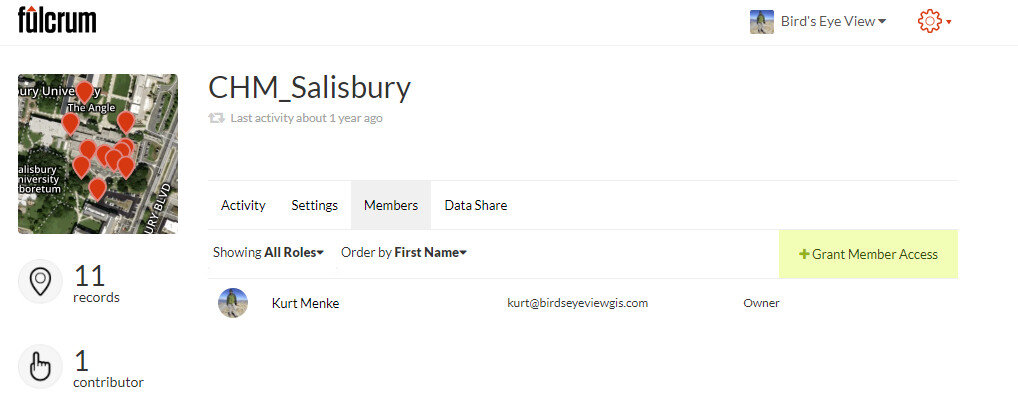 Is there an organizational account for Fulcrum?Not really. An organization can have a single account, but that account needs to be associated with a single email address. So the user name and password would then need to be shared with anyone in the organization. This isn’t the way Fulcrum is set up to work and they prefer users not do this. A better way is to create an account and add users to your organization.The exception to this is Fulcrum Community This is a version of Fulcrum for use in humanitarian relief and disaster situations. You need to apply for a Community license. If granted you can invite any number of data collectors via their email address and they don't have to have accounts. The Community license is free and lasts one year. We used this in Miami last fall and the project is features on the Community flood page (Post-Irma Environment Reporting)!When does Fulcrum record the point? The point is taken when you click "Save". You may have backed up to take a photo. However, when you are ready to save the record, you should have your device as close to the object you want to map as possible.Why do I end up with two datasets from Fulcrum?Photos you take with your mobile device are geotagged. When you download your data from your Fulcrum account you may end up with two datasets. One is based on your data collection app. The other is based on the coordinates embedded in the photos you took. For example, if you backed up to take a photo of a bench and then saved your point standing over the bench, you will be able to see both where the photo was taken and where the bench is located.How accurate are the points collected with my mobile device?There are a number of things that can affect data accuracy such as the quality of the GPS receiver, current satellite configuration, limited sky view, proximity to large buildings, tree cover etc. There is a two part blog post about this you can read here.One thing to keep in mind is that when you are using Fulcrum to collect field data, the point is taken when you click "Save". You may have backed up to take a photo. However, when you are ready to save the record you should have your device as close to the object you are mapping as possible. It is also possible to edit and correct point locations after the fact via Fulcrum, Carto or QGIS.Is my data secure on QGIS?QGIS is simply a piece of desktop software, not a platform for data storage. With QGIS you can map and analyze your spatial data. Data security has more to do with the security of your computer network and your system for backing data up. QGIS has no more bearing on data security than any other piece of desktop software such as ArcGIS or Microsoft Excel.Does Fulcrum have HIPAA compliant security?No. Fulcrum does employ 256-bit SSL connections to keep data safe as it travels to and from your cloud account. As they say, this is the same level of security provided by online banking and e-commerce sites. However, The HIPAA Security Rule requires implementation of three types of safeguards: 1) administrative, 2) physical and 3) technical. So Fulcrum is not HIPAA compliant. However, if they hear from enough users that this is a crucial feature they will likely work on it!What is open source?It is both a software license and a way to create software. There are two main types of software licenses: proprietary and open source. Proprietary licenses tend to restrict your usage of the software in some way:
- number of computers you can install the software on
- the number of features available
- the time period you can use the software (e.g., a year)
On the other hand open sources licenses tend to grant users rights and freedoms around using the software. For example with QGIS, the license grants you the freedom to install the software on any number of computers and access to all the features forever. The software also has no monetary cost, it’s free.Open source is also a software development strategy. The developers work in an open and collaborative way. Many developers feel this is a more efficient way to create software. In an open source project all the source code is available. This last point may not be a hugely important consideration for many. However, access to the source code means that if you have the capability, you can study how the software works and improve it. Because of this feature open source software is not a “black box.” Additionally, even if you cannot program a new feature yourself, you can hire someone who can. Since you are not paying any licensing fees this is often a very viable option.
If you have any other questions about Community Health Maps email them to Kurt Menke and he will try to answer them and add them to this post!
QGIS 3 Released!
On February 23rd QGIS 3 was formally released. Since then the developers have been working on completing installers for Windows, Mac and Linux. As of yesterday the software is ready to be installed on every operating system! To install it you can visit the QGIS Download page.QGIS VERSIONSQGIS always has two main versions available. There is the long-term release, which is the most stable because it is supported for one calendar year. In addition there is always a latest release. QGIS 3 falls into this latter category, it is the latest release. At the moment the long-term release is version 2.18. The latest release is still considered stable, but a new one comes out every 4 months.WHICH VERSION TO CHOOSE?If you want to have one version of QGIS without having to worry about updates, use the long-term release (2.18). If you want to experience all the new features that come with version 3 you will want the latest release (3.0). As mentioned last month, version 3 is a major new release with a lot of changes and new features.On Windows machines you can have both. You can easily install both versions of QGIS side by side with no conflicts by using the OSGeo4W Network Installer. On Mac and Linux machines you can only have one version, so you need to choose.QGIS 3QGIS 3 is fast, stable and feature rich. The main issue for many users is that not all Plugins have yet to be ported to QGIS 3. This is because this responsibility falls onto the individual plugin authors. With that said, at last count there were already 117 plugins available for version 3.
Fulcrum Community
Last year Fulcrum rolled out a new service named Community. They describe it as a, "no cost, short term crowdsourced data collection solution for qualified humanitarian projects." It works like Fulcrum, but you need to apply for a license. The application form is short and is right on the Community home page. In the application you need to describe your purpose and how long you will be collecting data. You also need to provide a project description. If approved you can invite any number of data collectors via email to share your App (data collection form). It is generally aimed at humanitarian agencies, non-profits, or government agencies. They restrict commercial use of this service. We used this last fall during King Tide data collection in Miami and it was a big success. In fact there are four main categories highlighted on the Fulcrum Community page: Hurricane, Tornado, Flood and Fire. If you click on Flood, the King Tide project is the first in the list. Clicking on it brings up a map with the data collected.
 One caveat is that the data collected falls into the public domain and can be downloaded freely by anyone. This is possible because the data are anonymized, meaning any private information is scrubbed. The data remain available for viewing and download after the event ends.
 It won't be appropriate unless there is some sort of disaster relief or environmental issue that demands it, but it is another tool to keep in your Community Health Maps toolkit!
QGIS 3.0 To Be Released in February!
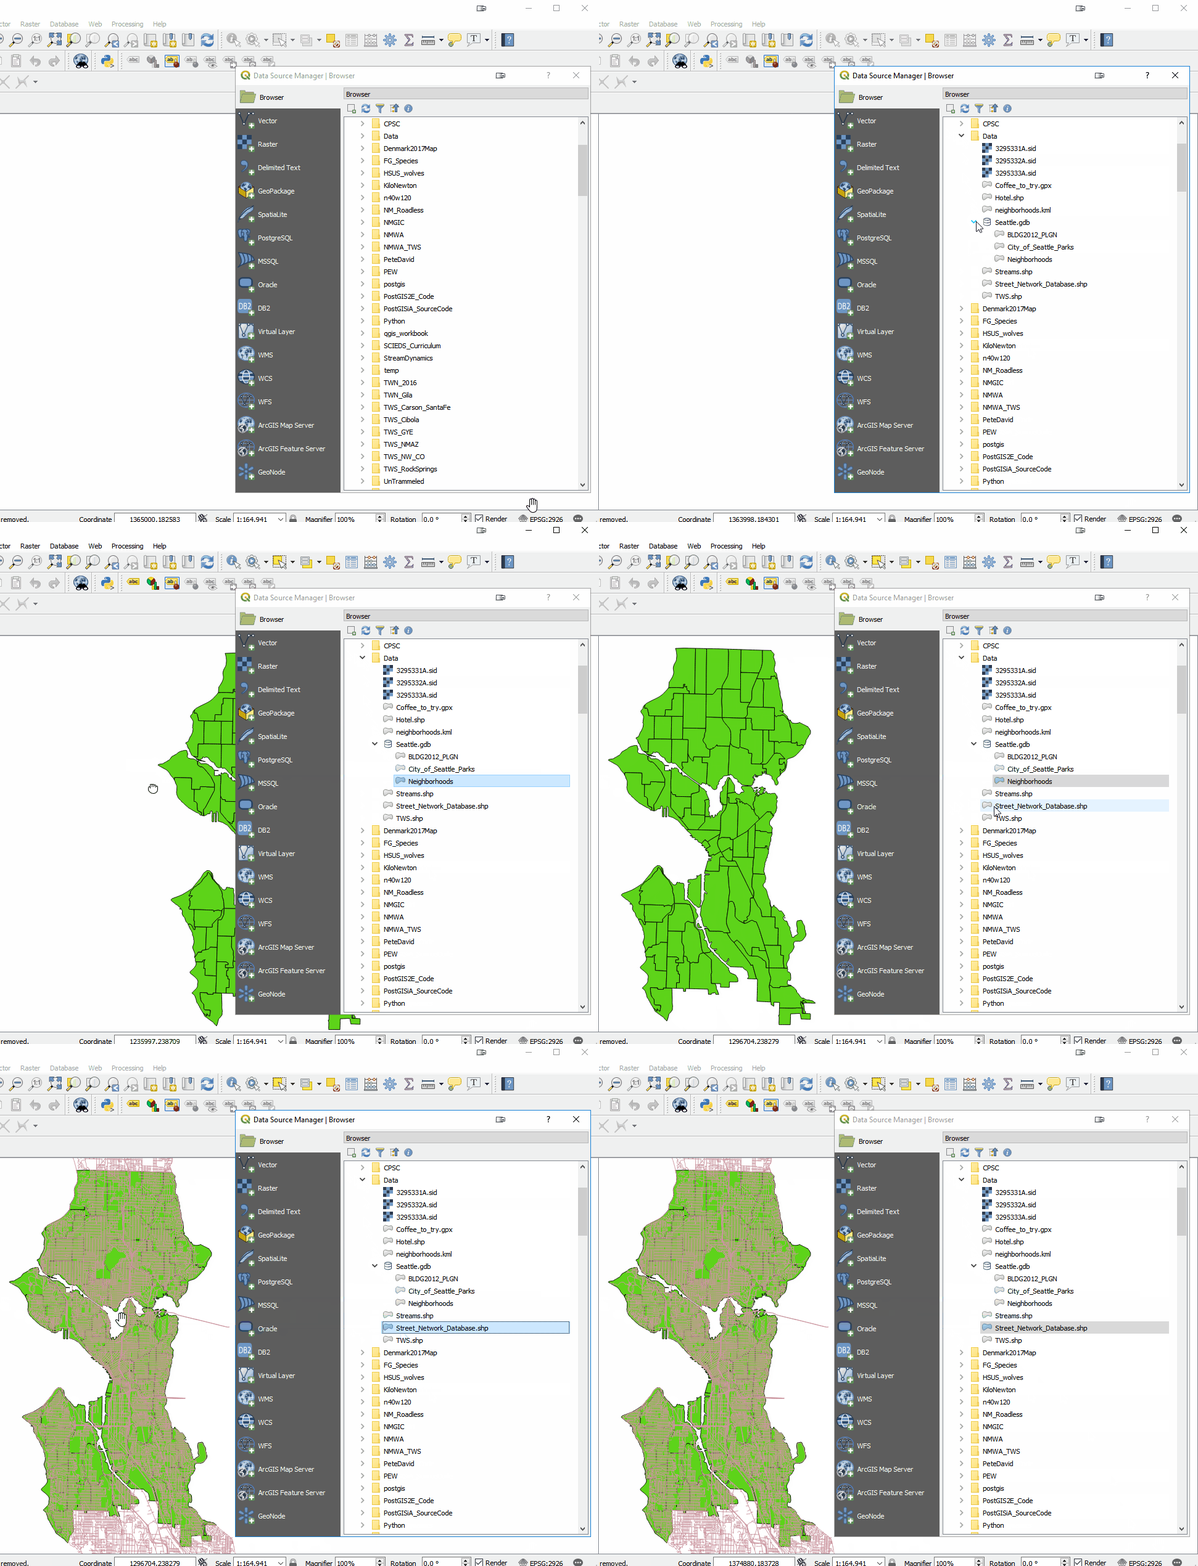
It's an exciting month for QGIS. On February 23rd there will be a major new release of QGIS: QGIS 3.0. We haven't had a major new release since 2013 when 2.0 came out. The development team has been working on this for a solid year. This version will be faster and have a lot of new features. Kurt Menke has been closely following the development of QGIS3. Over the last few months he has been experimenting with the pre-release version (v2.99). This post will cover some of the highlights that will be useful to Community Health Mappers. In general QGIS is going to be faster, more powerful and more efficient to work with. First off QGIS 3.0 comes with a new logo! Overall the look of QGIS is very similar. There are the Layers and Browser panels to the left, a Map Canvas and lots of buttons and menus above. However, upon closer inspection there are a lot of very useful changes. For example, instead of there being a row of add data buttons down the left side, there is now a Unified Data Source Manager button which opens up a browser.
 The Unified Data Source Manager can be used to access the myriad of data formats QGIS supports and add them to QGIS. This includes vector, raster, database, web services etc. You can even browse within Esri File Geodatabases. Any GIS layer you are interested in, can then be added to QGIS by dragging and dropping it onto the map.
  The Processing toolbox was completely redesigned and many tools were rewritten. This means many are now faster, more flexible and stable. There are also many new tools that didn't exist in QGIS v2.x. Additionally processing tasks also now run in the background. This means you don't have to stop working while a tool runs! Yet another new processing feature is that layers in different projections will automatically be reprojected, so there is no need to reproject beforehand.
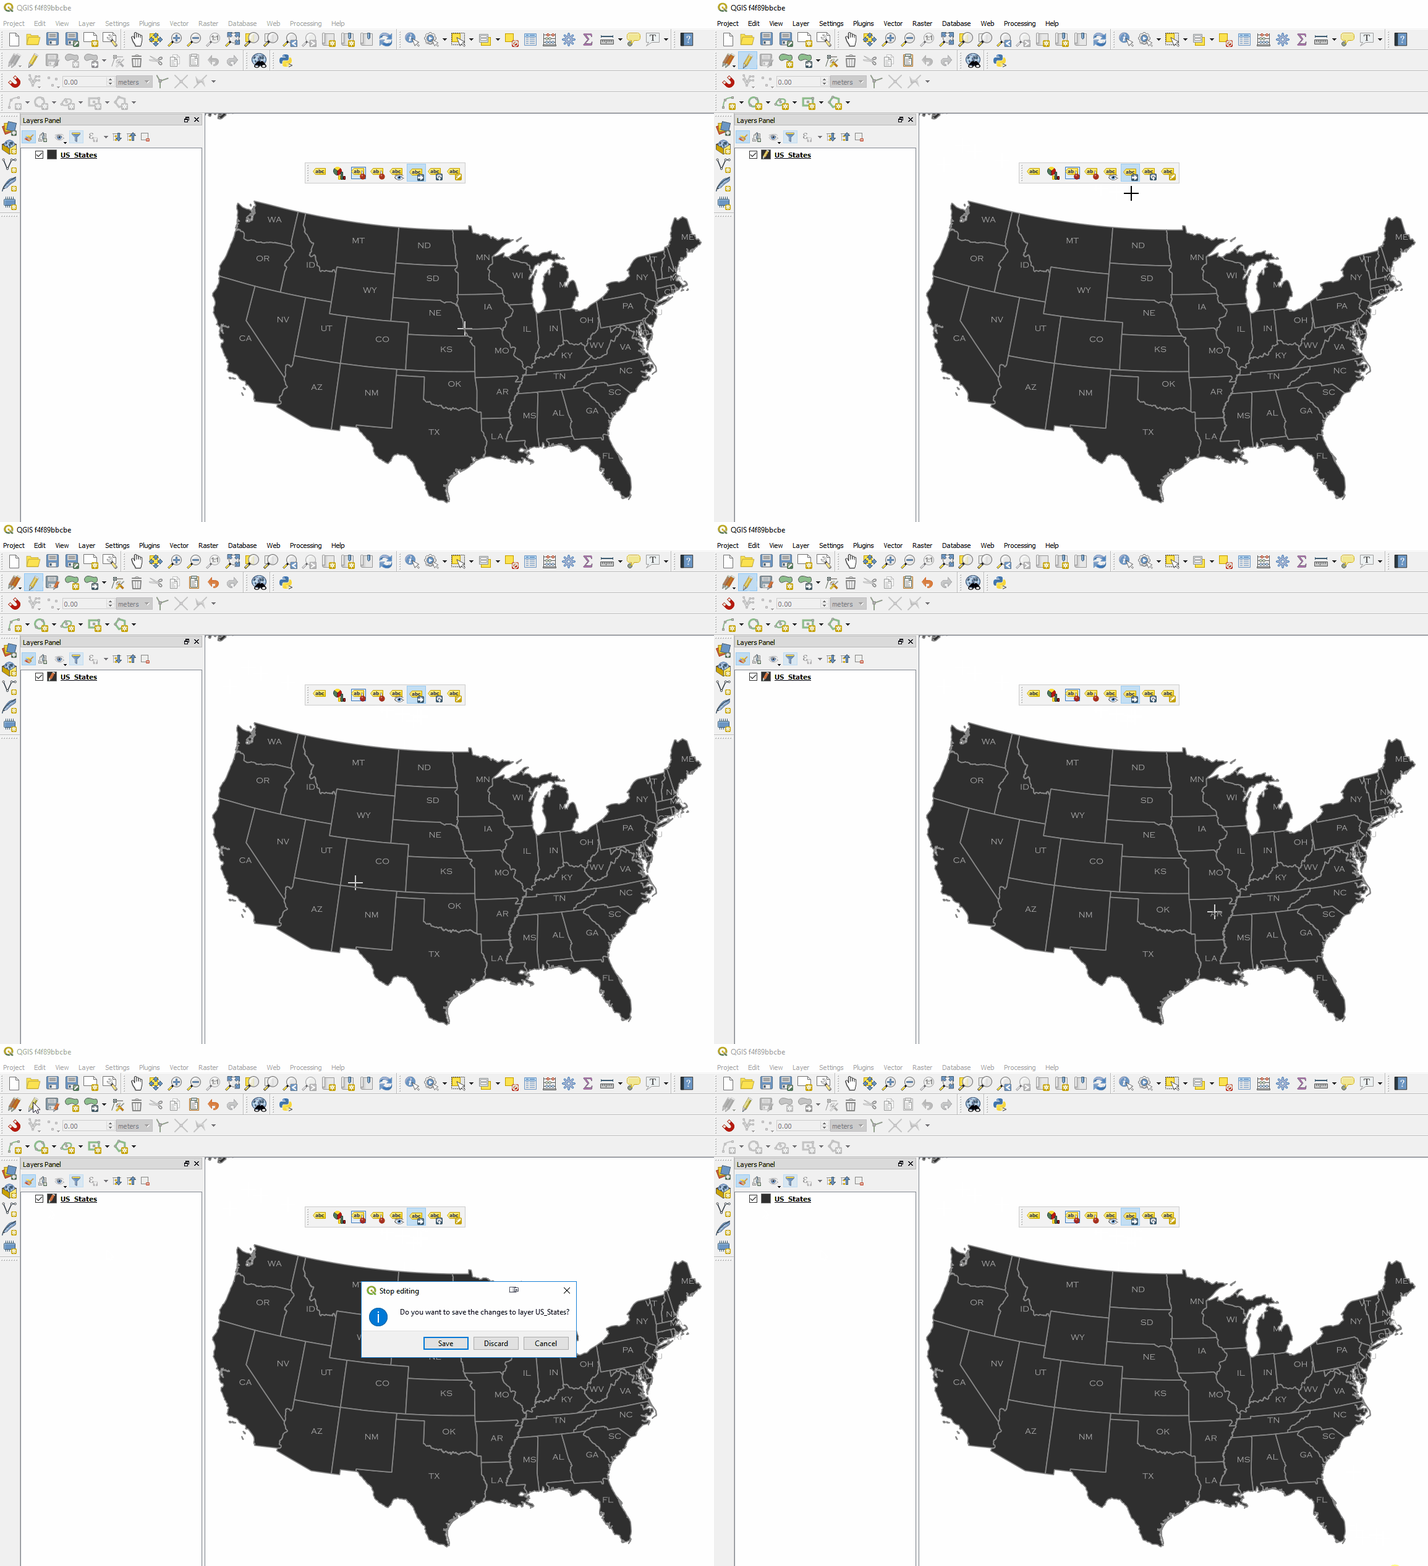
 Map Labels: It now much easier to edit labels. Previously you had to set up attribute columns and set those as data defined overrides. If you don't know what all that means, it's OK. Now all you have to do is simply put the layer into edit mode and edit labels with tools on the Label toolbar. Maps also now redraw more quickly due to cached label renderers.
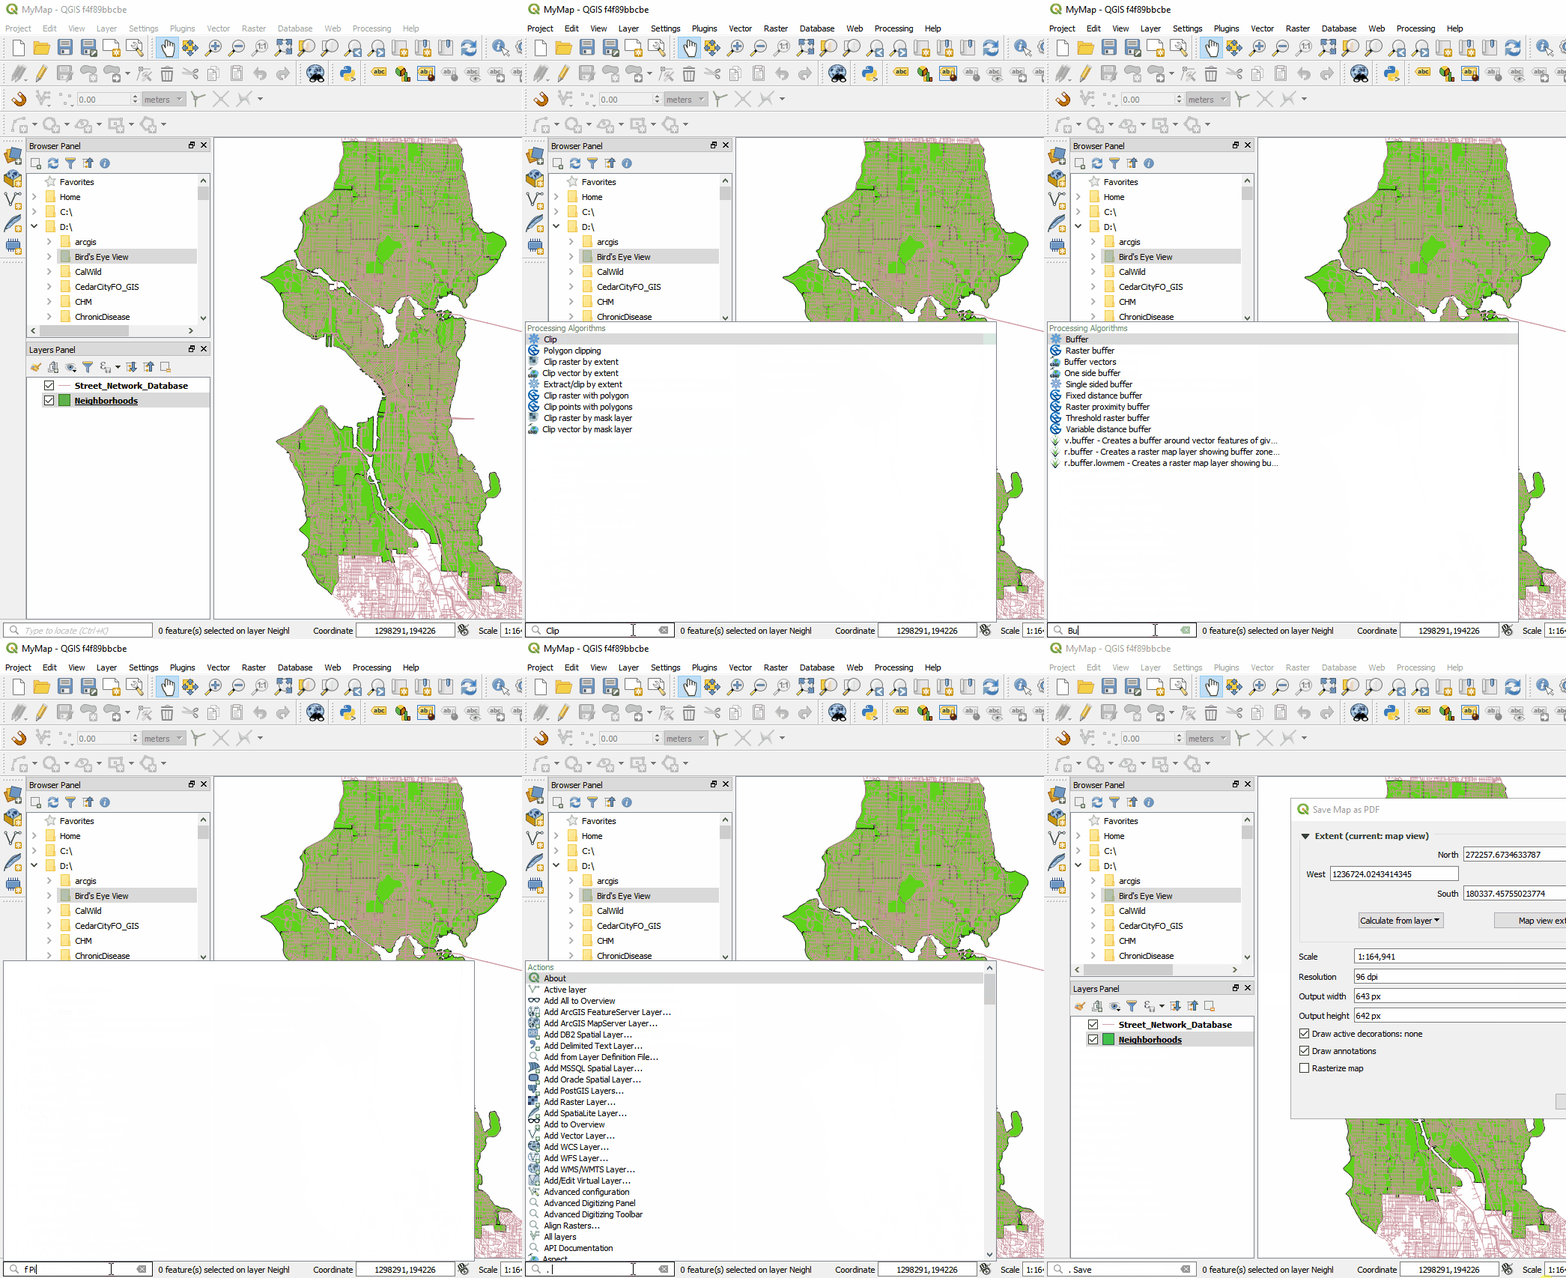
 There is now a Search bar in the lower left corner that can be used to search for map layers, features and processing tools. This makes finding things in QGIS quick and easy.
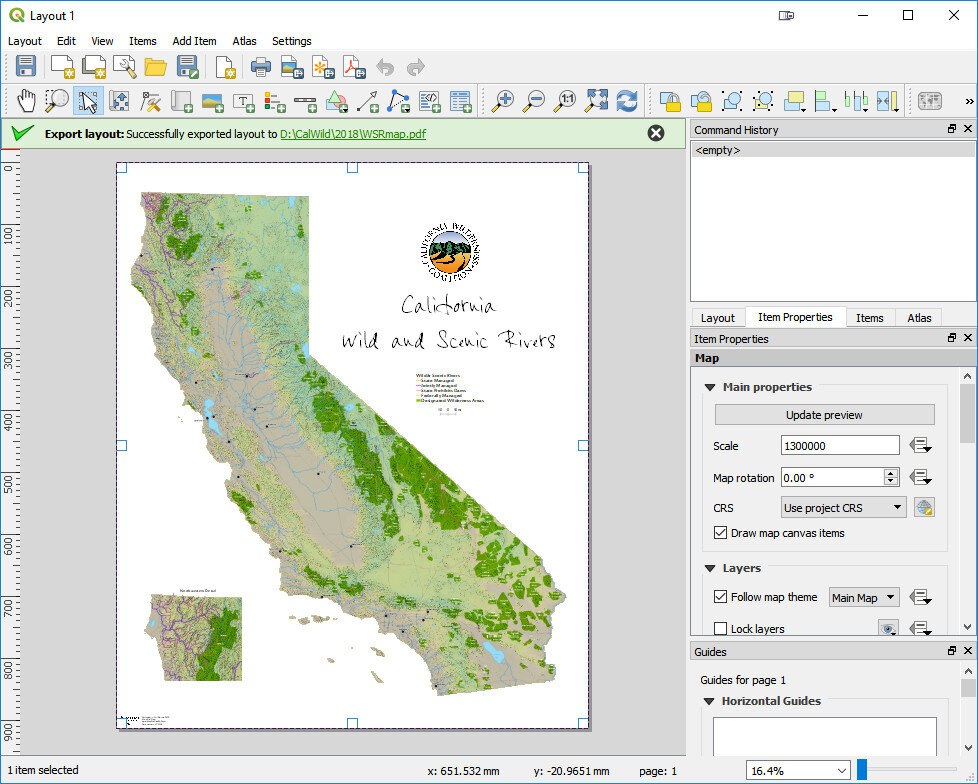
 The QGIS print composer was completely redesigned. They are now referred to as Layouts. Map insets can now be in a different map projection than the main map. There is a new and improved system of guides which include settings in any unit of measurement you could want (mm, cm, m, in, ft, pt, pica, pix). There are new controls for choosing fonts which include recently used fonts. When you export a map, a link to the folder shows up making it easy to track down the exported map.
 Other notable enhancements include:
- A fully integrated 3D environment
- Editing improvements including: a) widgets for layer attributes, b) CAD style digitizing tools that allow you to create perfect rectangles, circles, ellipses etc. and c) a new node editing tool with a lot of behavior improvements
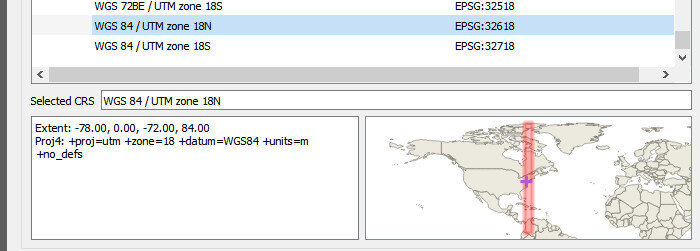
- Previews of where each map projection can be used. This will be a big help for beginners!
- User profiles that allow you to set up QGIS with different panels, plugins and toolbars for different projects or uses.
- Improved hidpi/retina support
Where do you go from here?
- 2.18 will be considered the supported long-term release (LTR) through June.
- When 3.0 is released in a few weeks it will be considered the latest stable version.
- 3.2 will become the LTR in June when it is released.
- Starting on February 23rd you will be able to download and install it. Remember you can have multiple versions installed with no conflicts. I encourage you to install it in a few weeks and begin to explore it! You won't want to go back.
NOTE: QGIS 3 projects won't be entirely backwards compatible with QGIS 2.x. So if you are going to open an existing project in QGIS 3, be sure to click Project -->Save As and save a new verion of the project for use in QGIS3.


