Data Collection

A Pair of Community Health Maps Workshops at the ASTHO Climate and Health Summit

During the last week of May the Community Health Maps team (Janice Kelly, John Scott and Kurt Menke) traveled to Honolulu to participate in the Association of State and Territorial Health Officials (ASTHO) Insular Area Climate and Health Summit. There were representatives from:

  • American Samoa
  • Commonwealth of the Northern Mariana Islands
  • Federated States of Micronesia
  • Guam
  • Palau
  • Puerto Rico
  • Marshall Islands
  • U.S. Virgin Islands
  • Hawaii Department of Health
  • Pacific Island Health Officers Association (PIHOA)
  • ASTHO
  • CDC
  • NOAA
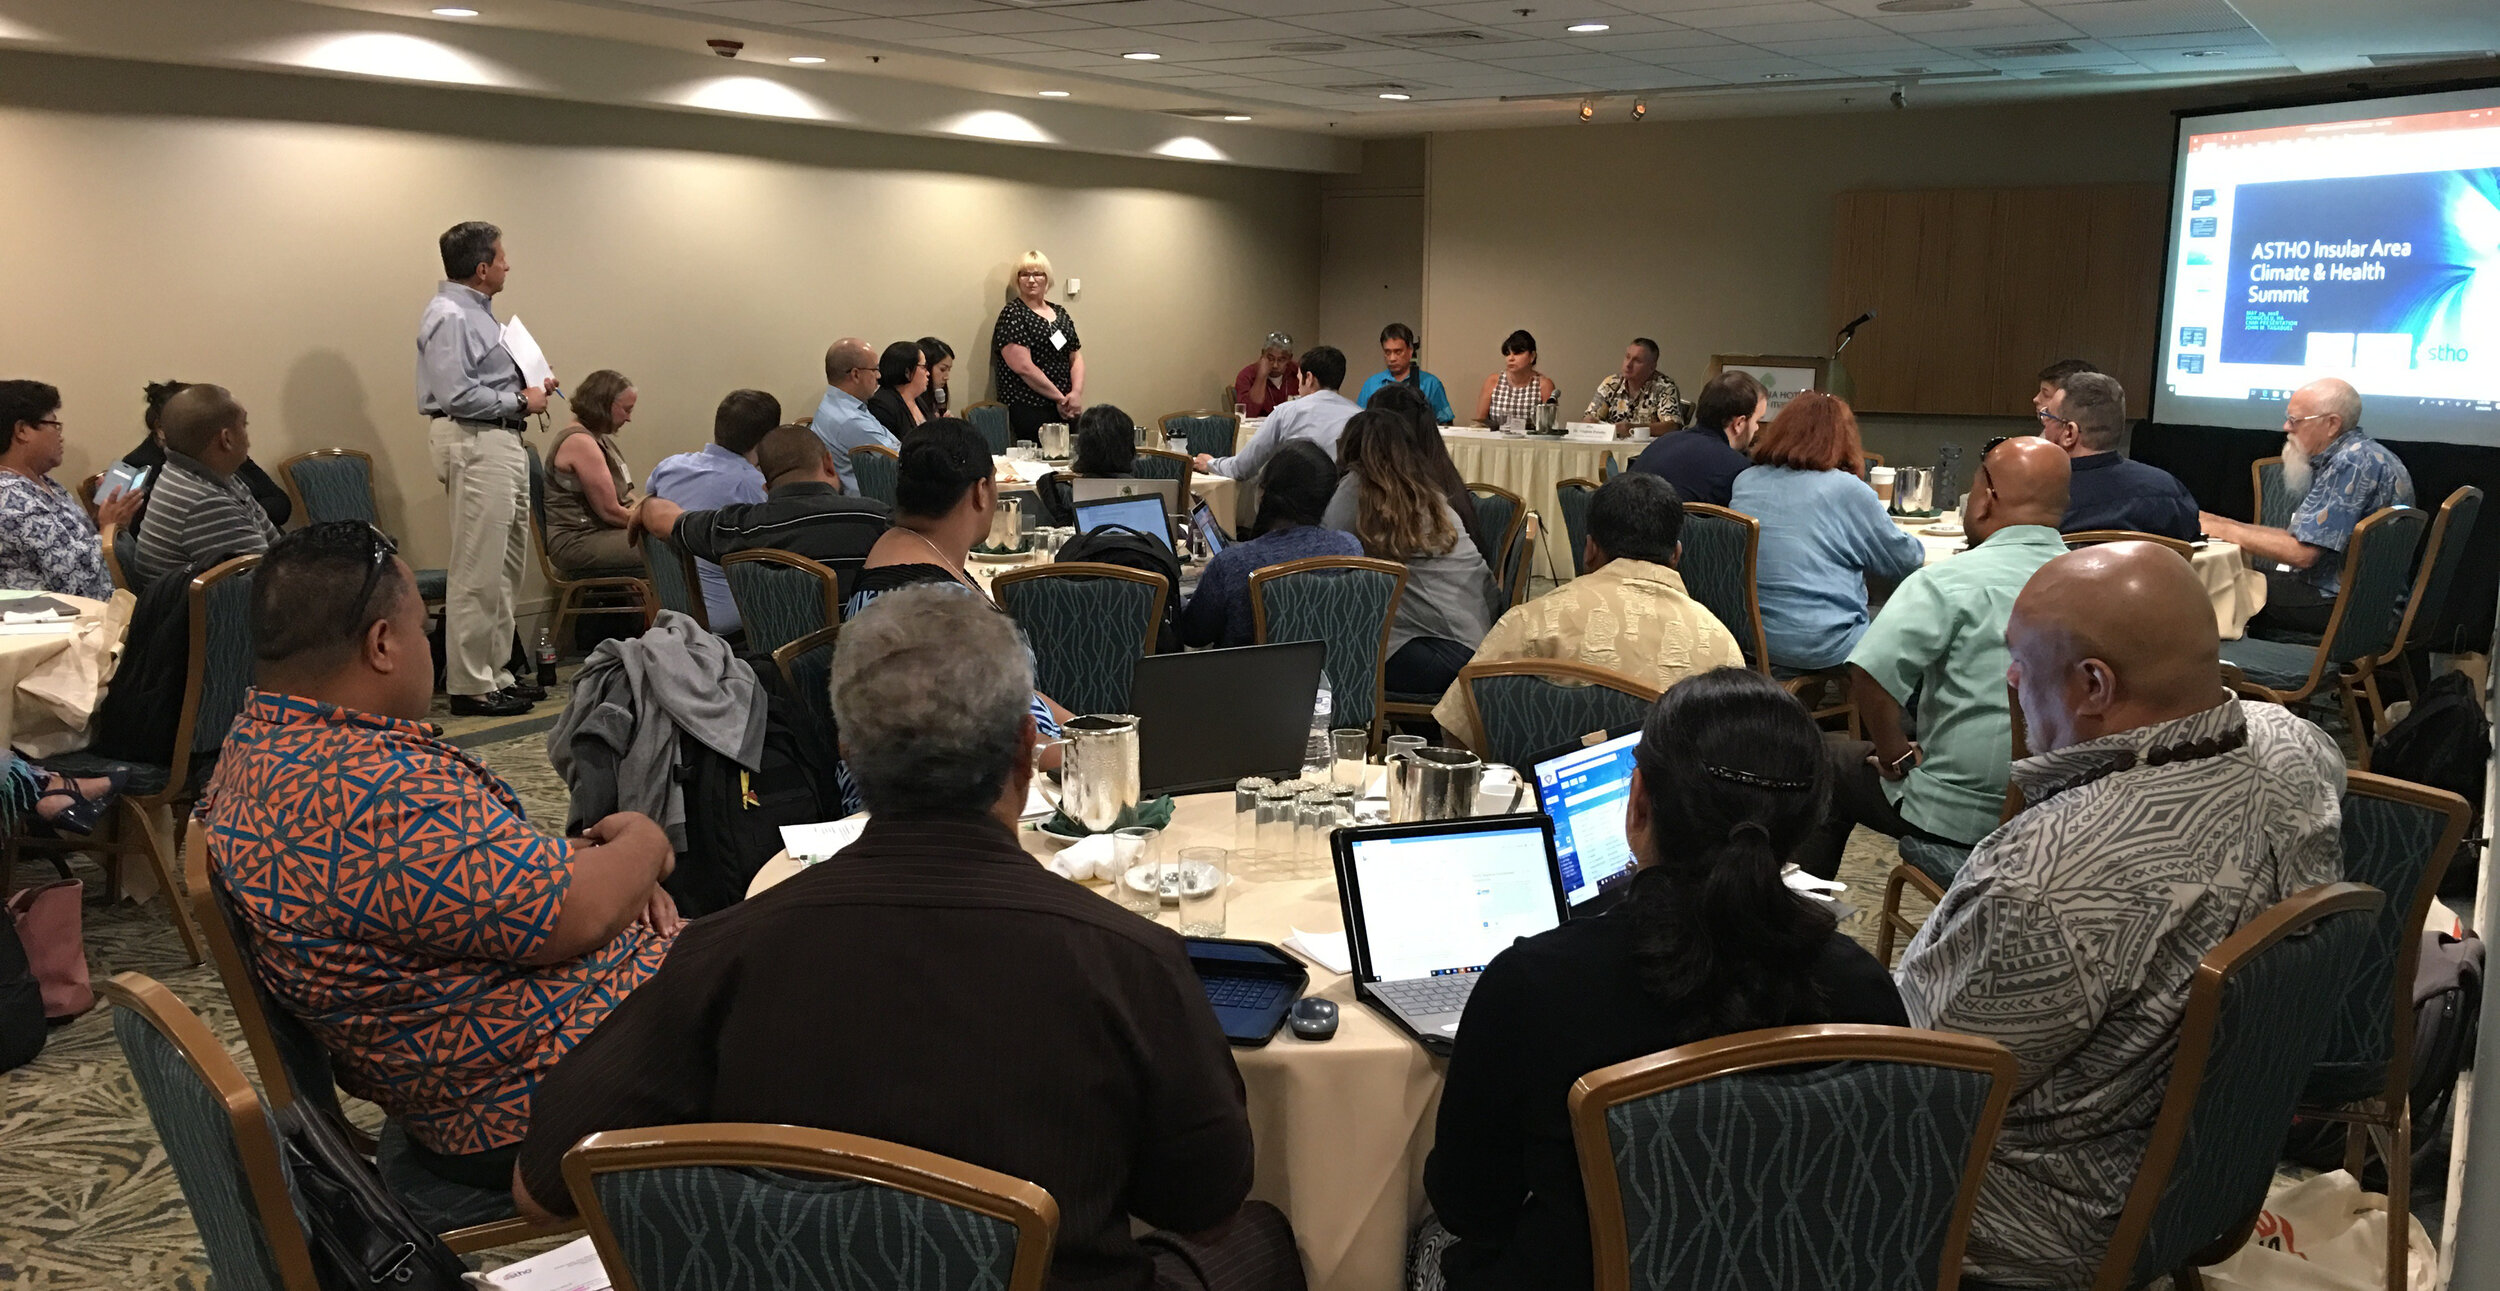
7516756736_IMG_4910The first afternoon was focused on the impacts of climate change, preparedness and building resilience. There were great presentations on climate change (Capt. Barry Choy - NOAA), an overview of the tools and programs available from the CDC (Paul Schramm), and issues with vector-borne diseases and mosquitoes (Janet McAllister).  The ASTHO grantees then gave some some sobering presentations on current issues people are dealing with in the Mariana Islands, Micronesia and the U.S. Virgin Islands.img-7852.jpgThe second day focused more on tools and resources. There were more detailed talks given by the CDC on Technical Assistance for Vector Control and Tools and Resources for Climate and Water Safety. That afternoon we taught a 3.5 hour Community Health Maps Train-the-Trainers workshop to a group of health officials from each territory.  We went through the entire CHM workflow: A) how to design a data collection form, B) how to collect data, C) how to make a map in Carto and D) how to bring the data into QGIS.
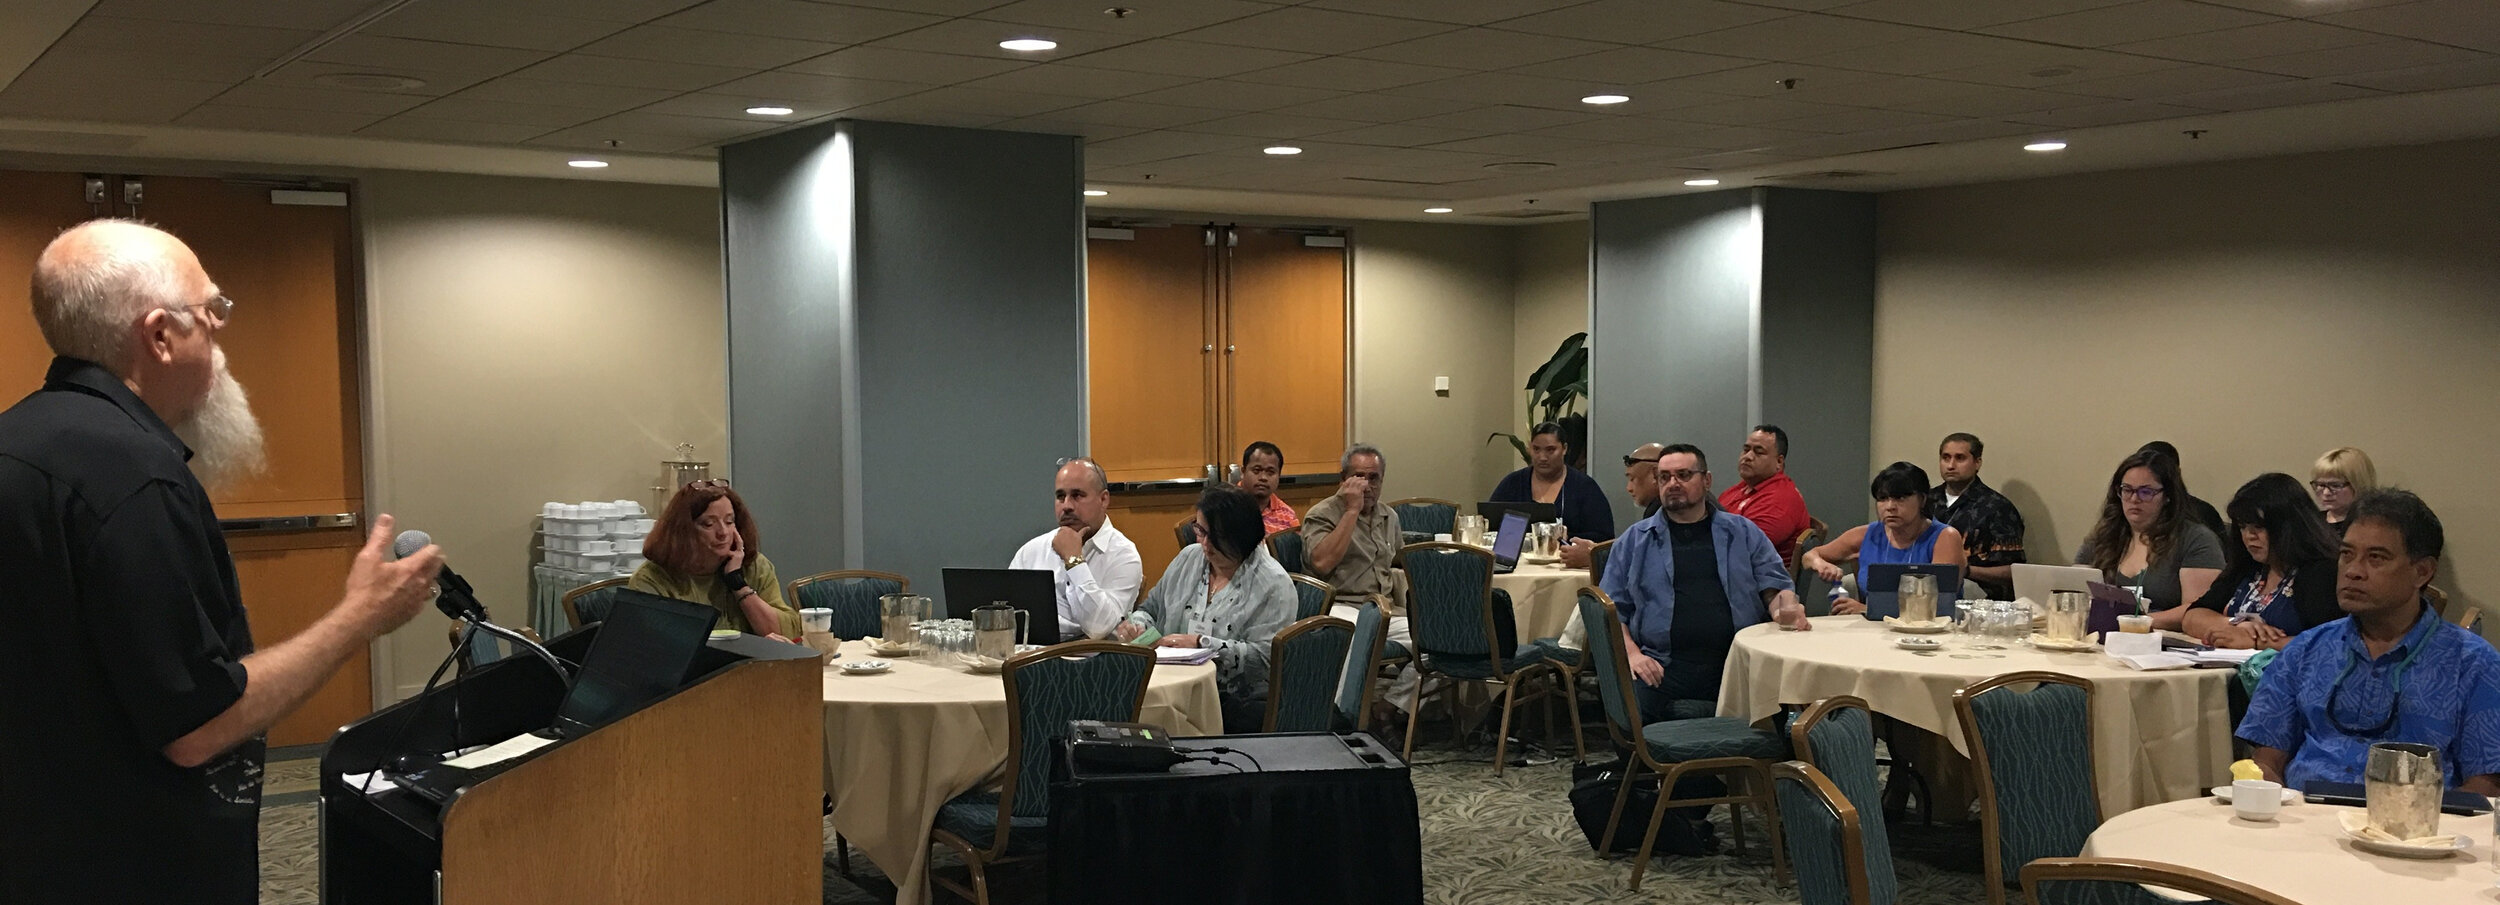
The last morning we taught a second Community Health Maps workshop open to everyone. We had about 30 attendees and again went through the entire CHM workflow.img-7880.jpgMost of the trainees had little to no GIS training yet instantly knew how mapping could apply to their work and lives. They want to map everything related to hurricane relief, salt water resistant taro farms, infrastructure related to mosquito outbreaks etc. A benefit of having the community do this is that they can be in charge of their own data and it helps build community relationships.Over the three days I heard a lot of side discussions about the usefulness of the free/low cost/open source CHM approach. The cost of proprietary solutions is often a significant barrier to entry into the world of community data collection and mapping. We were gratified to hear some very positive feedback on the workshops and CHM overall during the closing session. There seems to be a lot of potential in CHM helping both U.S. Territories and ASTHO deal with the immediate and long-term health issues related to climate.

Exploring Accessibility and Sustainability at the University of Maryland School of Public Health

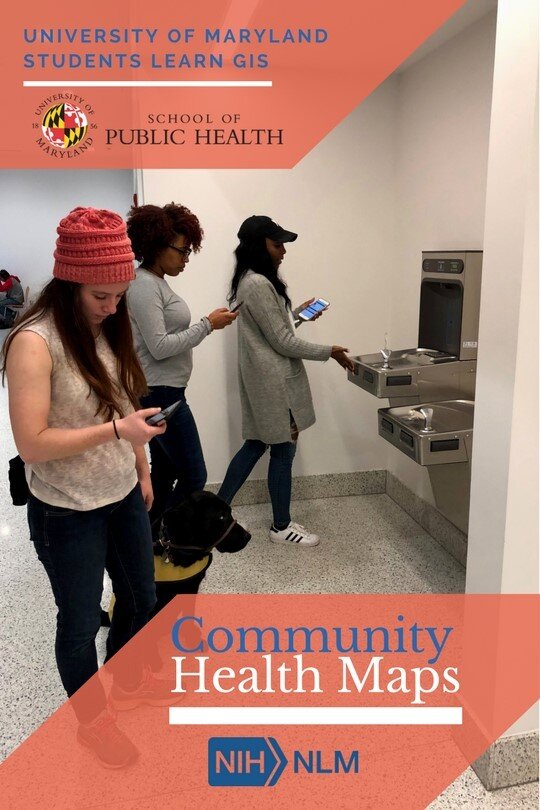
By: Jessica Throwe, Sofia Marmolejos, and Colette HochsteinThe National Library of Medicine (NLM) periodically hosts classes to introduce aspiringpublic health professionals to the benefits of using low-cost GIS mapping tools incommunity health research. Recently, NLM interns Jessica Throwe and SofiaMarmolejos, along with NLM Research Assistant Julian Argoti, presented CommunityHealth Maps (CHM) to University of Maryland School of Public Health undergraduateand graduate students.UMDEventThe first presentation was held during a seventy-five minute “Principles of CommunityHealth” class of twenty-five undergraduates. A second was provided to a close-knitclass of ten graduate students studying community health and health literacy.After an introduction to Community Health Maps and to the history and ideology ofGIS/mapping in health research, students used Fulcrum, a mobile data-collectionutility, to create customized forms for collecting data on their mobile phones. Theywere then given thirty minutes to explore the classroom building and collect data on thehealth topic of their choice. The data collected included the geographic location,functionality, and visual appearance of the points of interest.The larger undergraduate class chose a wide variety of subjects, ranging from nearbybus stops and curb ramps to building water fountains and bathroom stall colors. Thesmaller graduate class focused on the school building’s resources, including handsanitizer dispensers, bike racks, compost bins, wheel chair accessibility, and foodofferings. After the data collection and review process, problems with the building’sresources became more apparent, which sparked ideas regarding potentialimprovements.One group noticed that although the school has a new sustainability initiative, of thetwenty locations in the building with trash and recycling bins, only three included acompost bin. Another group found that the hand sanitizer dispensers functionedeverywhere except right outside the gym, a site where this product is in high demand. Athird group discovered the school has a limited number of locations to purchase snacks,and that each of these contains just one vending machine which does not offer healthyfood options.This introduction and exposure to Community Health Maps allowed University ofMaryland undergraduate students to explore the concept of mapping and to makeconnections with community health research. UMD graduate students actively appliedthe CHM processes to discovering geospatial inconsistencies in their built environmentand to brainstorming areas for potential improvements within the building.NLM looks forward to learning how students of varied educational levels will applyCommunity Health Maps to future educational and professional experiences.

Fulcrum Community

Last year Fulcrum rolled out a new service named Community. They describe it as a, "no cost, short term crowdsourced data collection solution for qualified humanitarian projects." It works like Fulcrum, but you need to apply for a license. The application form is short and is right on the Community home page. In the application you need to describe your purpose and how long you will be collecting data. You also need to provide a project description. If approved you can invite any number of data collectors via email to share  your App (data collection form).  It is generally aimed at humanitarian agencies, non-profits, or government agencies. They restrict commercial use of this service.2018-03-01_153006We used this last fall during King Tide data collection in Miami and it was a big success. In fact there are four main categories highlighted on the Fulcrum Community page: Hurricane, Tornado, Flood and Fire. If you click on Flood, the King Tide project is the first in the list. Clicking on it brings up a map with the data collected.2018-03-01_152857One caveat is that the data collected falls into the public domain and can be downloaded freely by anyone. This is possible because the data are anonymized, meaning any private information is scrubbed. The data remain available for viewing and download after the event ends.2018-03-01_153348It won't be appropriate unless there is some sort of disaster relief or environmental issue that demands it, but it is another tool to keep in your Community Health Maps toolkit!
Students teach students during University of Maryland CHM presentation

nlm21.jpg

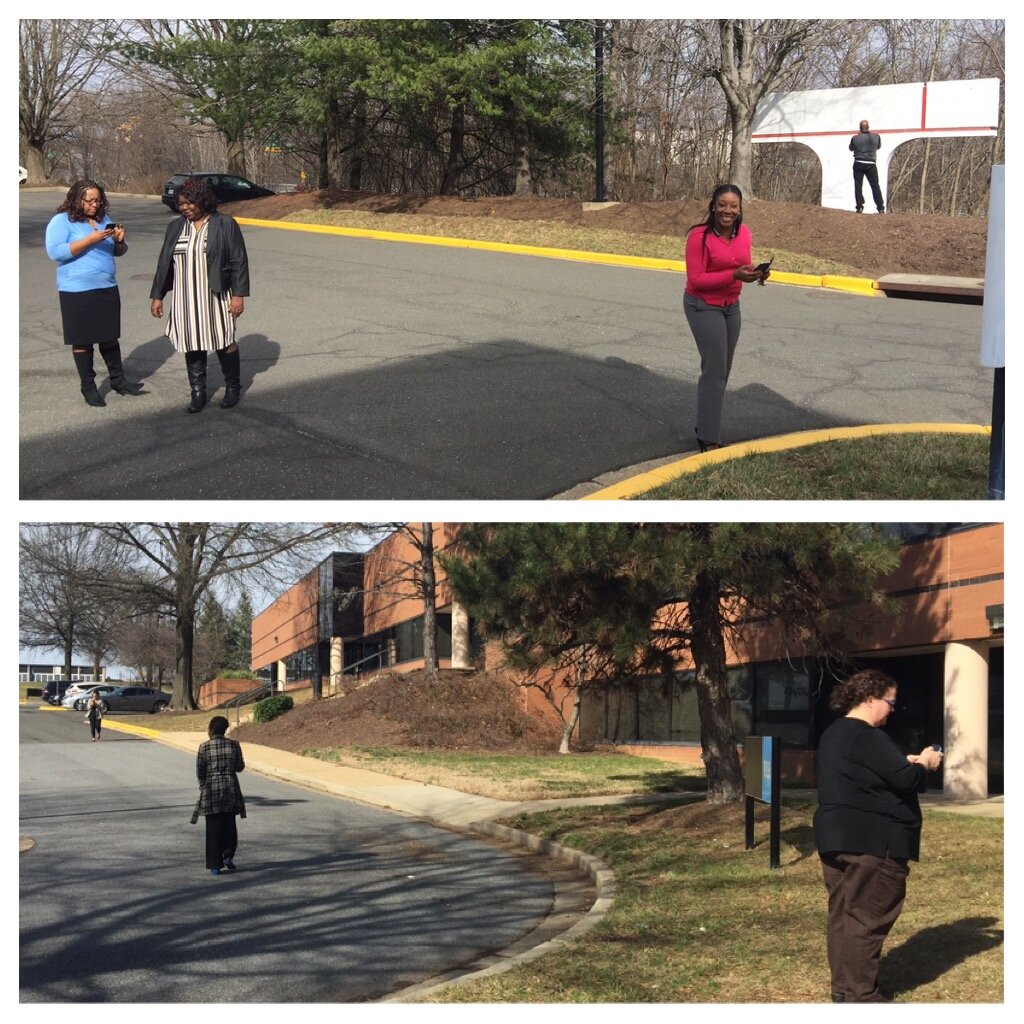
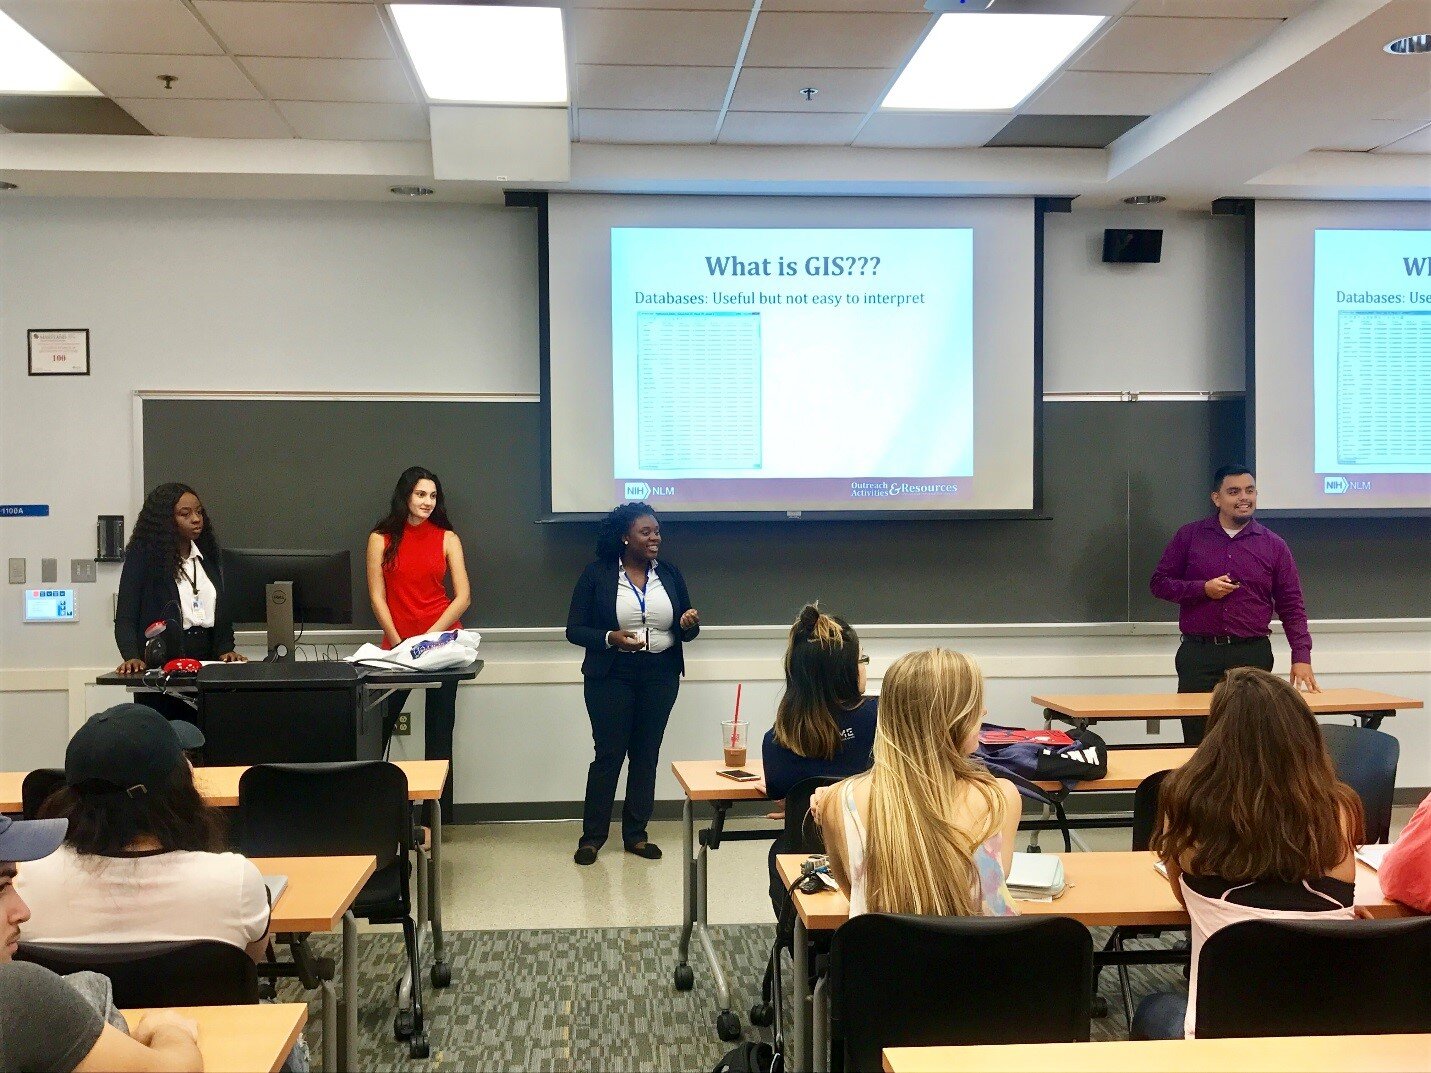
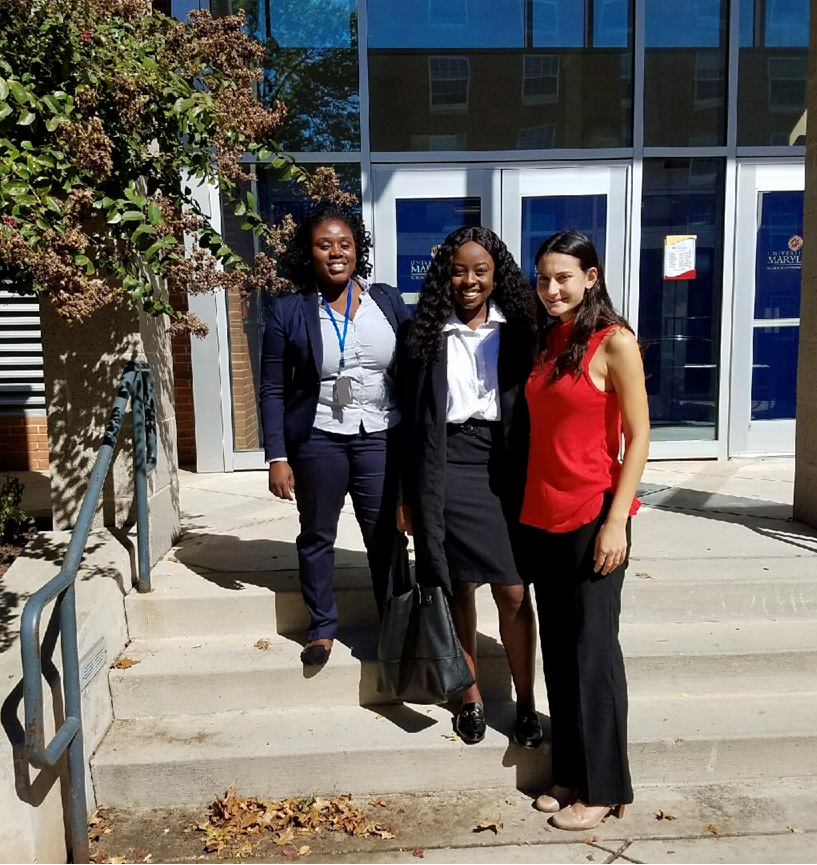
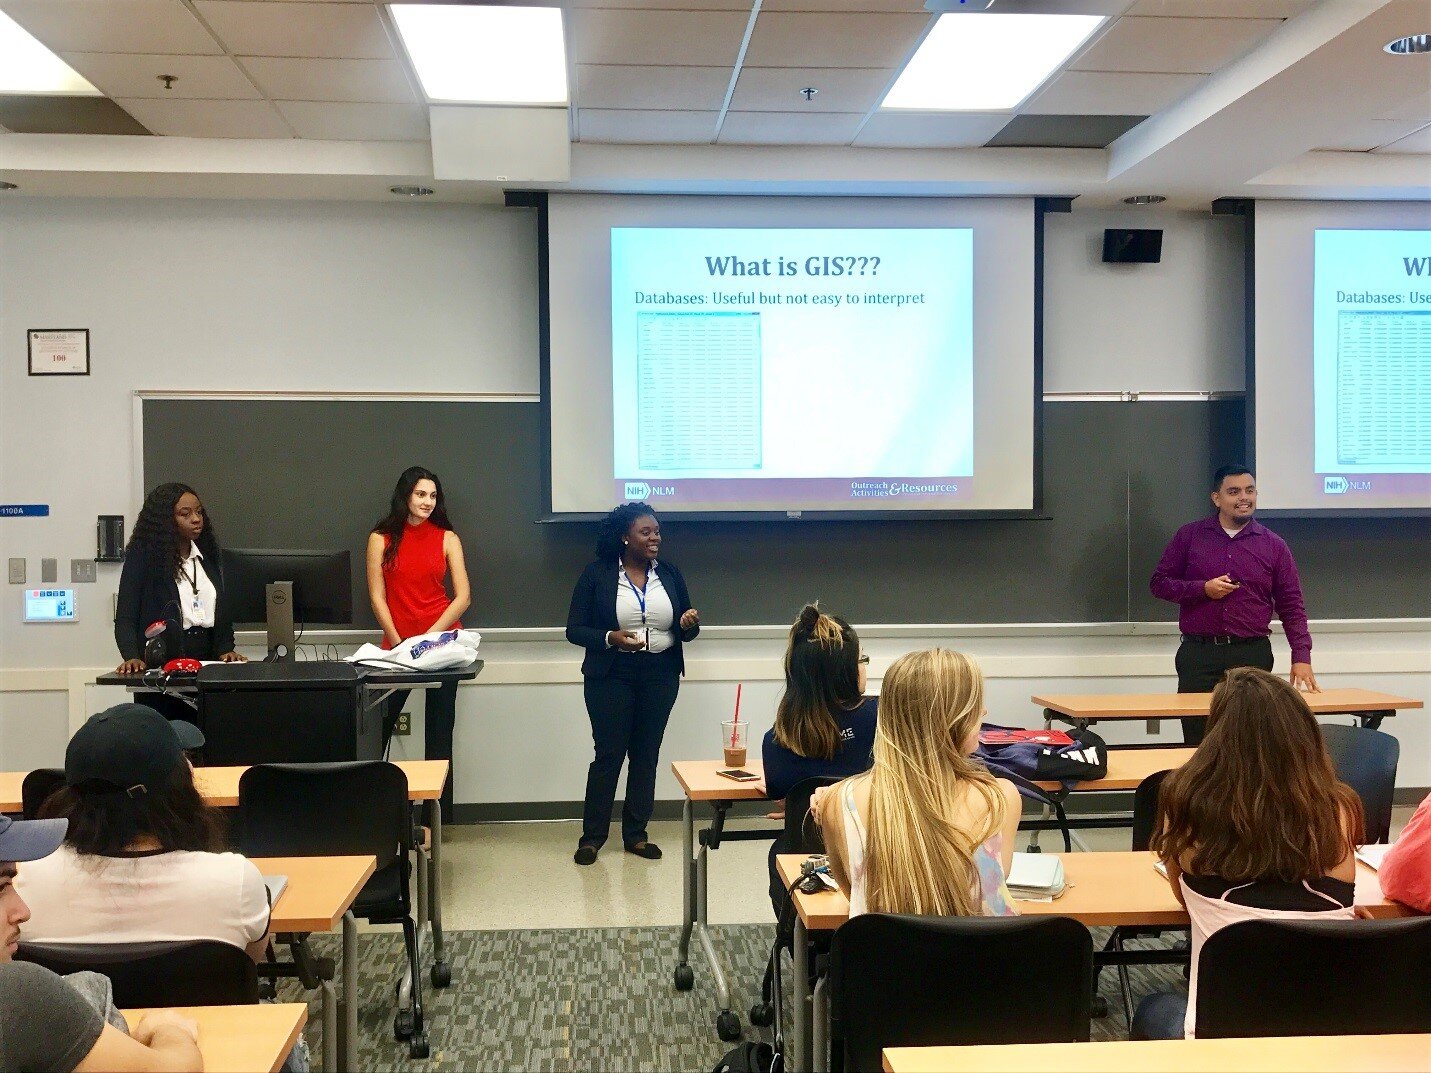
On September 28, 2017, Community Health Maps (CHM) was presented to the  Community Health class at the University of Maryland School of Public Health in College Park. The session was provided by Julian Argoti, research assistant at the National Library of Medicine (NLM), and three University of Maryland Public Health interns completing their capstone project at the NLM. The primary goal was to expose the students to the resource and to help them explore how it might be used in their research.nlm1The presentation took place within a 95-minute class period with 53 students.  The presenters introduced the CHM blog and briefly touched on using Geographic Information Systems (GIS)/spatial analysis to address a public health concerns, as English physician John Snow did in 1854 by mapping the source of a cholera outbreak in Soho, London, and  as a former NLM intern did by mapping local curb ramps to help those with mobility issues cross streets safely.NLM2The students then completed a hands-on data collection exercise. They were introduced to Fulcrum, a low cost tool that allows users to build custom data collection forms for use on iOS or Android devices. Next, they left the classroom to collect data in real time, from the locations of trashcans and water fountains inside buildings to the positions of benches and signs outside them.The session ended with the students exploring a series of exercises designed to help them through the entire CHM workflow, from field data collection to online data presentation.  A post-class survey indicated that most participants felt they could use CHM in upcoming assignments.  
Mapping South Florida's King Tides

By John C. Scott - Center for Public Service Communications

Community Health Maps (CHM) recently joined forces with community based organizations and residents in North Miami, and Florida International University faculty to map health risks associated with the 2017 King Tides, September 19th and 20th and again on October 7th , the time of the highest of the inundations.

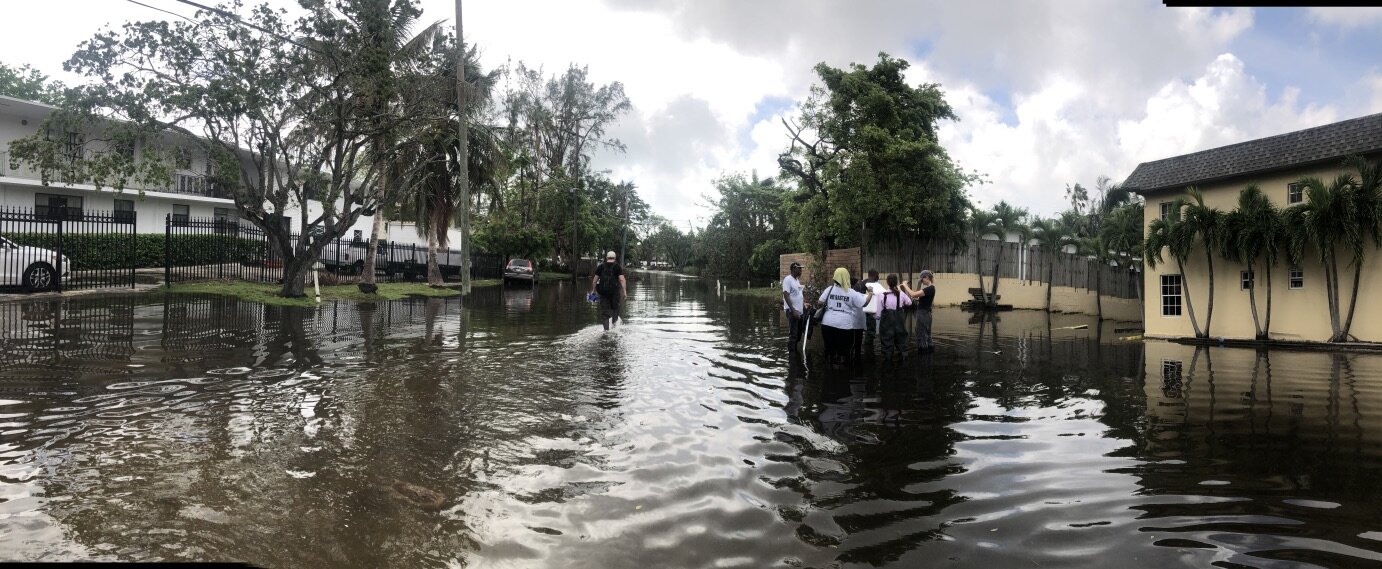
Several communities in Miami experienced predictable tidal flooding during the highest tides of the year. The Shorecrest community is among them. Sampling of the flood waters during previous King Tides has established that they contain elevated concentrations of bacteria. The aim of this project was to prepare residents of the community to record and map data that will help them plan their daily activities to protect their health, and give them tools to communicate with the city and county about their environmental health risks.

King Tides flood the streets of the Shorecrest neighborhood while community members collect data.

King Tides flood the streets of the Shorecrest neighborhood while community members collect data.

Complicating the task of collecting data in the community was Hurricane Irma which hit South Florida only a week before the September measurements, causing dislocation of residents, power outages and other disruptions that resulted in the decision not to tax neighborhood residents by expecting them to learn the CHM workflow and map hazards in the community.

For the CHM/King Tides mapping project, community members were trained on the CHM workflow before collecting and mapping environmental health data during the King Tides in the Shorecrest community of Miami. A physical tool box containing needed technology, sampling equipment, key contact information, and protocols for community engagement in data collection during King Tides was created by Jan Booher of Unitarian Universalist Justice Florida and Drs. Tiffany Troxler and Susan Jacobson of Florida International University Wetland Ecosystems Research Lab and School of Communications, respectively. Based on the initial data collection and mapping effort with the Fall 2017 tides, a community report will be generated in collaboration with community leaders to be shared with residents and decision-makers in the community and with appropriate members of City of Miami and Miami-Dade County staffs.

For those of you who are new to Community Health Maps, the initiative was founded on the premise that community-based organizations, environmental health advocacy groups, public health agencies are in a better position to serve their constituents when they can collect and maintain their own data, rather than relying solely on national, state or city agencies, or majority-institution partners to provide data to them.

The CHM approach involves using relatively low cost tablets and smartphone platforms, combined with a selection of low/no-cost applications that run on them, to collect data in order to better understand health status or health risks to the community and support decision-making leading to appropriate allocation of resources to improve health conditions and prevent or mitigate risk. Using the CHM workflow, those data can then be analyzed, shared and presented using low cost/open source software. These tools allow expert and novice users, with little budget resource, to implement mapping workflows.

A common way in which prospective users have learned the CHM workflow is through our CHM Training Workshops. The CHM workshop presents an opportunity to learn and discuss new ideas and methodologies, which will empower community organizations, teachers, and students serving vulnerable or underserved populations with low cost, intuitive mapping technology. During the workshops, we also share experiences where the CHM workflow has helped MPH programs and other academic health centers and community-focused organizations visualize their data and better understand and portray their significance to the community.

The Florida King Tides was a more ambitious project than usual for CHM. While most of the work of the CHM team consists of training and building capacity of communities to map and better-understand their health risk to environmental factors, this was our first opportunity to work in the field with users of the workflow. Together with the core CHM team of NLM, Center for Public Service Communications and Bird’s Eye View, CHM teamed with Unitarian Universalist Justice Florida (UUJF) and it’s The Rising Together project, which works residents in vulnerable communities in coastal Florida about how to prepare for and react to the public health effects of climate change. Through its association with UUJF, the Community Health Maps team also trained and worked with Quaker Earthcare Witness, New Florida Majority, and Florida International University’s Wetland Ecosystems Research Lab and School of Communication and Journalism.

Map made in QGIS of the September King tide data collection showing flood water salinity levels.

Map made in QGIS of the September King tide data collection showing flood water salinity levels.

It is our vision that data collected by neighborhood residents about conditions affecting environmental health can be visualized via CHM, together with databases available from city, county, state and federal governments to, as one example, identify potential predictable impact of future king tides so that public transportation and school walking routes can be modified to avoid health risks.

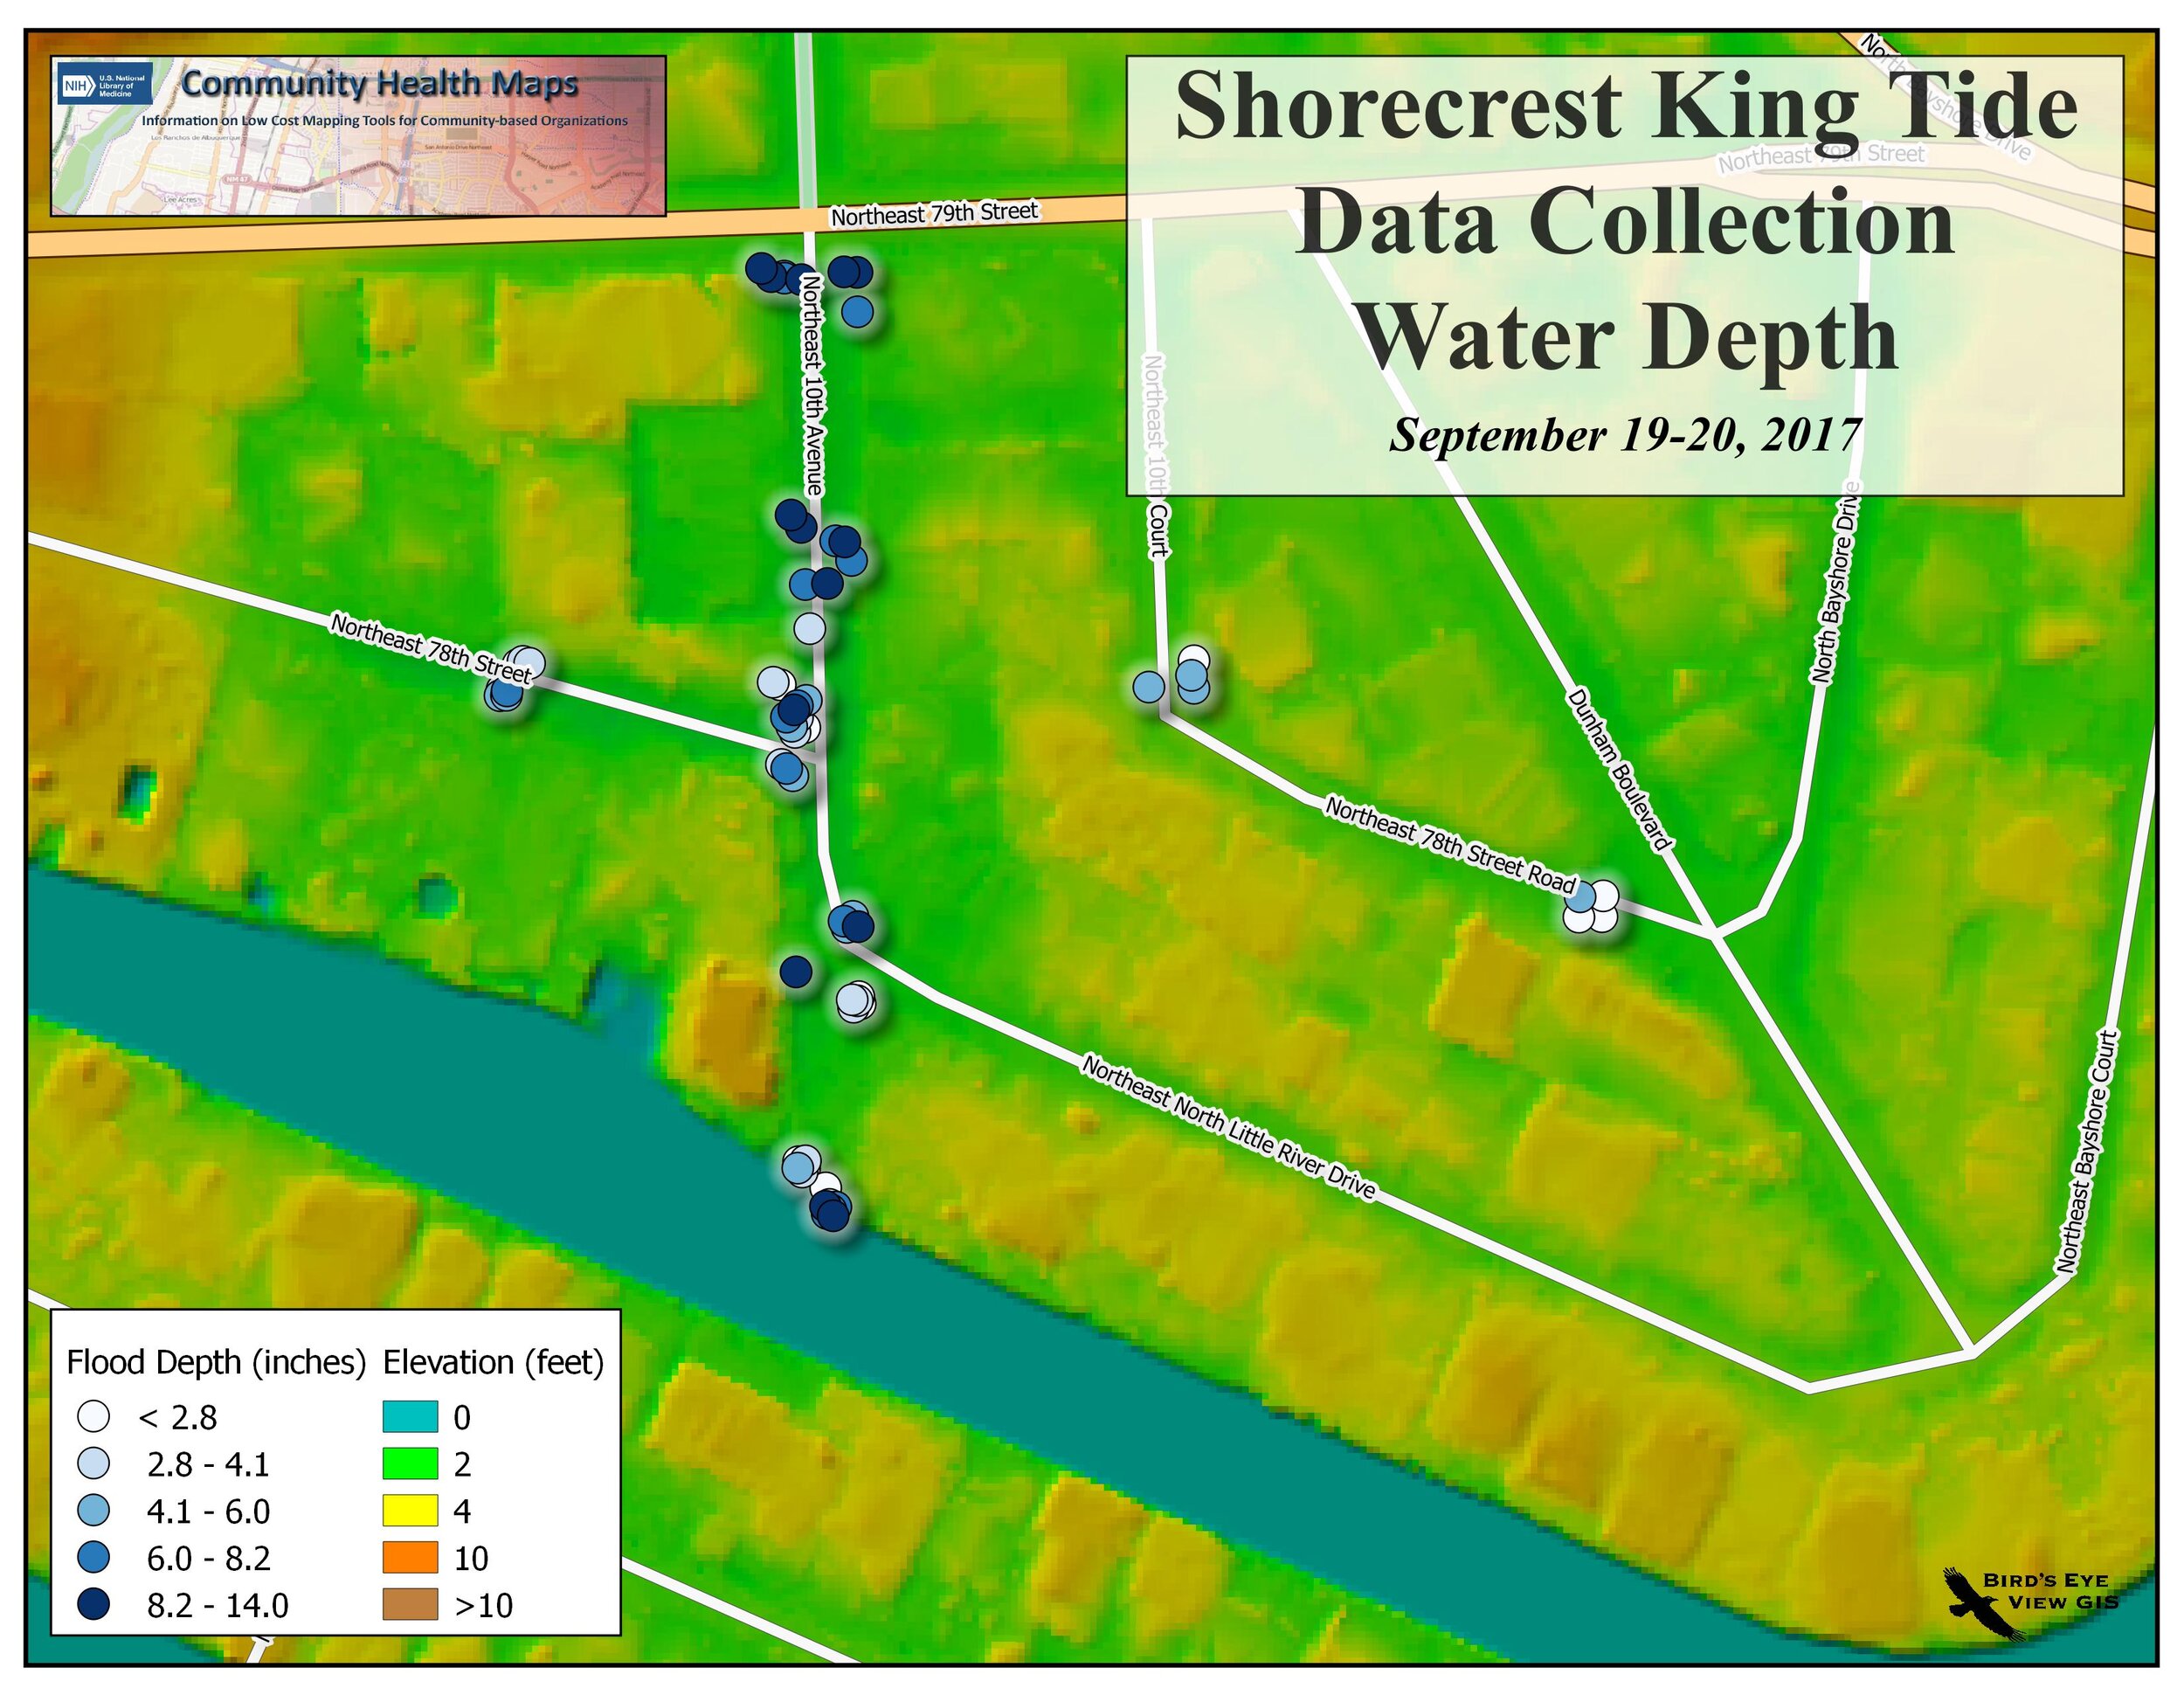
Map showing water depth in comparison to elevation above sea level

Map showing water depth in comparison to elevation above sea level

While collecting data for risk maps a Miami Herald reporter stopped by the Shorecrest neighborhood where we were working. Here's his story about our initiative.

CHM Lab Exercises Updated!

One of the most valuable resources for Community Health Mappers remains the series of lab exercises created two years ago. Our workshops, while effective, are short and only scratch the surface of what you can do with mapping tools. They are basically a quick start guide to Community Health Mapping. The labs however, can be used as a resource to help you build your skills once you've taken the first steps towards mapping your community.The technology changes rapidly. QGIS produces a new stable version every 4 months. Annually QGIS also produces a long-term release. Carto and Fulcrum also update their tools on a regular basis. This mean the lab exercises need to be updated to keep pace.The good news is that this spring the labs were all updated and expanded. There is some foundational knowledge needed to really take the next step after a workshop. The current revised set of labs includes Lab 0: A Community Health Map Introduction and Reference. This lab has background on the Community Health Maps project and the workflow. It also contains a Glossary of GIS terms, and several appendices covering: A) available software, B) data sources and C) everything you need to know to better understand coordinate systems and projection.The remaining labs are as follows:Lab 1 covers field data collection and has been updated to work with Fulcrum. This has allowed us to unify the exercise into one document for both iOS and Android users.Lab 2 shows you how to bring your field data into QGIS. This includes a tour of the QGIS interface, and how to map coordinate data stored in a spreadsheet.Lab 3 is named Combining Field Data with other Organizational Data. It shows you how to work with coordinate systems in QGIS. It also covers how to join tabular data to the attribute table of a GIS layer. This is a step that often has to be done to merge socioeconomic data from the U.S. Census to census geography such as tracts or block groups. It concludes with a lesson on address geocoding. This is the process you use to produce points from addresses.Lab 4 shows you how to do some basic spatial analysis. You learn how to clip data to your study area, measure proximity, query your data to select features and calculate areas/ density.In Lab 5 you learn how to use some of the great data visualization techniques found in only in QGIS. The lab then walks you through how to compose a map. Along the way you learn some data styling tricks and how to use the Print Composer.The series concludes with Lab 6 Data Visualization with Carto. Carto underwent a major update and rebranding since the first edition of these labs were created. You can use this exercise to see how to work with the new Carto Builder interface and tools to create an online map of your results. It covers uploading your data, styling and sharing your map with others.The four labs that deal with QGIS have been updated to include some exciting new features that have been added to QGIS in the last year. Links to the lab data are included. So head to the Resources page and build your Community Health Mapping skills!

CHM Conducts Three Workshops in Maryland

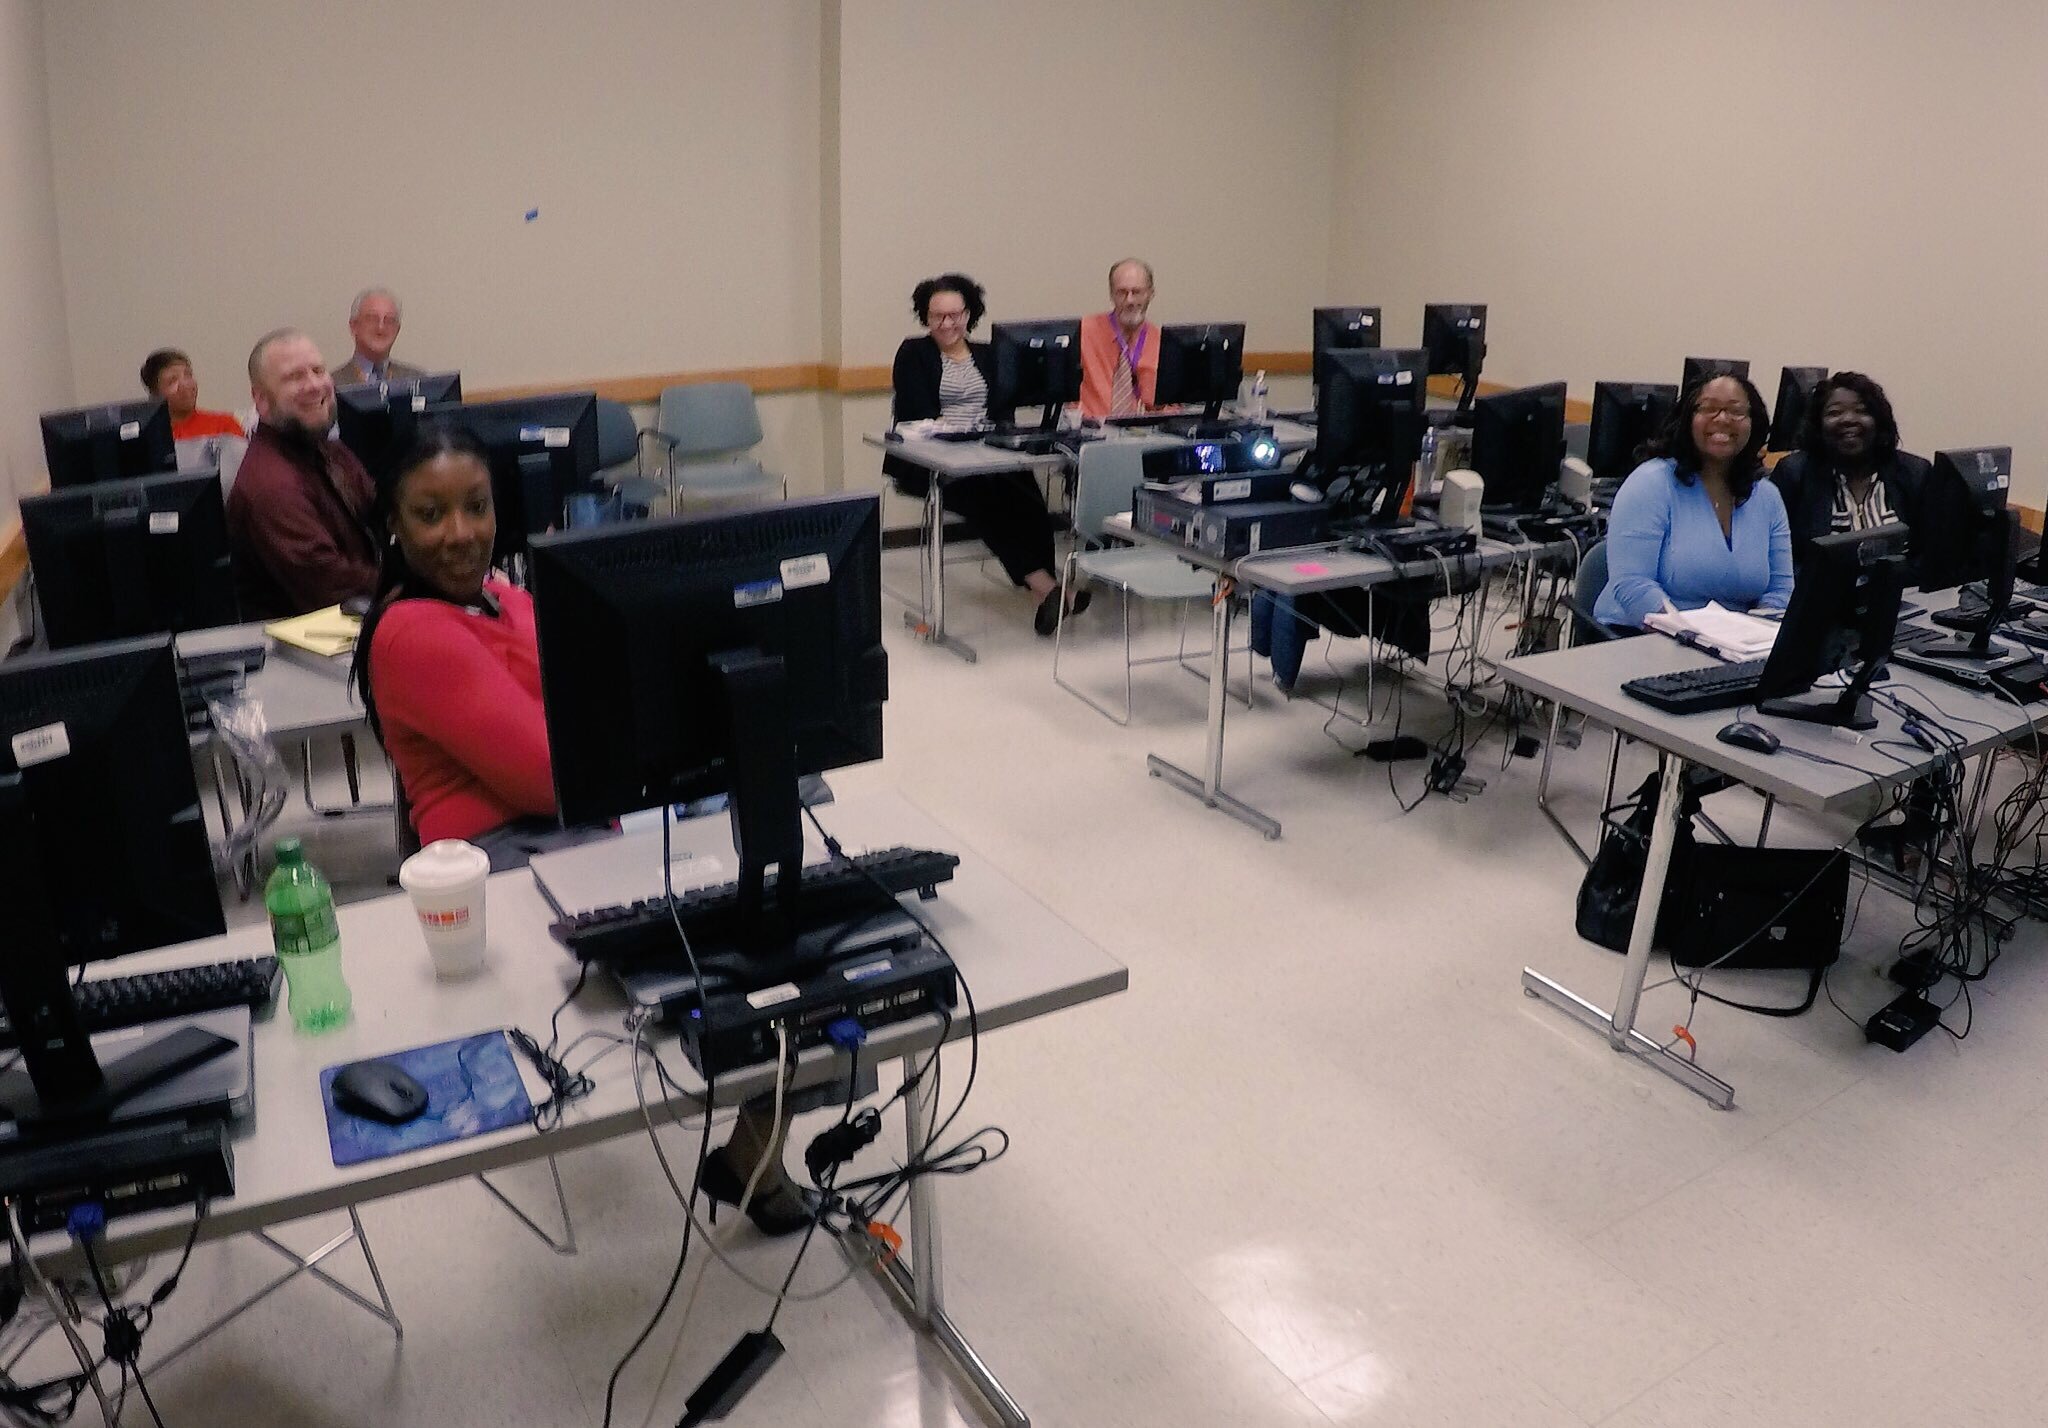
Last week Kurt Menke traveled to Maryland. Two workshops were held at the Prince Georges County Department of Social Services for people working on homeless issues. All attendees were novices to mapping technology. However, in the first hour they all built a data collection form in Fulcrum and went outside to collect some data around the building.file-mar-02-9-35-57-amThe attendees represented a variety of organizations including many working with YouthREACH Maryland. REACH is an acronym standing for Reach out, Engage, Assist, & Count to end Homelessness. It is an effort to obtain accurate, detailed information on the number, characteristics, and needs of unaccompanied homeless youth in Maryland. Other organizations represented at these workshops included:
  • Maryland's Commitment to Veterans
  • Maryland Department of Planning
  • Prince Georges Community College
  • St Ann's Center for Children, Youth, and Familes
  • Maryland Multicultural Youth Center
  • So Others Can Keep Striving (S.O.C.K.S)
  • Sasha Bruce Youthwork
  • Lifestyles of Maryland.

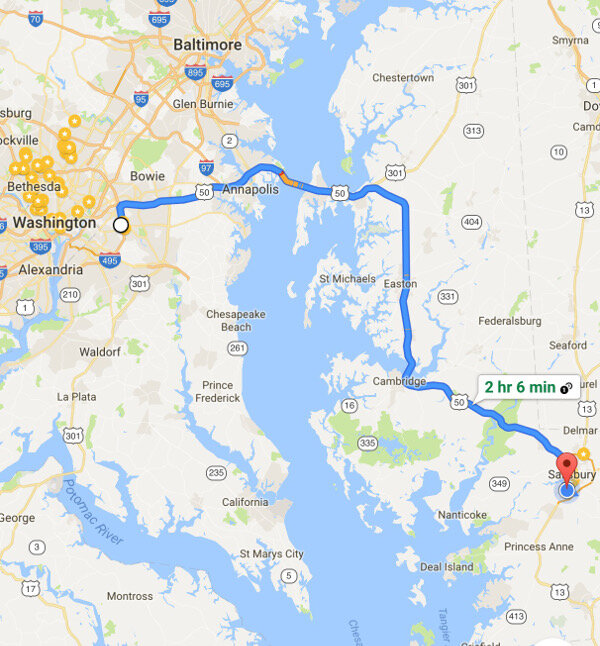
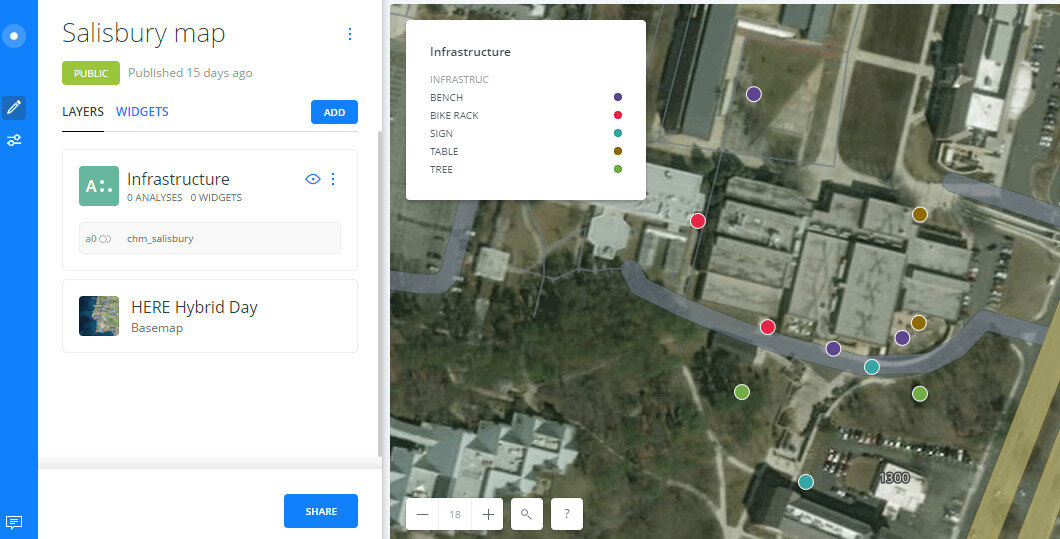
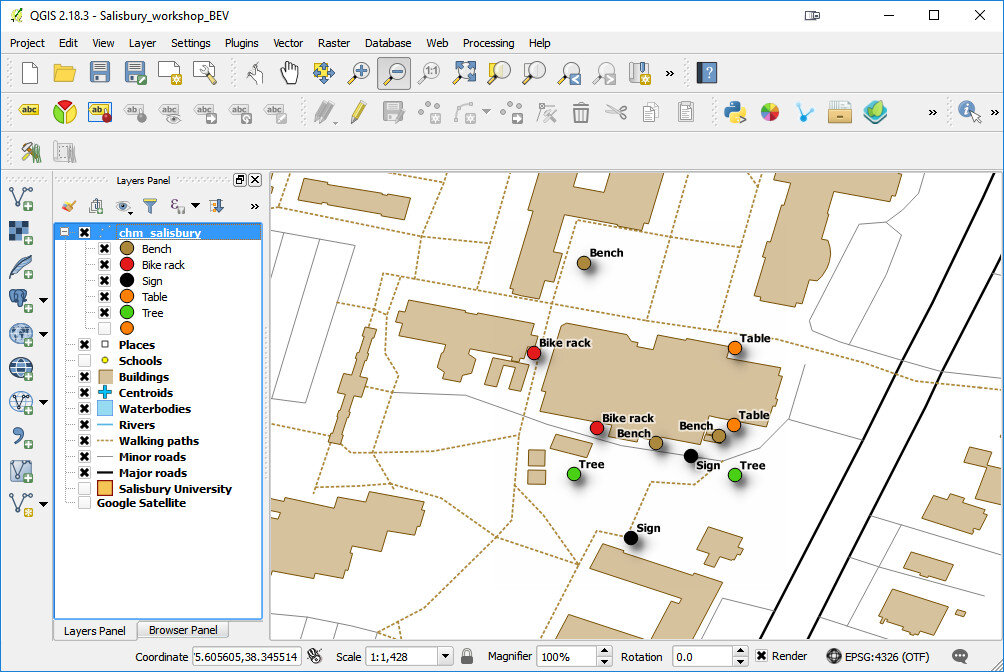
In the final two hours of the workshops attendees learned how to map the data they collected in both Carto and QGIS. We also had time for a brief discussion about how CHM could be used in their projects. There were a lot of ideas shared about how the technology could help community engagement.file-mar-02-9-27-09-amAfter the two PG County workshops, CHM traveled across the Chesapeake Bay bridge to Salisbury University on the eastern shore.file-mar-02-9-27-49-amv2The following morning we held a workshop geared towards social work students at Salisbury University. Attendees went through the CHM workflow and were introduced to Fulcrum, Carto and QGIS. Below is a map of data collected around the student center in Carto.2017-03-02_095000Salisbury University Data Collection in CartoThe workshop concluded with a short introduction to working with data in QGIS.2017-03-02_094159The next scheduled workshop for the Community Health Maps team will be at the Teaching Prevention 2017 Conference in Savannah, Georgia. That conference takes place from April 5-7th. If you are interested in learning this technology this workshop will be a great opportunity!
CHM Has a Busy Fall with Workshops and Storms!

We had a busy fall giving three workshops in September and October. First Community Health Maps traveled to Spokane Washington to conduct a half day technical workshop at the National Tribal Forum for Excellence in Community Health Practice.img_1639This event was organized by the Northwest Portland Area Indian Health Board and supported by the Robert Wood Johnson Foundation. We weren't certain who or how many would attend, and I expect attendees weren't entirely sure what Community Health Mapping was all about either. However, it turned out to be a very engaged group representing tribes from many regions of the country. Within a few hours everyone was able to:
  • Create a field data collection form in Fulcrum
  • Collect some data around the conference center on their smartphones/tablets
  • Make a map of their data in Carto
  • Learn how to bring the data into QGIS

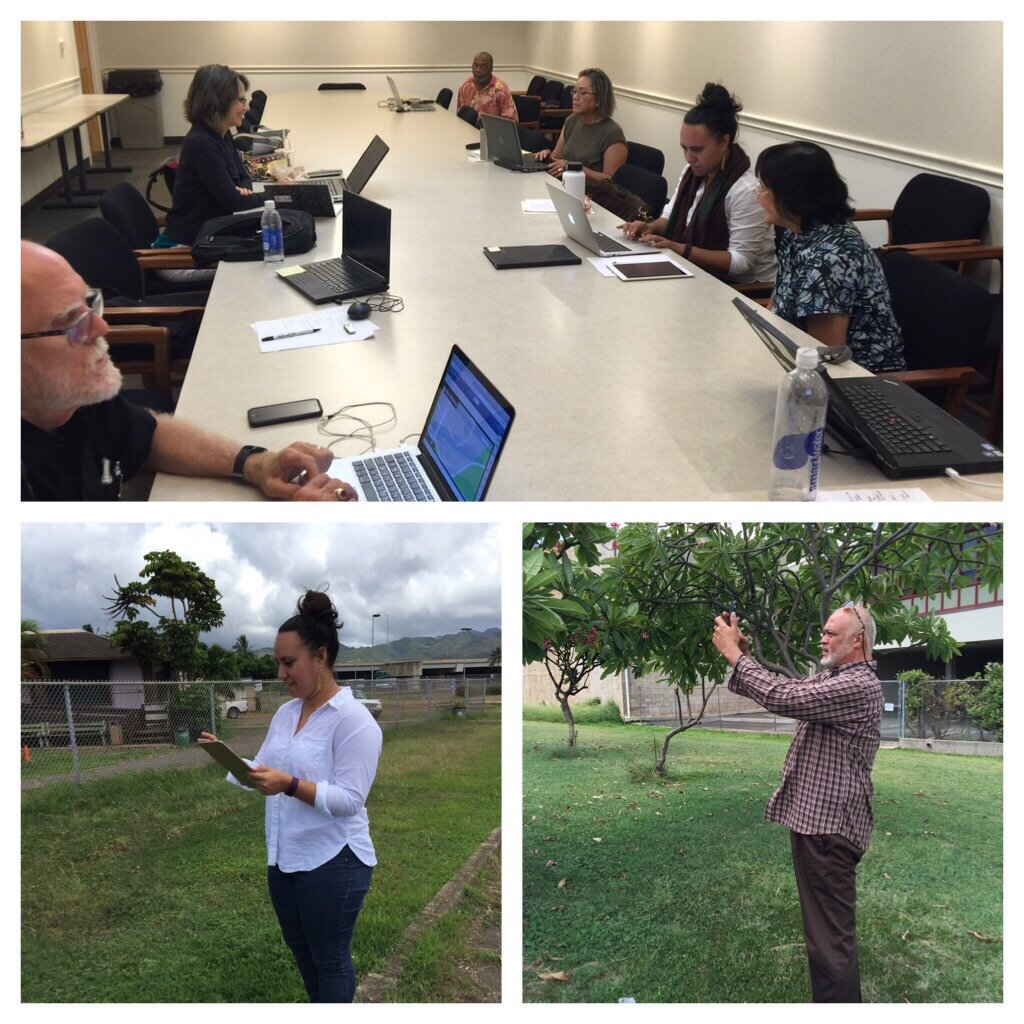
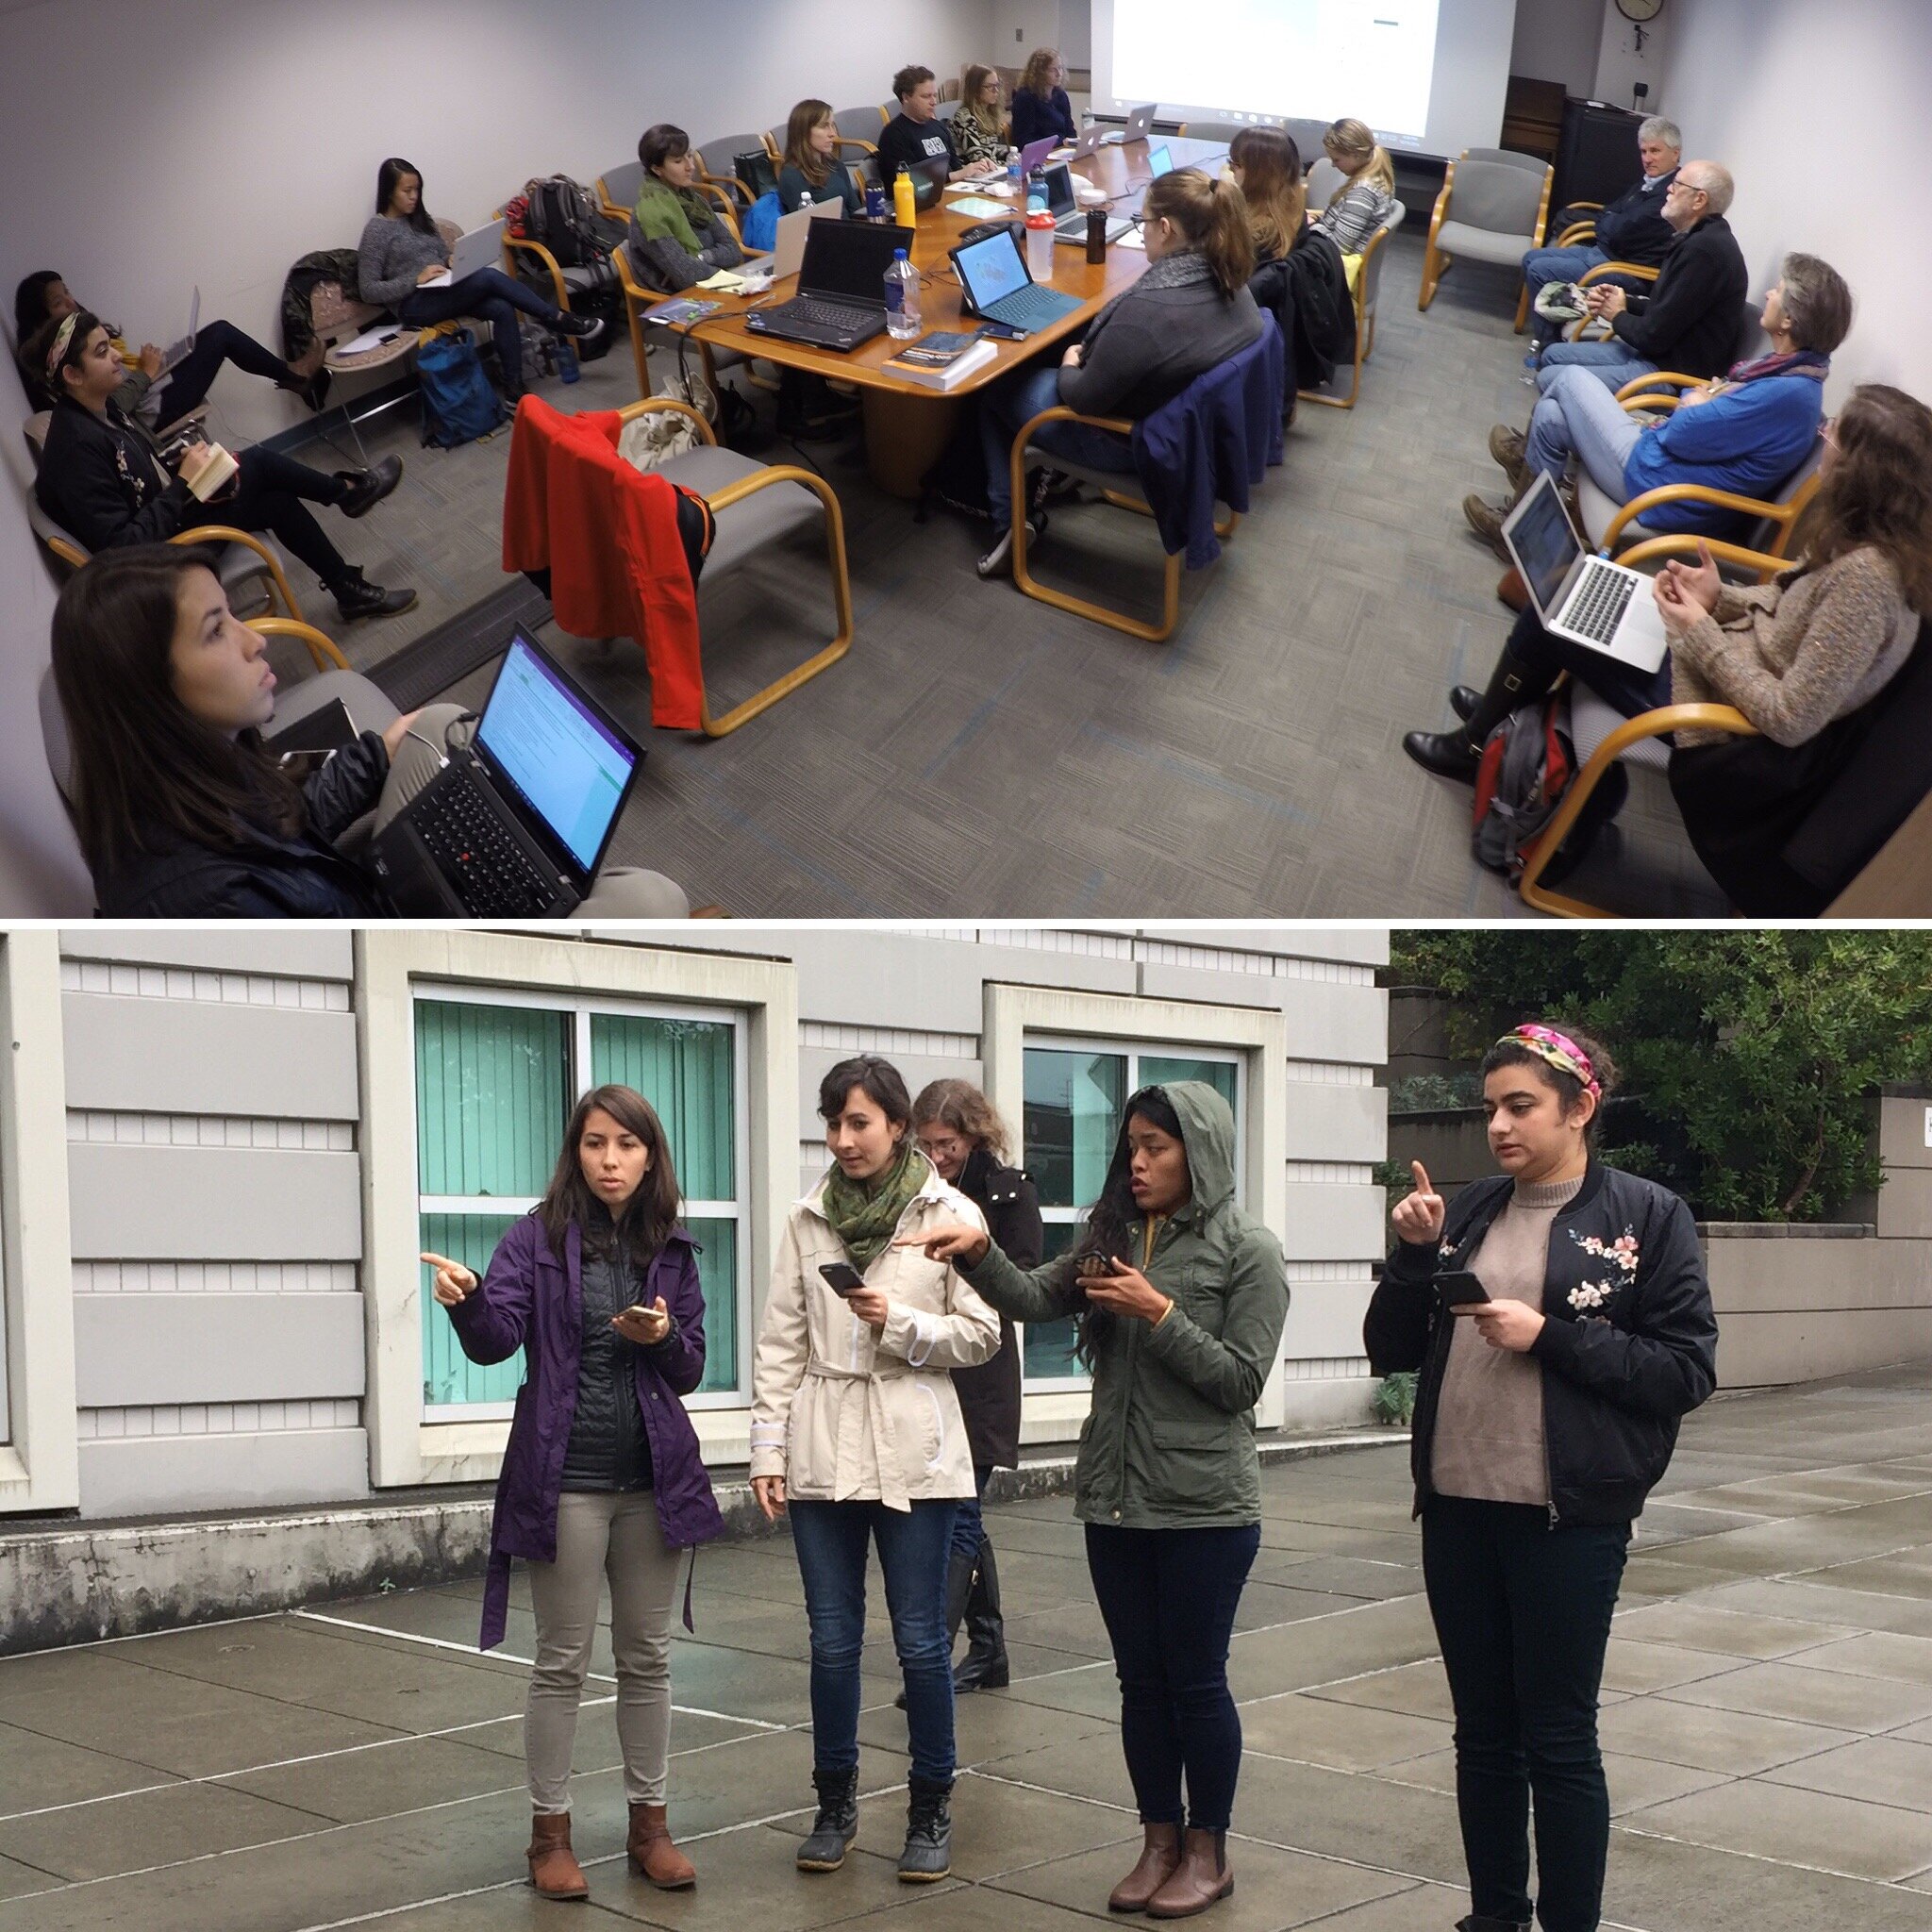
This was a typical CHM workshop with most never having done any mapping work before. As such it was a very empowering experience for the participants to learn how to use this technology to map their community in just a few short hours.From there we traveled to Honolulu, Hawai'i to give a workshop organized by Papa Ola Lokahi. There were two hurricanes (Lester and Madeline) heading towards the islands. Fortunately they both veered off and didn't cause any damage or disruptions! The attendees came with a plethora of ideas on how mapping could fit into their work including:A) tracking scholarship recipients of the Native Hawaiian Health Scholarships program,B) supporting the Native Hawaiian Cancer Network,C) mapping Dr. Ben Young’s research on historical tracking of Native Hawaiian Health professionals,D) mapping Native Hawaiian Homelands to provide resource data to providers and community members, andE) use the CHM "train the trainer" model to increase ongoing trainings for service providers including community health outreach workers and patient community navigators in Hawai'i.img_1004After a brief break we headed to Seattle, Washington, again there were two separate storms including, the remnants of Typhoon Songda, bearing down on the region threatening to disrupt power and services! Again fortunately the storms didn't make a direct hit on the area and the workshop proceeded on schedule.We went to train students in the capstone course of the Community Oriented Public Health Practice Program at the University of Washington. This is our second year supporting this program. The first year was a huge success with two students attending the APTR Conference and presenting their work.Like last year we had  a full house with students eager to learn about community mapping. Both first year and second year students were in attendance. Several second year students will submit proposals for consideration, to receive a stipend and support for using Community Health Maps in their capstone projects. Jamie Smeland is the first of the group to be awarded the stipend for her capstone project entitled, "Honoring the Collective Wisdom: Documenting a Cross-Racial and Intergenerational Movement to Shift Power to Youth and Parent Leaders to Improve Educational and Health Outcomes for Students of Color in South Seattle & South King County." We look forward to working with these students in the coming months.IMG_2178.JPGIn the near future we will be offering an updated set of Community Health Mapping labs and a platform for CHM webinars. Stay tuned! In the meantime if you are interested in Community Health Maps and/or receiving CHM training contact John Scott (jcscott at cpsc.com) for more details.
GIS as an Educational Tool at MUSC

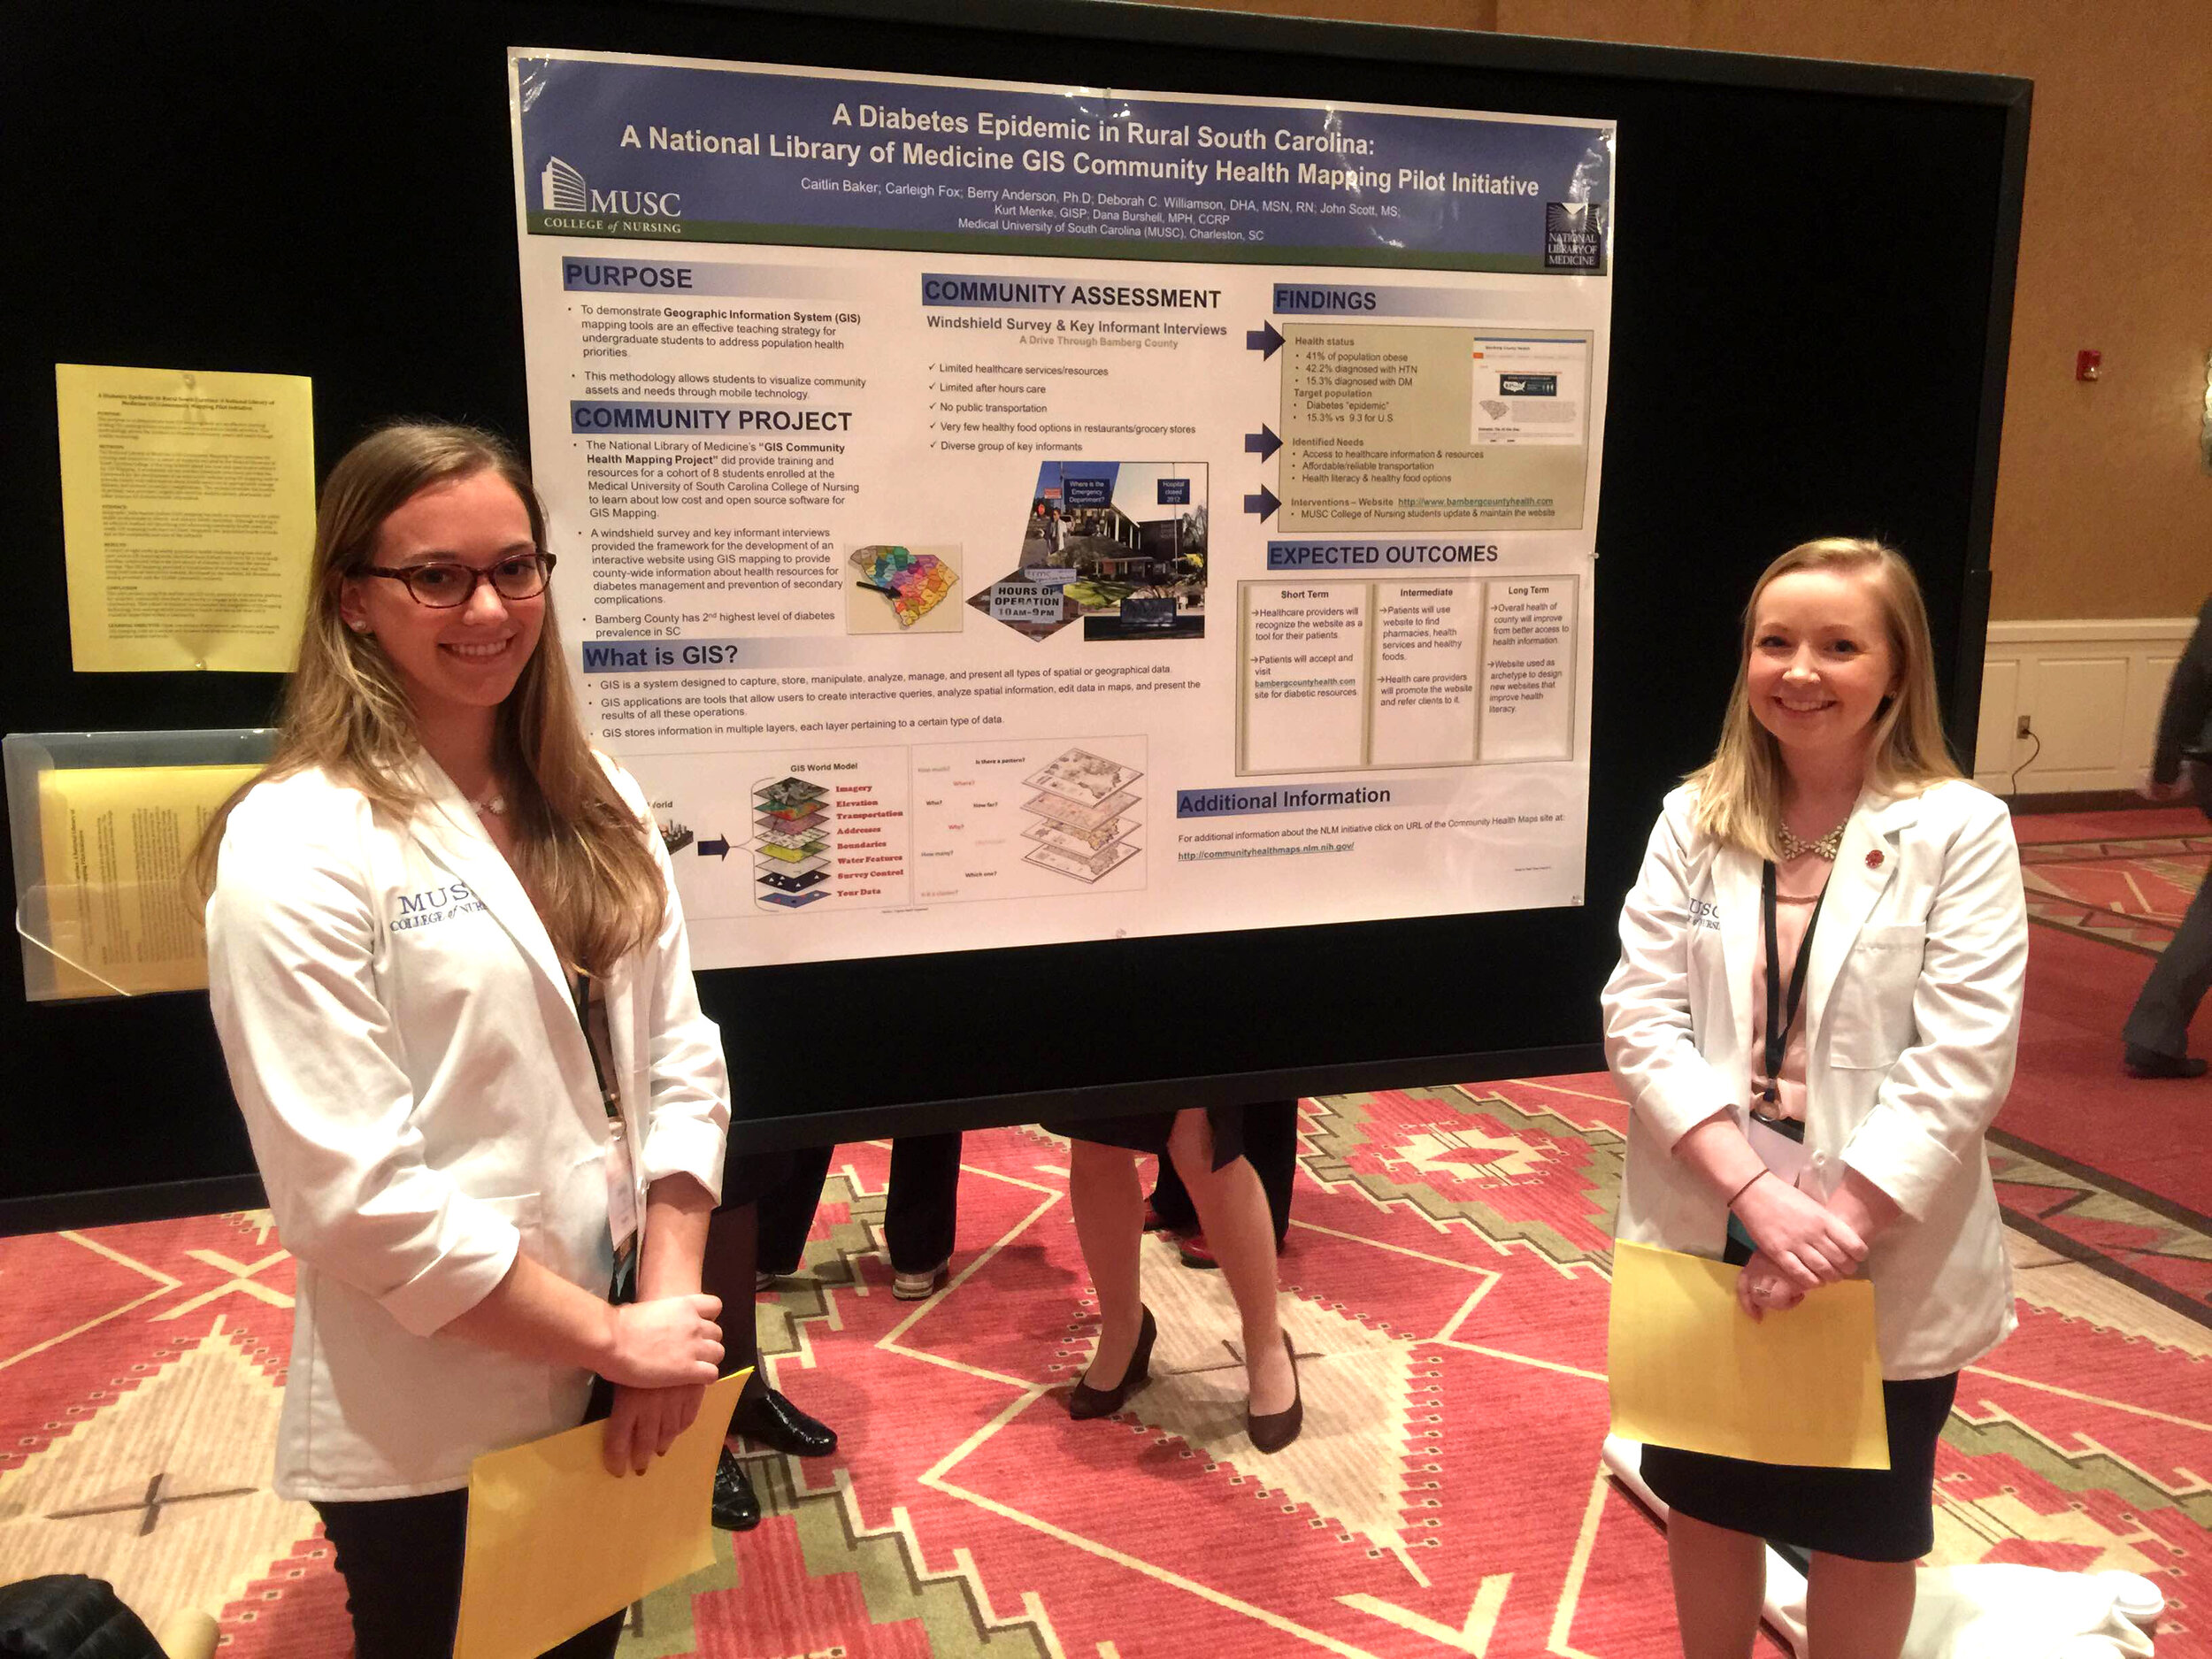
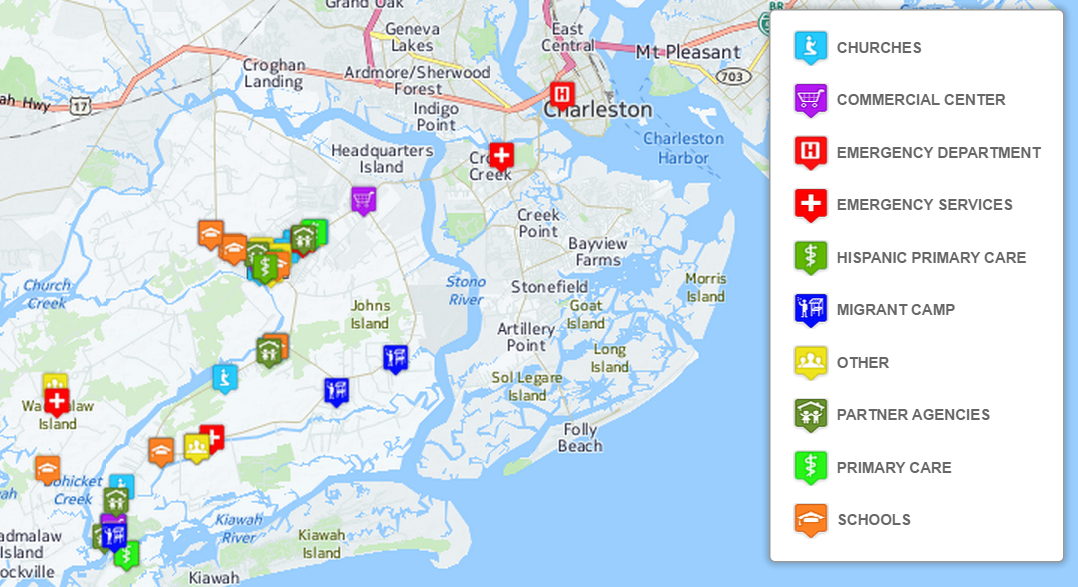
Submitted by Jennifer RewolinskiDr. Deborah Williamson is an Associate Professor in the College of Nursing at the Medical University of South Carolina (MUSC), Charleston. Dr. Williamson, Community Health Maps (CHM) and MUSC have partnered in providing training that integrates GIS and CHM tools for a high school Teen Health Leadership Program. Dr. Williamson has worked with both community members and students.wilmsndDr. Williamson believes that, “GIS has the potential to substantially increase community engagement and is truly a concept of the neighborhood taking control of their data.” She notes that while researchers might study a community, that a community’s input is essential to understanding the cultural and environmental context surrounding health issues: “GIS mapping puts the community members on more of a level playing field with their research partners.” GIS can empower and educate community members to identify their key issues, to become a part of an analysis, and to provide solutions. When communities are given the opportunity to map their own health, discovery, and awareness, positive changes can result.  When a community feels it has more of a say through engagement with GIS, or communication with a map, intervention is more likely to be effective.For the past three semesters, Dr. Williamson has used GIS in her own classroom as a capstone project for population health students.  They, “find it fun and can take it with them into other settings, it fits into the world of new technology, and it takes people to the next step of looking at health issues.” Mapping offers a different way to help students visualize Social Determinants of Health and to make the connection between what population health is, and the factors that promote or deter it.IMG_9585_v2Finally, Dr. Williamson sees GIS as bi-directional: it supports visualizing gaps and assets while also providing the ability to disseminate and build on information via intervention programs to improve health outcomes and strengthen communities. GIS is also broadly applicable to almost any discipline and easily used by those with little expertise. “Presenting raw data to a community or students doesn’t mean a lot,” Dr. Williamson comments, “but when that same data is aggregated visually it instantly communicates a message to any audience.” GIS is clearly suitable as an effective educational tool in the classroom and in communities.CHM thanks Dr. Williamson for her continued collaboration and time spent advancing the CHM program through use of the CHM tools at MUSC. CHM values our partnership with MUSC and hope that the future is as mutually beneficial as the past few years.Field data collection for the CHM workflow bridges the divide between learning in a classroom and experiencing conditions in a community. For the capstone project, students use CHM labs and parts of the CHM workflow, including phone data collection with iForm or Fulcrum, integration of the data into QGIS, and presenting the data with Carto or Google Maps. Dr. Williamson’s students often upload their data from iForm to Google Maps because of its familiarity and easy access.One student project involved identifying migrant camps as a community in need, and assessing the community through surveys and key informant interviews.  When the data showed that migrant workers often lack knowledge of health information and access to healthcare services, students mapped locations of migrant camps near Charleston, SC in relation to urgent care facilities and shared the data with the migrant outreach workers from a local community health center. Later, an intervention was developed to provide hands on CPR and first aid instruction to 60 workers. This project displays successful application of CHM tools in an educational and community context resulting in an intervention that may offer real change.CharlestonMigrantMap.png
Visualizing an Intervention for Tobacco Control

Submitted by Jennifer Rewolinski

Dr. Heckman, an assistant professor of psychiatry and behavioral sciences at the Medical University of South Carolina (MUSC) in Charleston, used Community Health Maps (CHM) tools in his research on tobacco control. Smoking is the leading preventable cause of death worldwide and costs the US $130 billion in direct medical costs annually. Smoking is still a major public health issue that influences mortality, morbidity, healthcare costs, the environment, and quality of life.

Dr. Bryan Heckman

Dr. Bryan Heckman

The outcome of Dr. Heckman’s precision medicine project will be a mobile app that aids smokers who recently quit by alerting them of proximity to stores which sell cigarettes or alternative nicotine products. Studies show that greater tobacco retailer density is associated with greater incidence of relapse; Dr. Heckman believes that mapping provides a new approach to visualizing environmental factors. A CHM training event at MUSC spurred his decision to integrate mapping into his own work using the CHM labs as a guide. These labs provide step-by-step instructions for implementing the CHM workflow. He used the data collection app Fulcrum on an iPhone to collect information on retailers: GPS coordinates, type, type of tobacco products sold, e-cigarette advertising, and photos. His team also used a high-powered Trimble GPS device to test accuracy of phone GPS, and the accuracy of phone GPS was adequate and more cost effective than more expensive GPS devices.

Figure 1. Dr. Heckman’s in progress map shows higher numbers of tobacco retailers are associated with  Census Tracts that have both higher poverty and a higher percentage of minority populations.

Figure 1. Dr. Heckman’s in progress map shows higher numbers of tobacco retailers are associated with  Census Tracts that have both higher poverty and a higher percentage of minority populations.

Dr. Heckman integrated his Fulcrum data into QGIS software. He added national datasets from the American Community Survey and Behavior Risk Factor Surveillance System for Census tract data, and Synar for retailer data to check the validity of the Fulcrum data; field data collection with Fulcrum revealed a more accurate list of current retailers than the national secondary datasets provided. Dr. Heckman believes QGIS is a powerful tool with many features; he was not only able to use QGIS to monitor and visualize his research questions but also to guide his project decisions and hypotheses. His results will guide policy recommendations, improve access to care, and deliver novel interventions.

Figure 2. Dr. Heckman’s in progress map shows higher numbers of tobacco retailers are associated with Census Tracts with higher percentages of minority populations

Figure 2. Dr. Heckman’s in progress map shows higher numbers of tobacco retailers are associated with Census Tracts with higher percentages of minority populations

For those attempting to undertake a health GIS project on their own, Dr. Heckman emphasized that all the tools needed are provided on the CHM blog; only time and patience are required. He also recommends asking for help and reaching out to other CHM users who have experience. Dr. Heckman’s project has the potential to affect behavior change and reduce health disparities via a mobile intervention app which identifies nearby tobacco retailers and prompts and provides an intervention and awareness of a health issue. Dr. Heckman’s experience is an example of how the CHM blog and tools might be used.

Dr. Heckman would like to thank Kurt Menke and the CHM team, Dr. Williamson from MUSC, and his mentors for inspiration and growth. He would also like to acknowledge the Hollings Cancer Center and American Cancer Society Institutional Research Grant that helps support his work, and Alex Hirsch for his help coordinating the project.

The CHM team would like to extend their own gratitude to Dr. Heckman as they sincerely appreciate his time and his support of the CHM blog.