By Jenny Rewolinski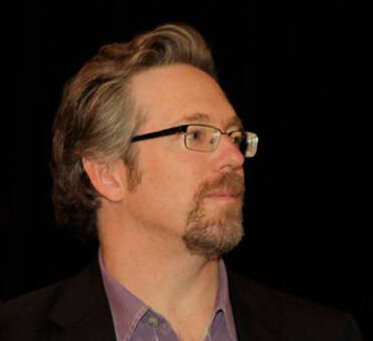 The following is a question and answer interview with the moderator of the with Community Health Maps (CHM) blog, Kurt Menke, GISP (Certified geographic information systems (GIS) professional). Kurt has worked with CHM since its inception in 2014 and is a valuable resource for users of CHM.What is your background? Kurt: I started out as an archaeologist. I spent 8 years in the desert southwest working on Anasazi pueblo archaeology. I went on to receive a Masters in Geography from the University of New Mexico in 2000. While in graduate school I began working at the UNM’s Earth Data Analysis Center (EDAC). That's where I really learned about GIS. I worked there for 11 years as a GIS Analyst/Programmer.When did you being using open source GIS?It was at EDAC, about 15 years ago, when I was first exposed to open source mapping software. We began using Mapserver for web mapping applications, because it was faster and more stable than the Esri alternative. I realized there was a whole ecosystem of open source tools out there.How did you first come to work with NLM?Kurt: John Scott, President of the Center for Public Service Communications and I have collaborated on health related projects with NLM for over 10 years. We first met while I was working at EDAC on a project with the National Indian Council on Aging (NICOA). I had developed an app named the Interactive Health Atlas. That project eventually ended and I left the university to create my business Bird’s Eye View. John thought we should take the best parts of the NICOA project to the National Library of Medicine (NLM). It evolved into what we called the Health Equity Atlas. This was custom software we developed, which was really time consuming. It worked great, but wasn’t widely adopted. We learned a valuable lesson, for something like this to be successful, it needs to be something organizations are asking for. No matter how useful it may be, if people don't have time for it, it will just sit on the shelf.How did CHM begin?Kurt: In 2012, John asked me to look at existing smart phone apps. His idea was, rather than developing a completely new application, we could use existing low cost software. Plus we would work with organizations who had mapping as a defined need. I ended up completing a thorough survey of smartphone data collection tools and some of them were perfect. I identified what I thought were the two or three best. We realized we could stitch together a series of low cost intuitive tools that collectively address everyone’s mapping needs.We settled on Fulcrum, QGIS, and Carto as our core CHM workflow tools. We started with pilot projects at the University of Hawaii and the Urban Indian Health Institute in Seattle. Showing people how to use these tools via a train-the-trainer approach ended up working really well.You are a QGIS expert. When did you first begin using QGIS?Kurt: QGIS was started in 2002 and I began playing with it in 2005. I just discovered it from
 a listserv. At first it was very limited, being little more than a data viewer. But I was really curious to see how it might evolve, so I started following it. It really started becoming a useful alternative in 2010. I gradually migrated to it with my business. I also started teaching GIS classes with it. I used to keep a list of things you could do with ArcGIS that you couldn't in QGIS. Now it's come so far that I have a list of things you can do in QGIS that you can't in ArcGIS!How has CHM evolved?Kurt: Once we realized we had something that would be useful to people, we began looking for partner organizations. These are organizations who work with data and can benefit from mapping, but lack the resources to get started. We conduct workshops and webinars to get people started down the mapping path.Along the way I thought a blog would be a really helpful tool to keep people up to date with new technology. These tools are constantly improving and I thought this would be a way to share these enhancements with everyone. Later we realized we needed additional resources for people to continue to build their skills after the initial workshops. I developed a series of six labs covering the mapping tools in more detail. These labs were inspired from a separate project I worked on called the GeoAcademy. This is a complete college curriculum for teaching GIS using open source tools. It even won an award!
 Our primary goal for CHM has always been to provide tools that are helpful to users. After years of trying to build something from scratch, we are now finally gaining some traction with CHM. It feels like a snowball, rolling downhill and gaining speed. I believe it is both because the tools are powerful and intuitive, plus we are getting better at identifying potential users.Would you recount one experience with CHM that felt especially influential for CHM’s progress so far? Kurt: Yes the first thing that comes to mind is the work with the Medical University of
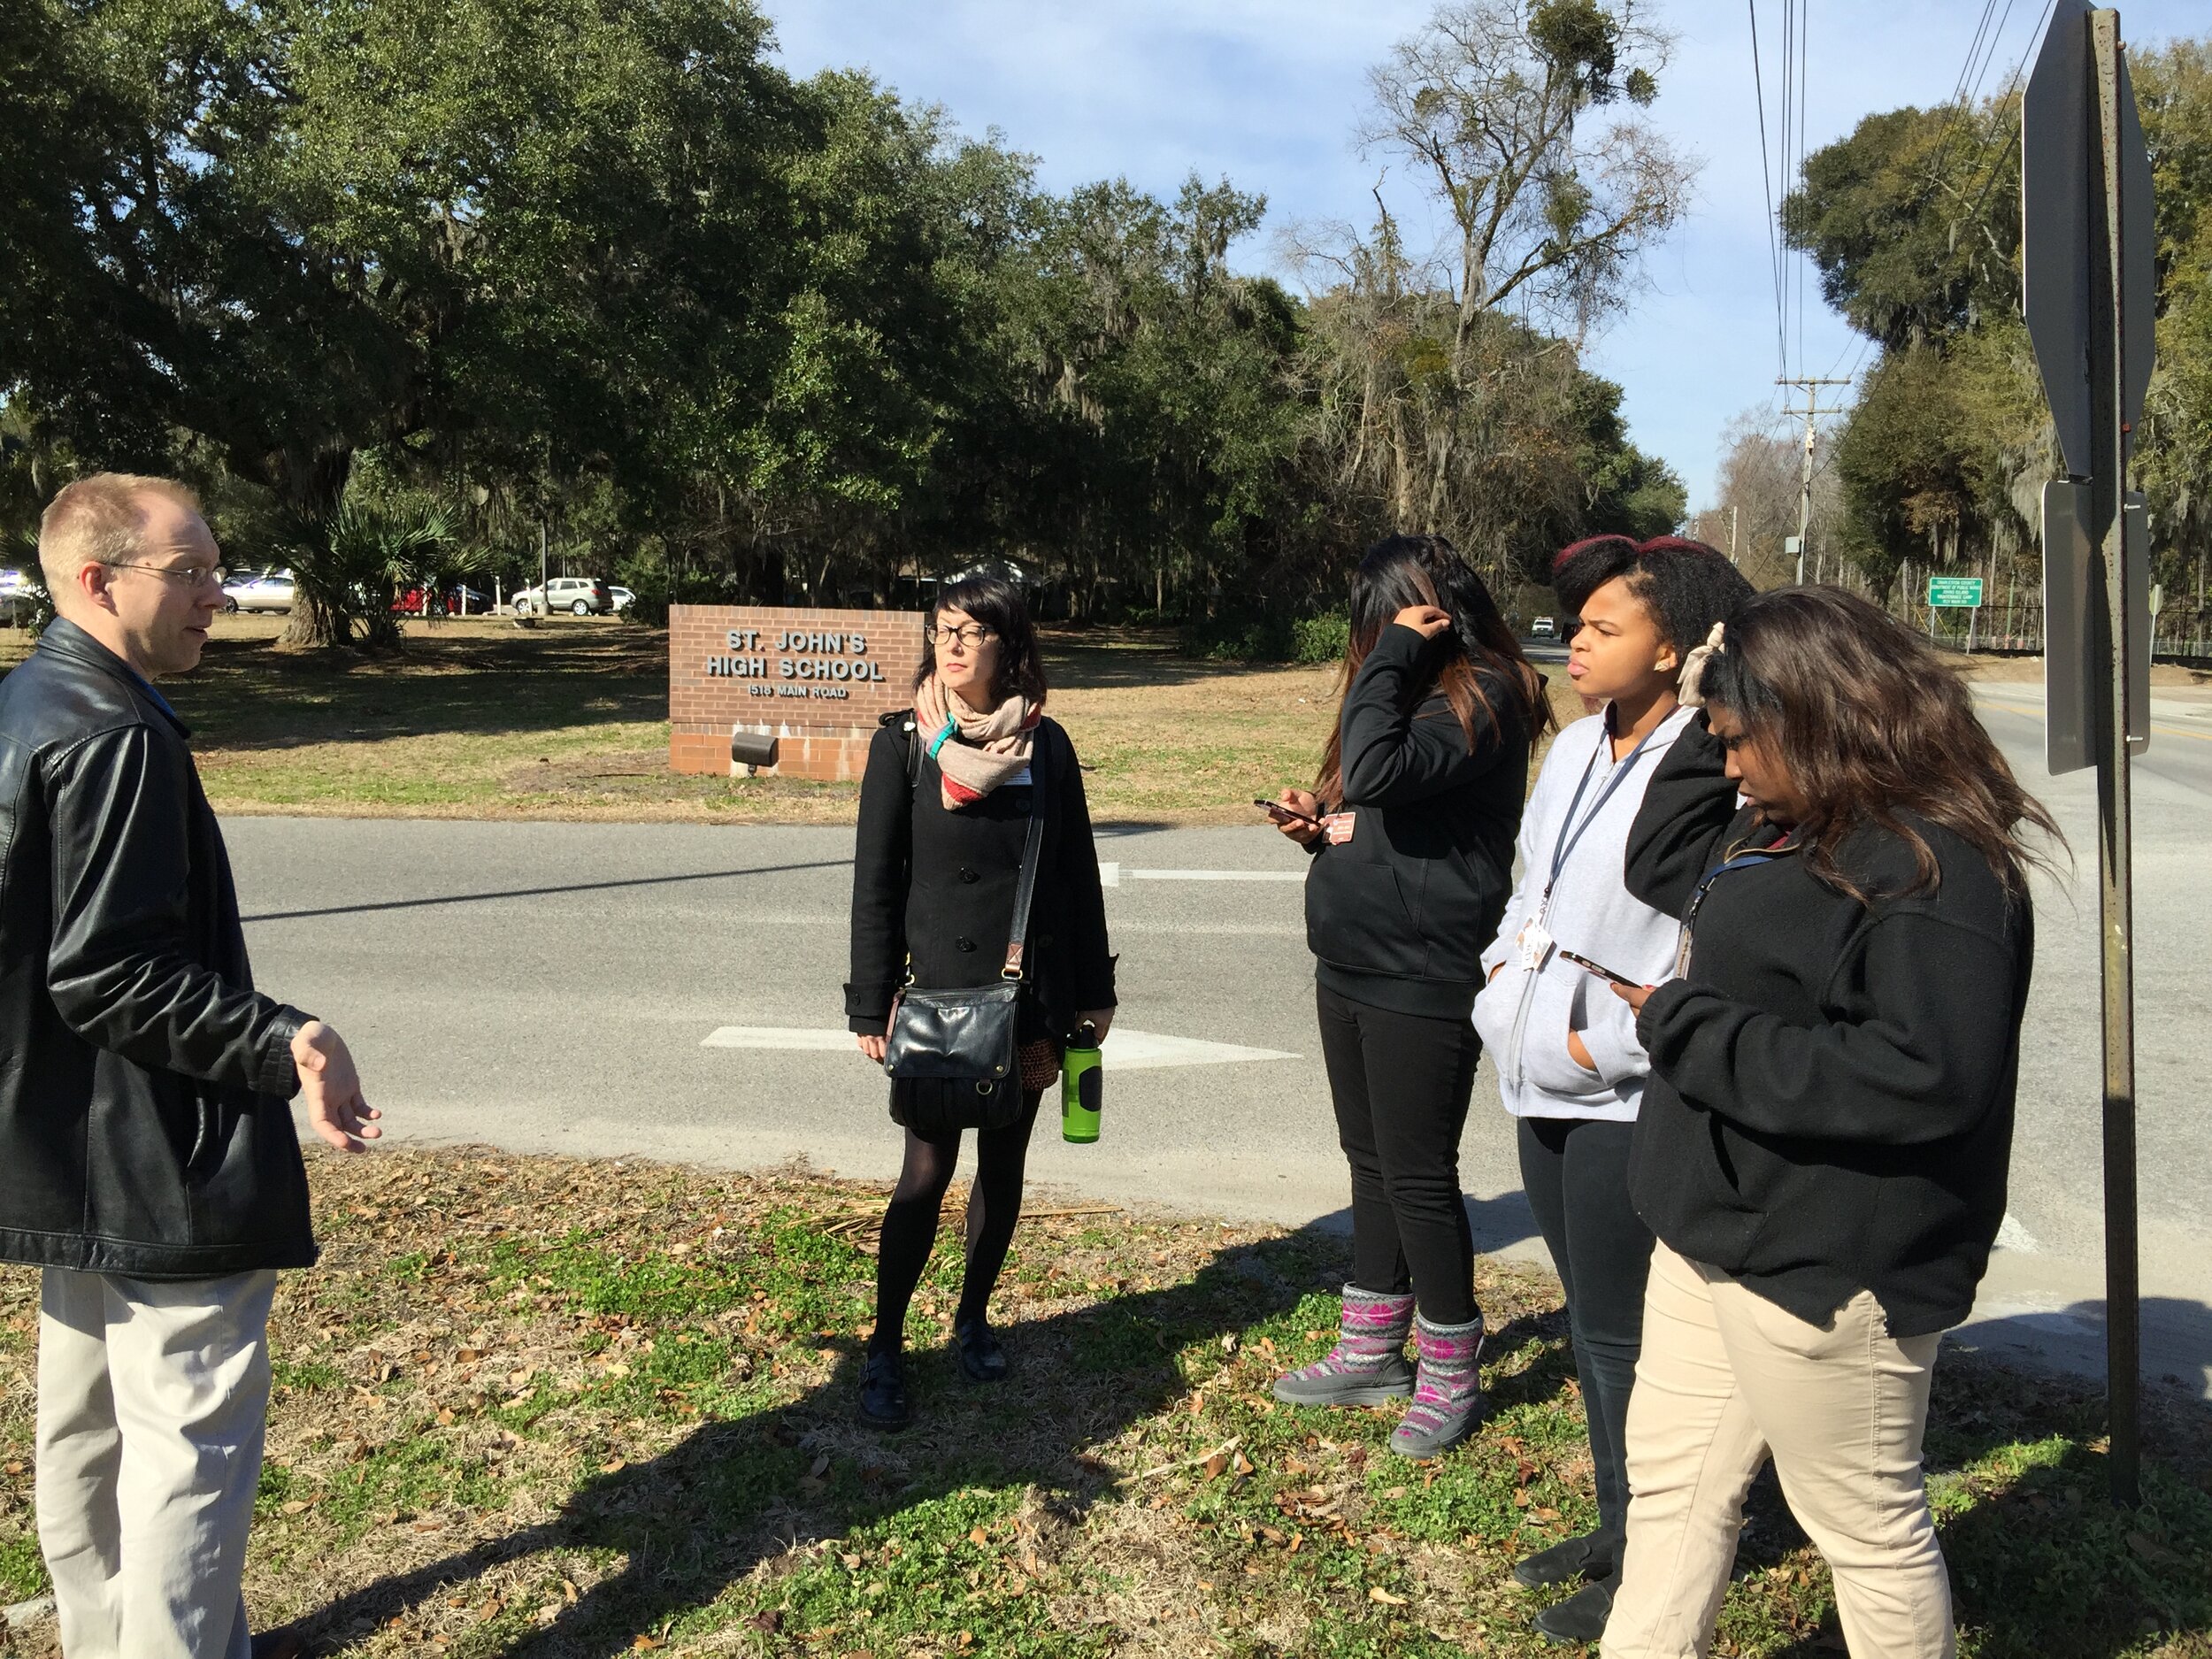 South Carolina (MUSC). In early 2015 I taught a CHM workshop to 8 people. The training went well. No one in attendance had ever worked with any type of mapping software before. Yet I was able to show them how to make a data collection form, collect points, and map the data in Carto. The next day I went to a high school on John’s Island and taught several students over their lunch break how to collect data. They picked up on it immediately and spent the semester mapping food and water locations on the island.Months later, the MUSC participants were so excited by the possibilities that they asked me to come back. This second training had 25 people. Later that year we came back for a third workshop, and 80 people from across MUSC attended! That I could show such a large group, how to work with these tools in a half day was a real proof of concept!
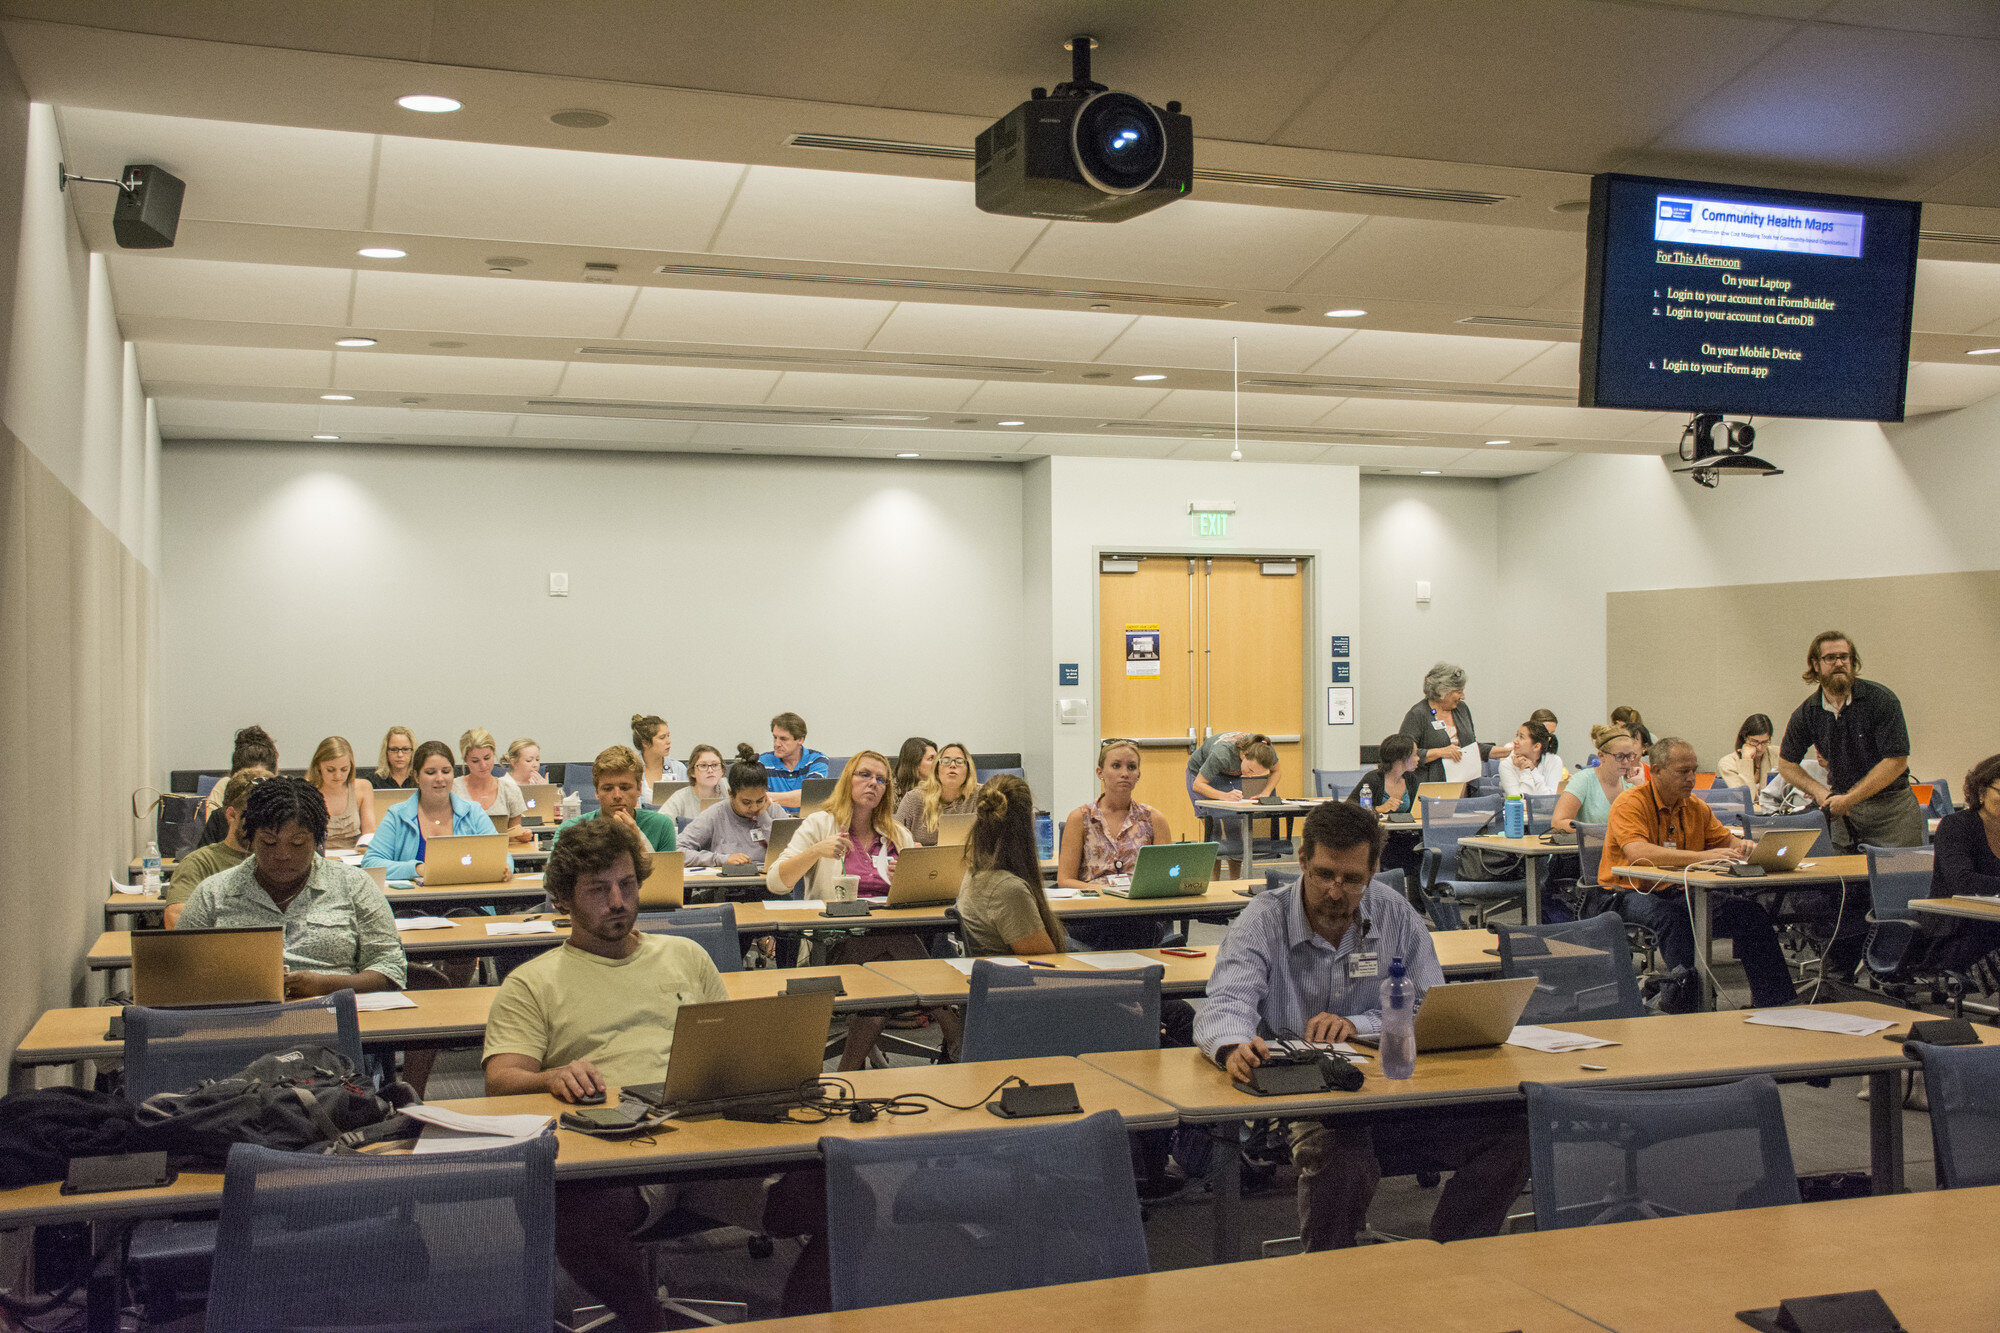 Several projects were inspired these MUSC workshops. Of particular note is Dr. Bryan Heckman’s smoking cessation research project. I must point out that Dr. Deb Williamson and Dana Burshell worked to organize and plan the MUSC trainings and deserve most of the credit for the turnout.Our successful trainings with MUSC have served as a model for teaching bigger groups such as those at the CHM Symposium at the National Library of Medicine in June, 2016 and recent trainings in Seattle.
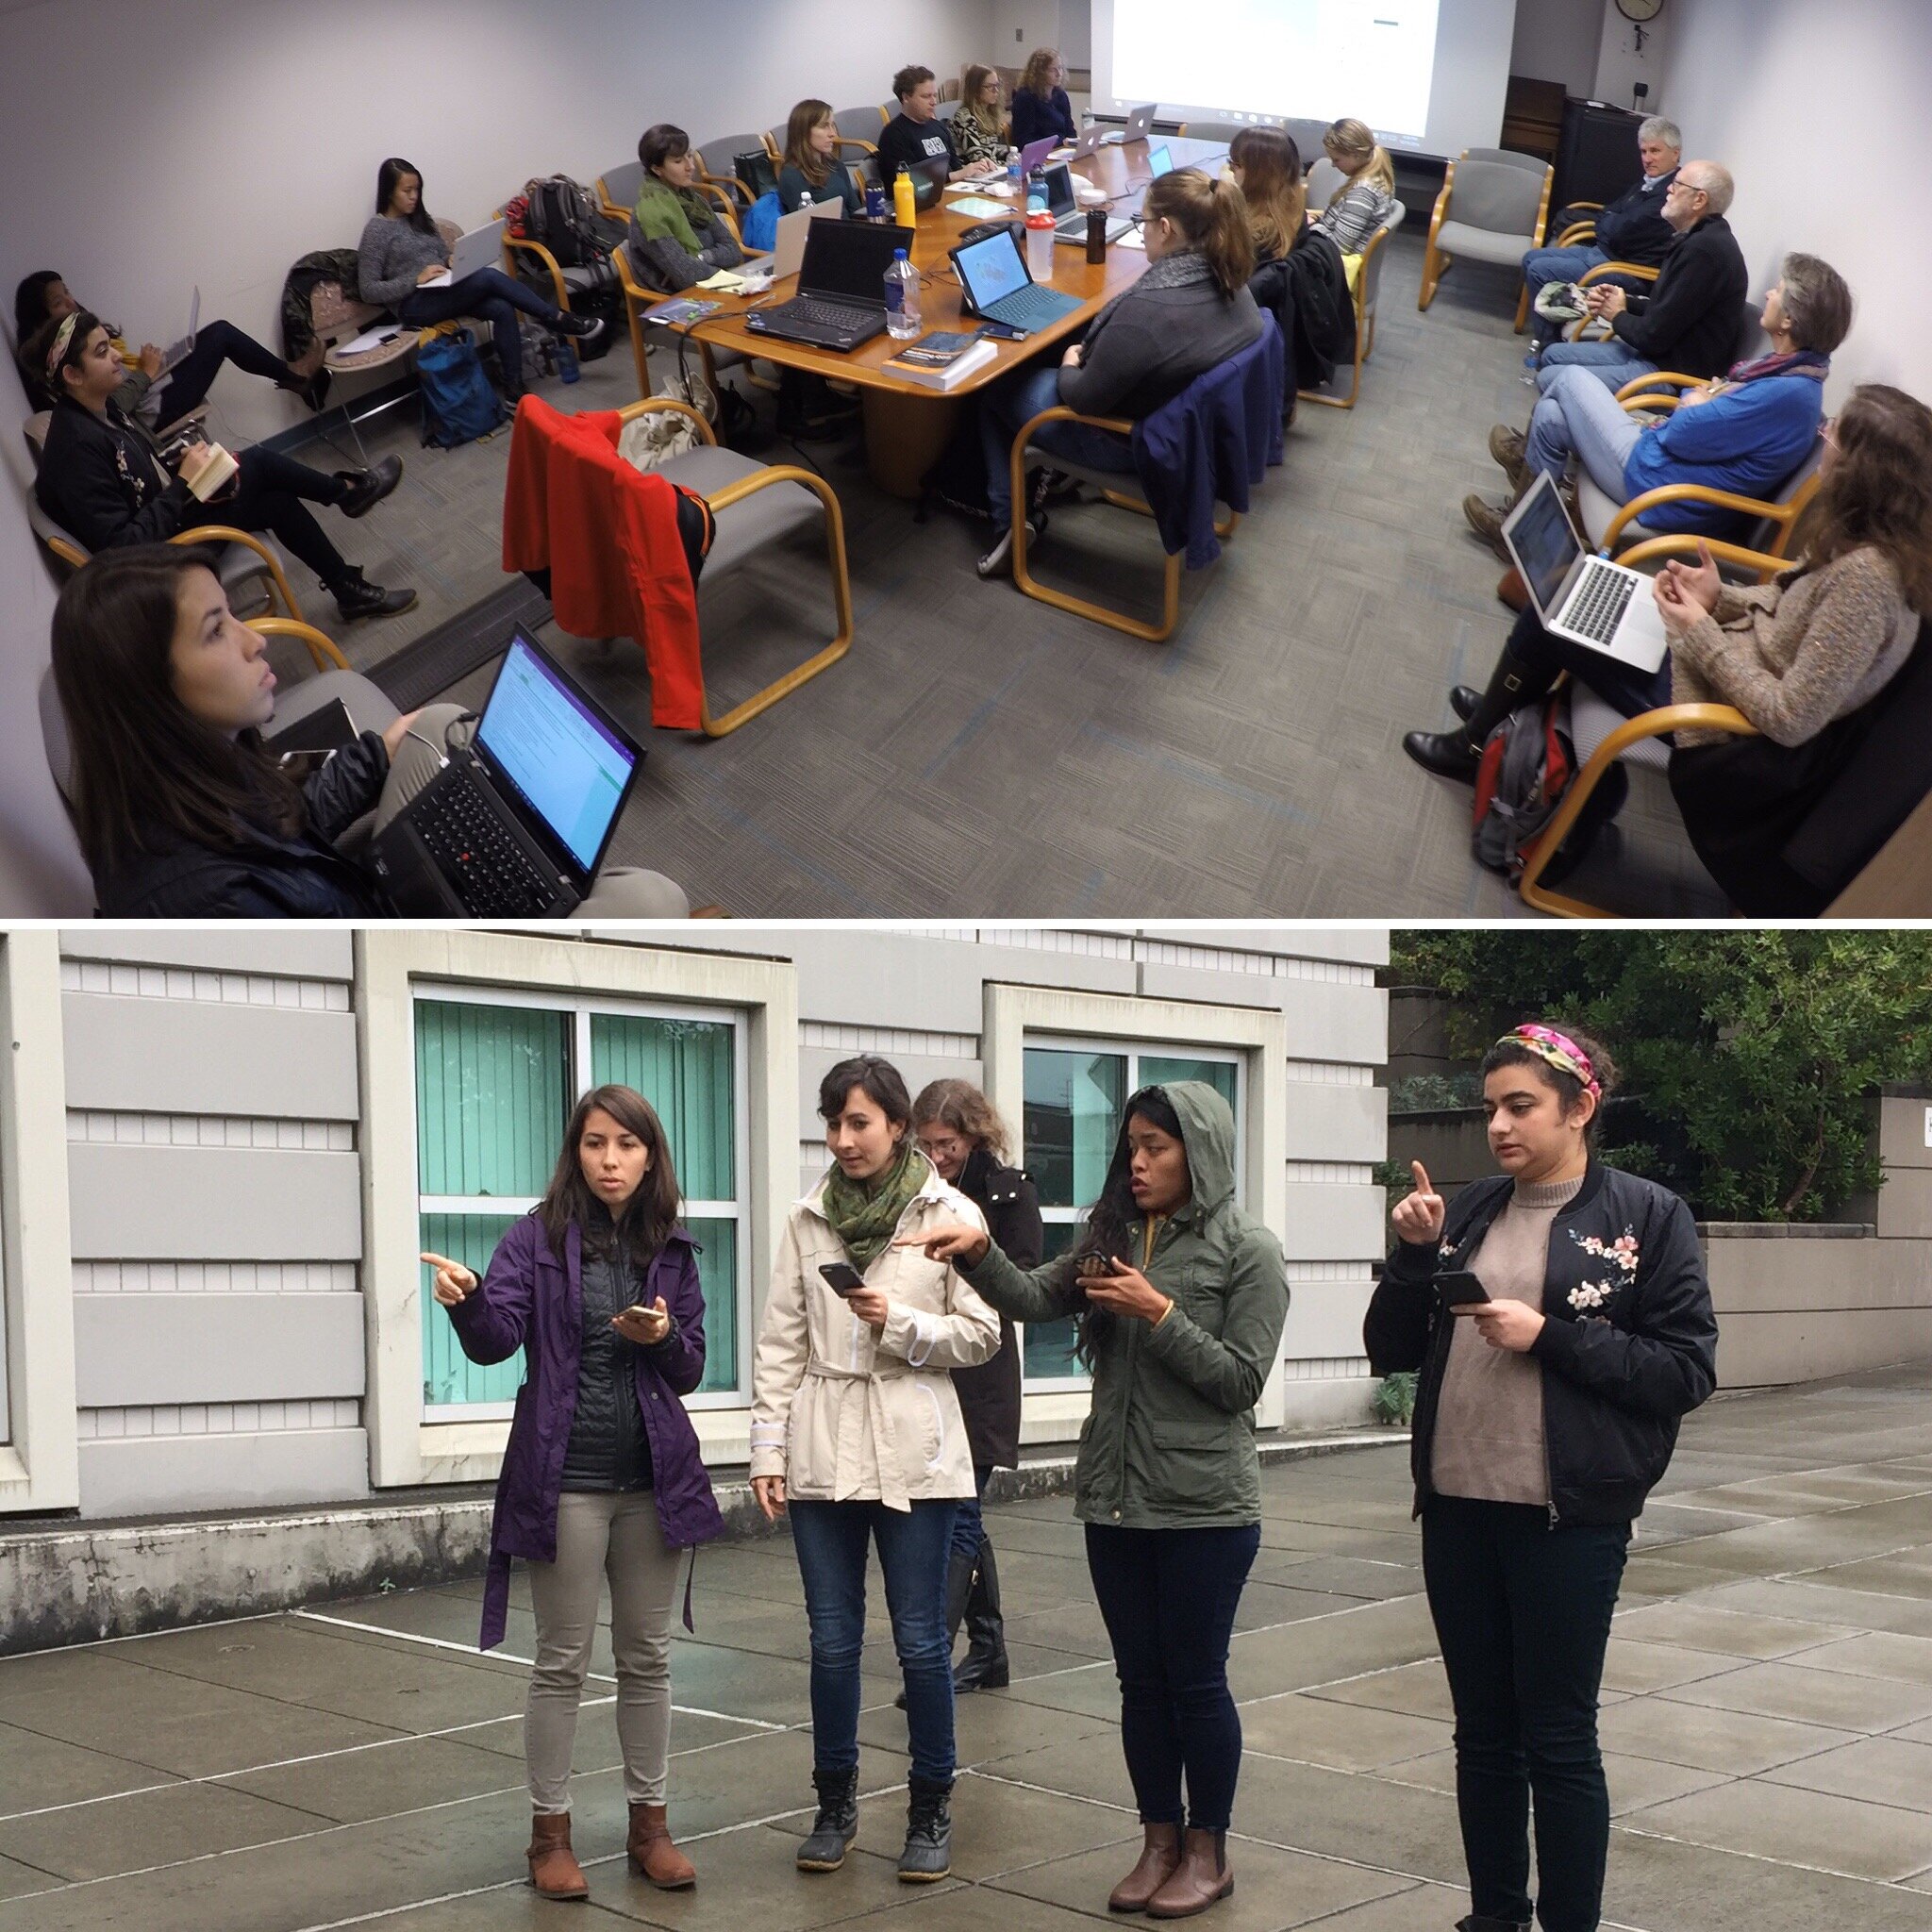 The most gratifying aspect of these workshops was seeing people shed their technological insecurities. It’s common for people to show up and admit they’re scared of the technology. To then see in a few short hours, they are getting it all to work, and actually getting excited about the possibilities, is a beautiful thing. What are your plans for the future of CHM? Kurt: The work that people are doing right now with CHM barely scratches the surface in terms of the potential. I would like to get more community members involved. I envision a scenario where there is an organization can really engage with citizens to map the community. The data could be managed by a central data manager in the organization. It would be such a great way to involve the community in a project directly related to their healthcare.I’d also like to see someone get past the initial data gathering and map making phase. QGIS has a lot of spatial analysis capabilities. I’d like to see someone push beyond the CHM labs and do some interesting analyses in QGIS or use some of the cool data visualization techniques in Carto.What advice you would give to new CHM users?Kurt: Don’t be afraid to dive in and use the tools. Be adventurous and creative with your projects. Don’t be afraid to mess up. That’s how you learn. There is no limit to the kinds of things you can accomplish with mapping and spatial analysis tools. If you can imagine it, it can be done.
CHM Conducts Three Workshops in Maryland
Last week Kurt Menke traveled to Maryland. Two workshops were held at the Prince Georges County Department of Social Services for people working on homeless issues. All attendees were novices to mapping technology. However, in the first hour they all built a data collection form in Fulcrum and went outside to collect some data around the building.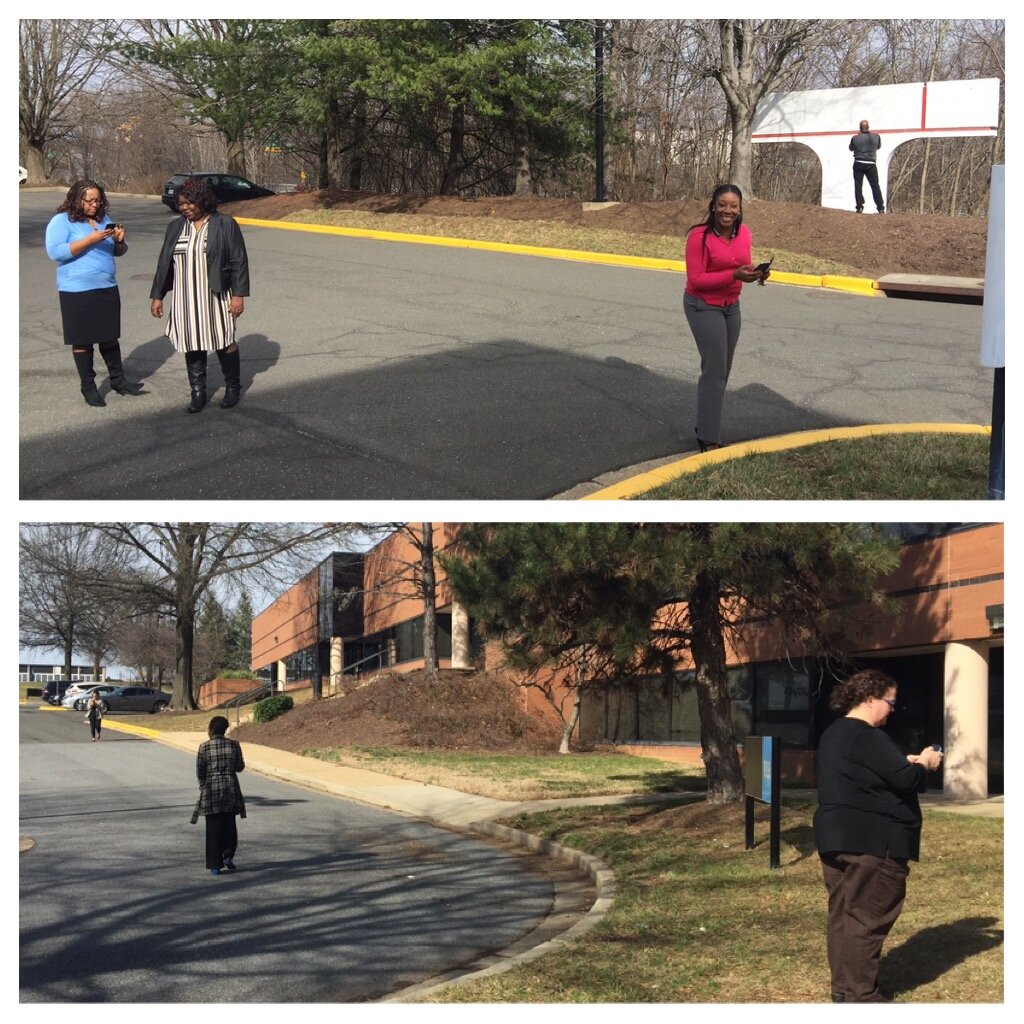 The attendees represented a variety of organizations including many working with YouthREACH Maryland. REACH is an acronym standing for Reach out, Engage, Assist, & Count to end Homelessness. It is an effort to obtain accurate, detailed information on the number, characteristics, and needs of unaccompanied homeless youth in Maryland. Other organizations represented at these workshops included:
- Maryland's Commitment to Veterans
- Maryland Department of Planning
- Prince Georges Community College
- St Ann's Center for Children, Youth, and Familes
- Maryland Multicultural Youth Center
- So Others Can Keep Striving (S.O.C.K.S)
- Sasha Bruce Youthwork
- Lifestyles of Maryland.
In the final two hours of the workshops attendees learned how to map the data they collected in both Carto and QGIS. We also had time for a brief discussion about how CHM could be used in their projects. There were a lot of ideas shared about how the technology could help community engagement.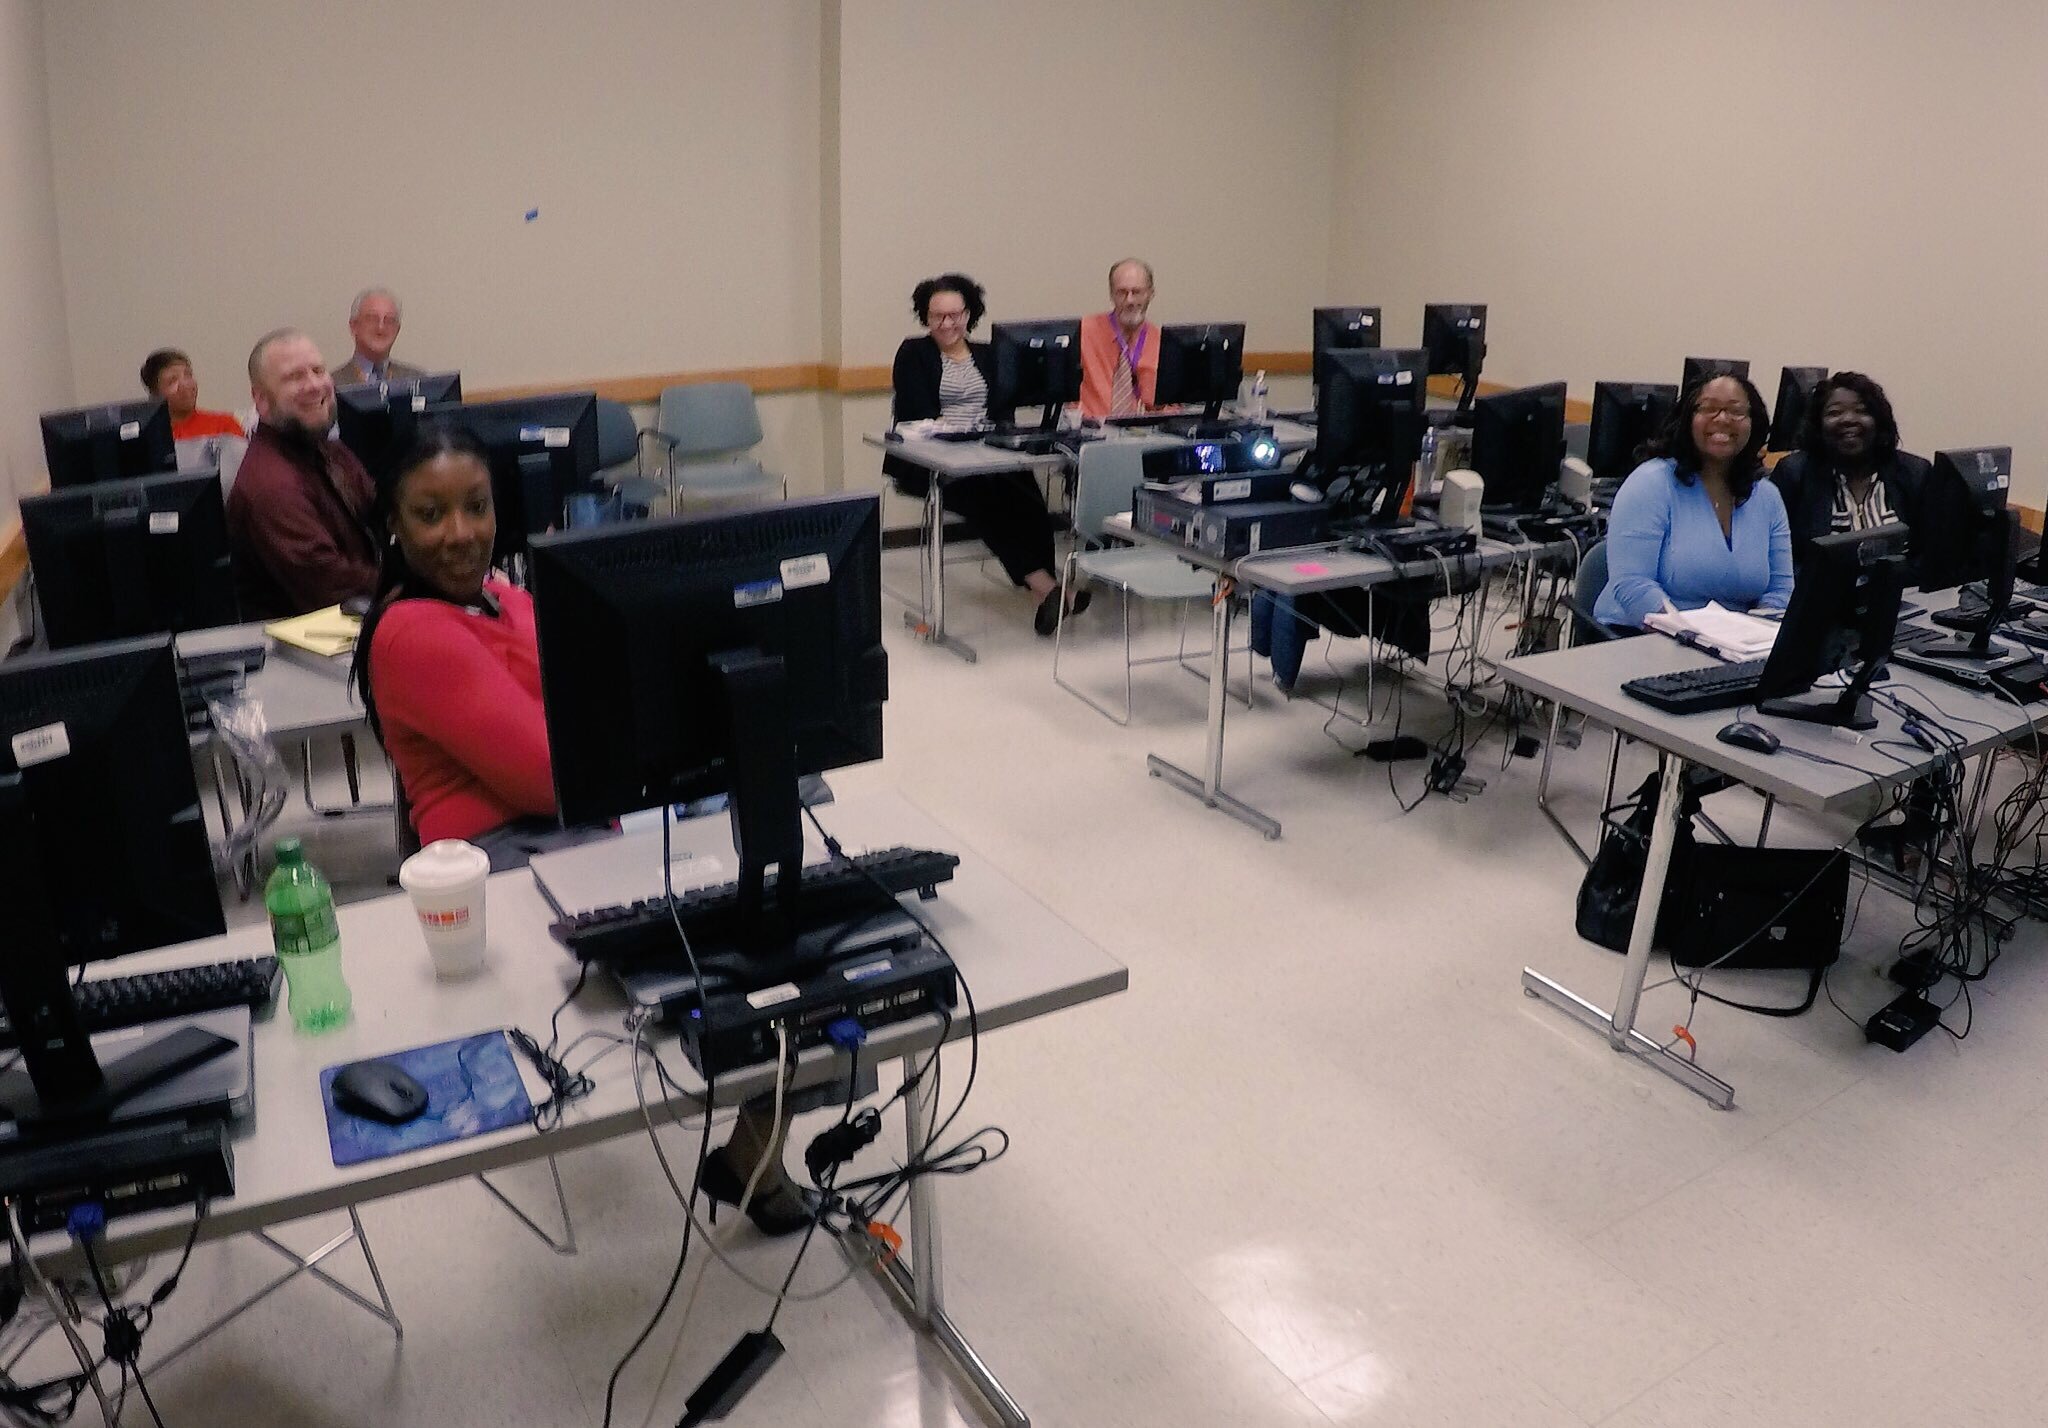 After the two PG County workshops, CHM traveled across the Chesapeake Bay bridge to Salisbury University on the eastern shore.
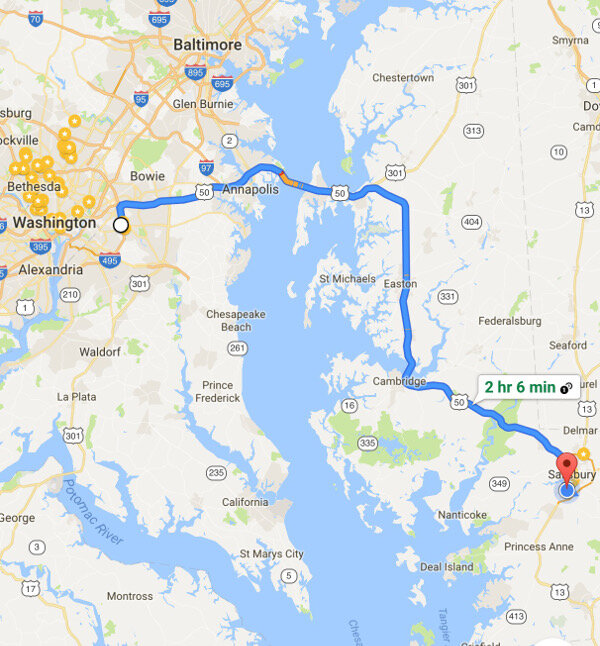 The following morning we held a workshop geared towards social work students at Salisbury University. Attendees went through the CHM workflow and were introduced to Fulcrum, Carto and QGIS. Below is a map of data collected around the student center in Carto.
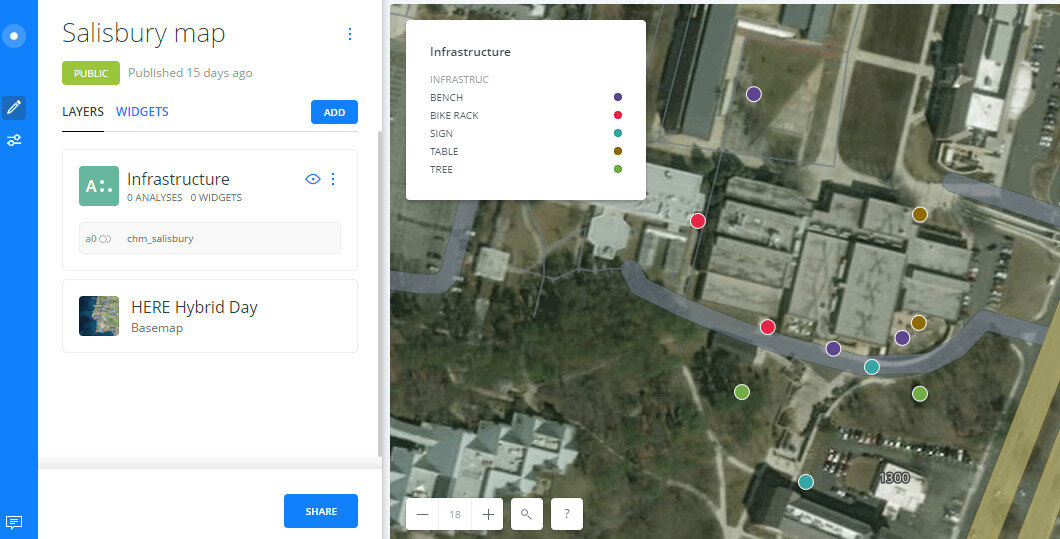 Salisbury University Data Collection in CartoThe workshop concluded with a short introduction to working with data in QGIS.
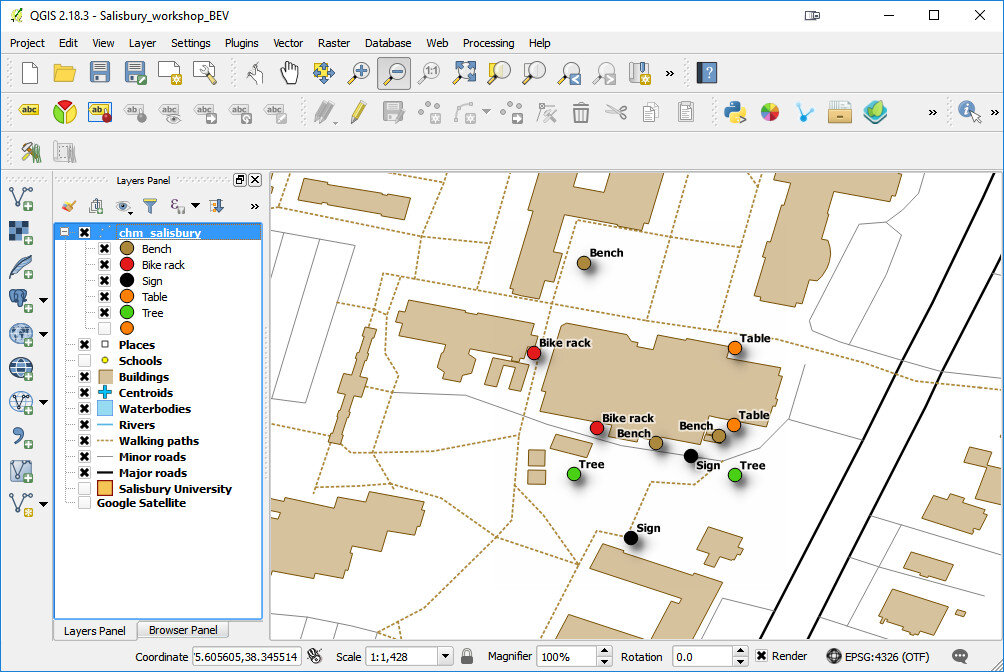 The next scheduled workshop for the Community Health Maps team will be at the Teaching Prevention 2017 Conference in Savannah, Georgia. That conference takes place from April 5-7th. If you are interested in learning this technology this workshop will be a great opportunity!
New Year Will Bring Updated Labs Including Lab Zero!
It has been 2 years since the Community Health Maps (CHM) lab exercises were first produced. Software changes quickly, and over the last two years the tools involved in the CHM workflow have undergone many changes. For example, this fall the pricing scheme for iForm changed. Though it is still a good product, this price increase puts it out of the category of low cost software. The companion site formhub.org no longer exists, making ODK Collect more difficult to work with. Fortunately Fulcrum is a fantastic alternative to those two data collection apps. QGIS has released 5 new versions and is now at version 2.18! CartoDb has been rebranded as Carto and has a new interface. All these changes means it is time for all the lab exercises to be updated. Lab 1 will now be a single lab for both iOS and Android users with Fulcrum. Labs 2-5 will be updated to QGIS 2.18. Lab 6 will be updated to Carto's new interface. The set of companion videos will also be redone and updated.Many have worked through these labs and some provided feedback. This information is being used to improve the labs as they are updated. One new item will be Lab Zero. While the CHM workflow is intuitive, it has been suggested that more background information could be useful. Lab Zero will be a companion reference document to the CHM labs. It will contain: A) information on the background of the CHM project, B) software installation instructions , C) a glossary of terms, D) more thorough descriptions of some technical topics like coordinate reference systems, E) a description of how to interact with the QGIS community to get additional help, and F) a list of data resources. This work is in progress and will be ready this spring. Stay tuned!
CHM Has a Busy Fall with Workshops and Storms!
We had a busy fall giving three workshops in September and October. First Community Health Maps traveled to Spokane Washington to conduct a half day technical workshop at the National Tribal Forum for Excellence in Community Health Practice.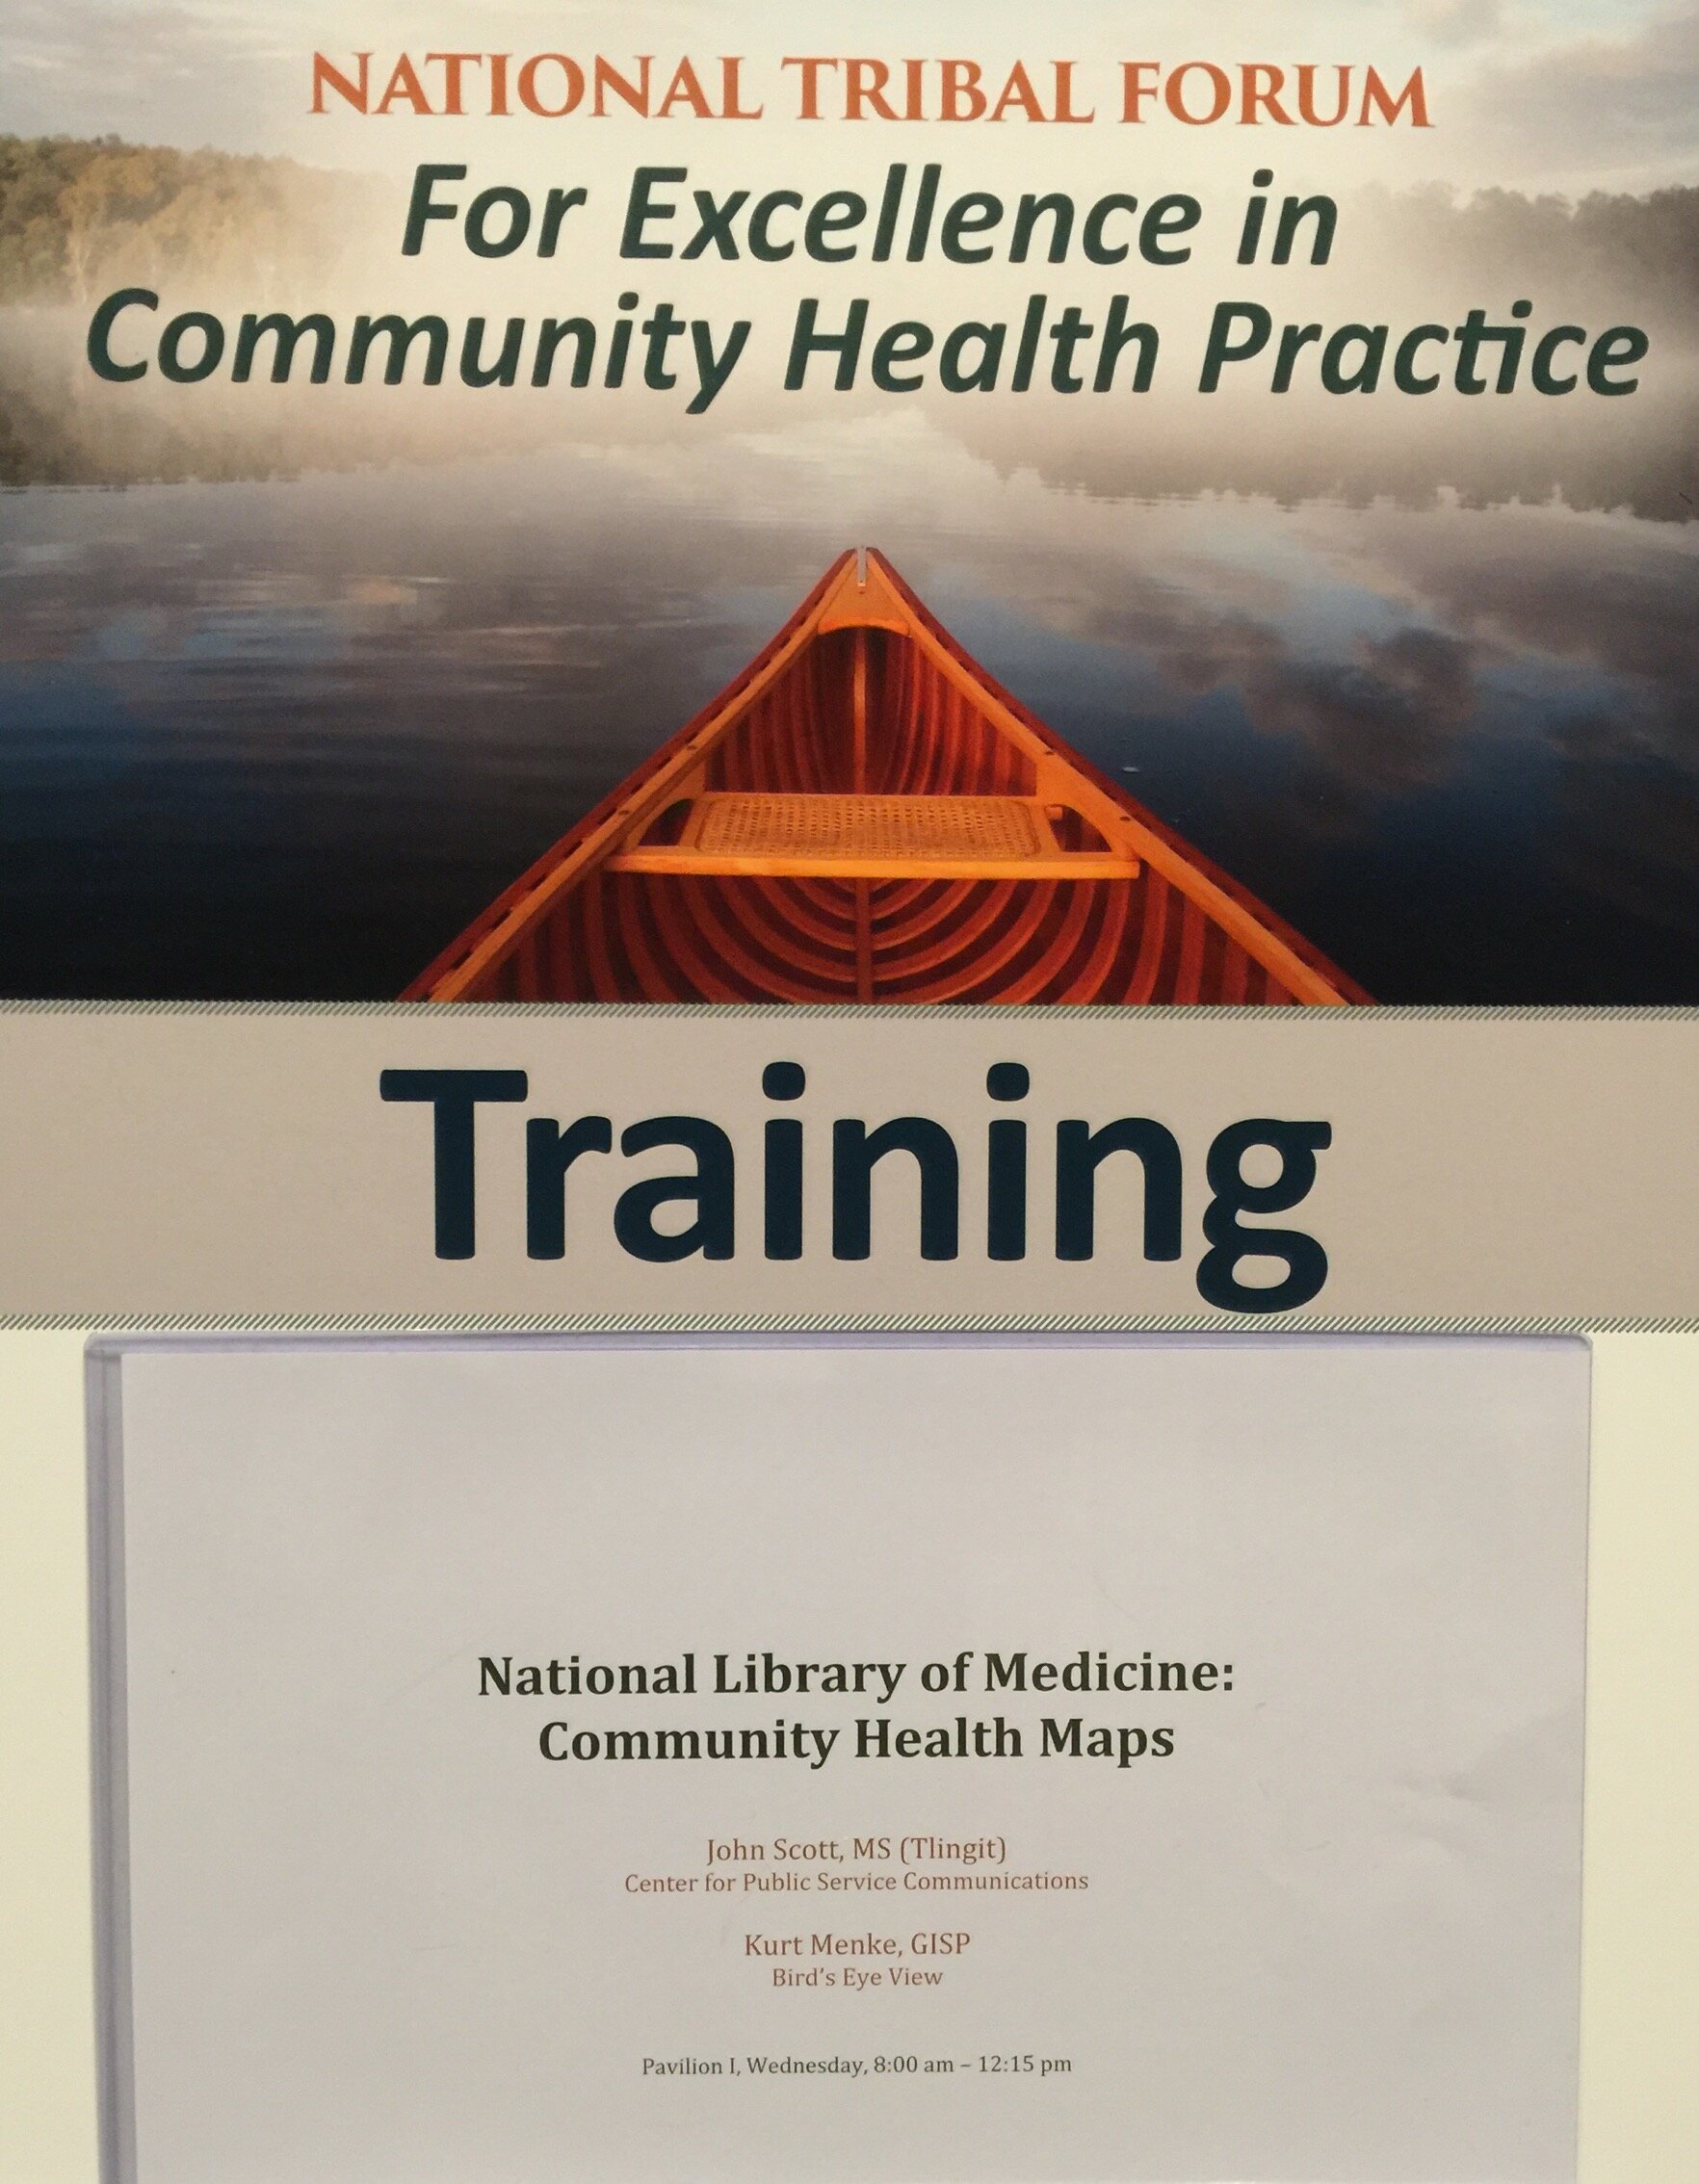 This event was organized by the Northwest Portland Area Indian Health Board and supported by the Robert Wood Johnson Foundation. We weren't certain who or how many would attend, and I expect attendees weren't entirely sure what Community Health Mapping was all about either. However, it turned out to be a very engaged group representing tribes from many regions of the country. Within a few hours everyone was able to:
- Create a field data collection form in Fulcrum
- Collect some data around the conference center on their smartphones/tablets
- Make a map of their data in Carto
- Learn how to bring the data into QGIS
This was a typical CHM workshop with most never having done any mapping work before. As such it was a very empowering experience for the participants to learn how to use this technology to map their community in just a few short hours.From there we traveled to Honolulu, Hawai'i to give a workshop organized by Papa Ola Lokahi. There were two hurricanes (Lester and Madeline) heading towards the islands. Fortunately they both veered off and didn't cause any damage or disruptions! The attendees came with a plethora of ideas on how mapping could fit into their work including:A) tracking scholarship recipients of the Native Hawaiian Health Scholarships program,B) supporting the Native Hawaiian Cancer Network,C) mapping Dr. Ben Young’s research on historical tracking of Native Hawaiian Health professionals,D) mapping Native Hawaiian Homelands to provide resource data to providers and community members, andE) use the CHM "train the trainer" model to increase ongoing trainings for service providers including community health outreach workers and patient community navigators in Hawai'i.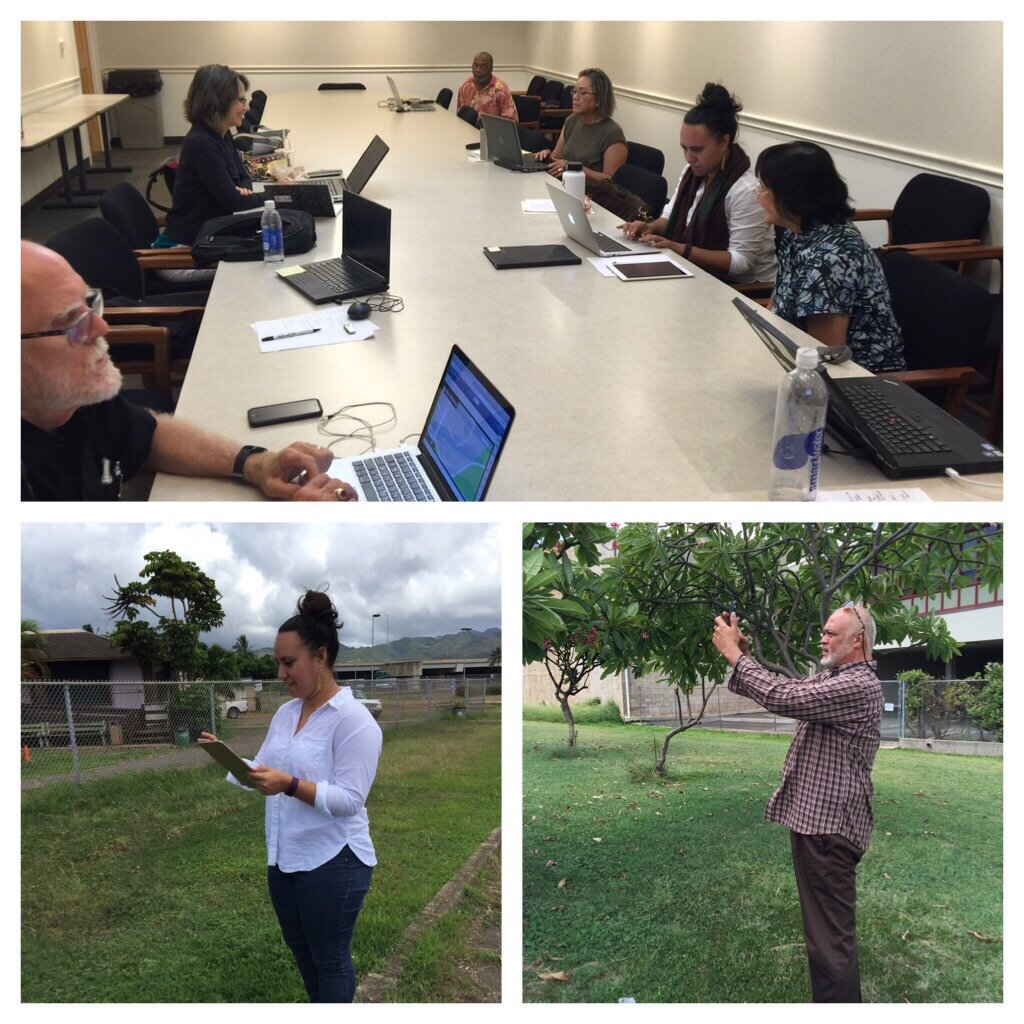 After a brief break we headed to Seattle, Washington, again there were two separate storms including, the remnants of Typhoon Songda, bearing down on the region threatening to disrupt power and services! Again fortunately the storms didn't make a direct hit on the area and the workshop proceeded on schedule.We went to train students in the capstone course of the Community Oriented Public Health Practice Program at the University of Washington. This is our second year supporting this program. The first year was a huge success with two students attending the APTR Conference and presenting their work.Like last year we had a full house with students eager to learn about community mapping. Both first year and second year students were in attendance. Several second year students will submit proposals for consideration, to receive a stipend and support for using Community Health Maps in their capstone projects. Jamie Smeland is the first of the group to be awarded the stipend for her capstone project entitled, "Honoring the Collective Wisdom: Documenting a Cross-Racial and Intergenerational Movement to Shift Power to Youth and Parent Leaders to Improve Educational and Health Outcomes for Students of Color in South Seattle & South King County." We look forward to working with these students in the coming months.
 In the near future we will be offering an updated set of Community Health Mapping labs and a platform for CHM webinars. Stay tuned! In the meantime if you are interested in Community Health Maps and/or receiving CHM training contact John Scott (jcscott at cpsc.com) for more details.
GIS as an Educational Tool at MUSC
Submitted by Jennifer RewolinskiDr. Deborah Williamson is an Associate Professor in the College of Nursing at the Medical University of South Carolina (MUSC), Charleston. Dr. Williamson, Community Health Maps (CHM) and MUSC have partnered in providing training that integrates GIS and CHM tools for a high school Teen Health Leadership Program. Dr. Williamson has worked with both community members and students.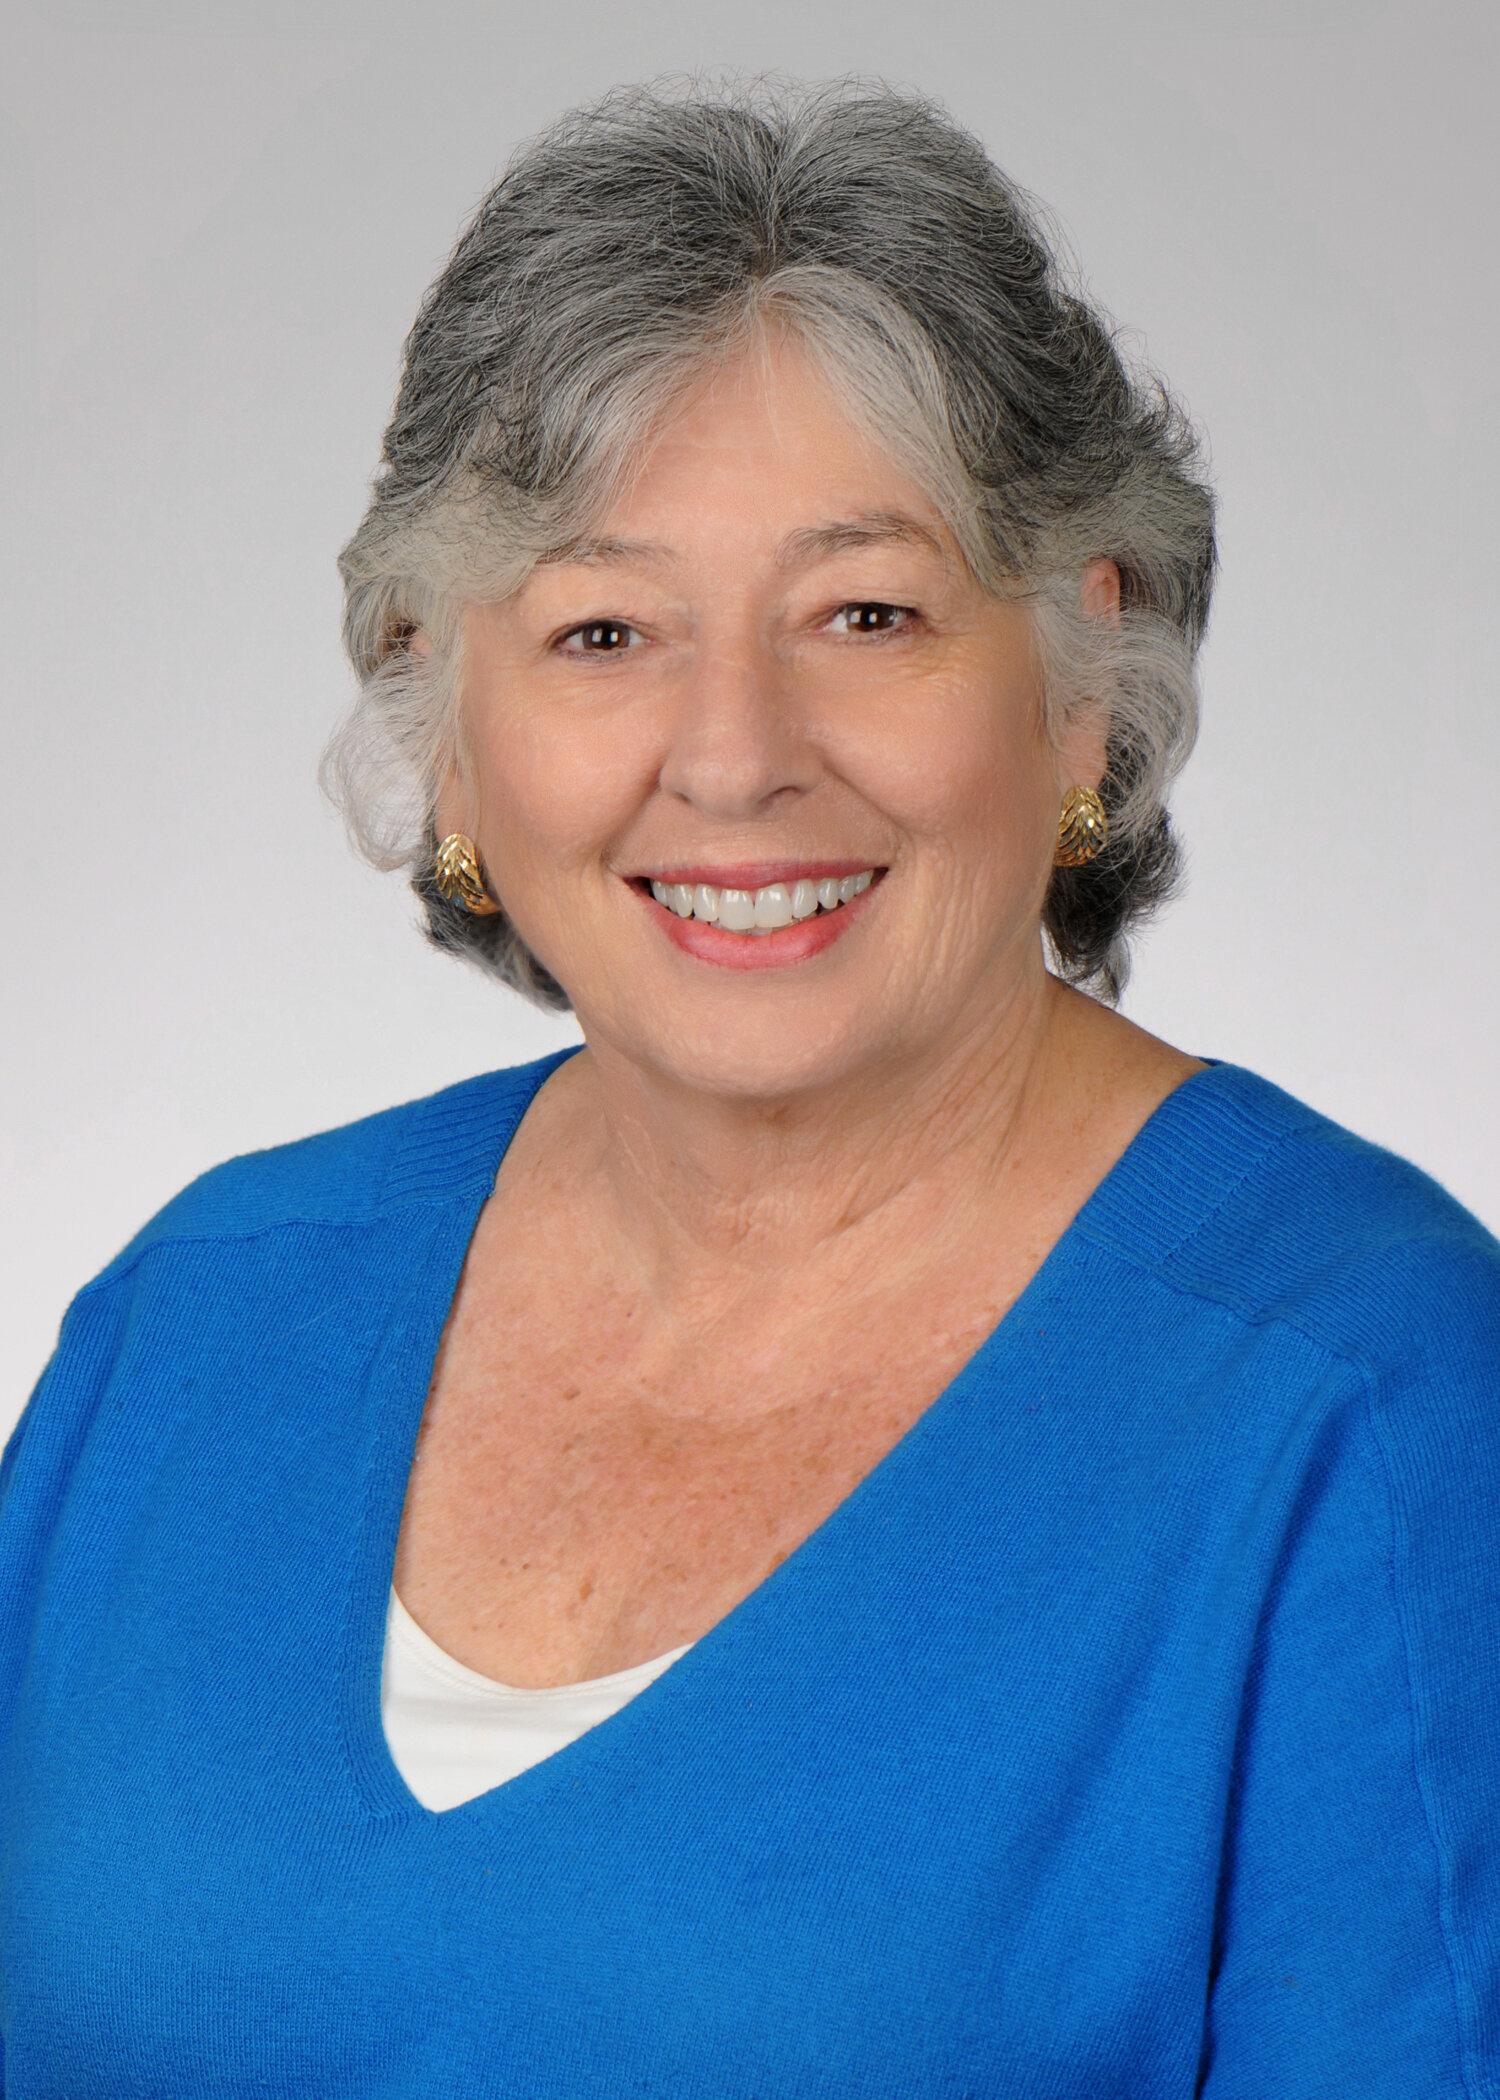 Dr. Williamson believes that, “GIS has the potential to substantially increase community engagement and is truly a concept of the neighborhood taking control of their data.” She notes that while researchers might study a community, that a community’s input is essential to understanding the cultural and environmental context surrounding health issues: “GIS mapping puts the community members on more of a level playing field with their research partners.” GIS can empower and educate community members to identify their key issues, to become a part of an analysis, and to provide solutions. When communities are given the opportunity to map their own health, discovery, and awareness, positive changes can result. When a community feels it has more of a say through engagement with GIS, or communication with a map, intervention is more likely to be effective.For the past three semesters, Dr. Williamson has used GIS in her own classroom as a capstone project for population health students. They, “find it fun and can take it with them into other settings, it fits into the world of new technology, and it takes people to the next step of looking at health issues.” Mapping offers a different way to help students visualize Social Determinants of Health and to make the connection between what population health is, and the factors that promote or deter it.
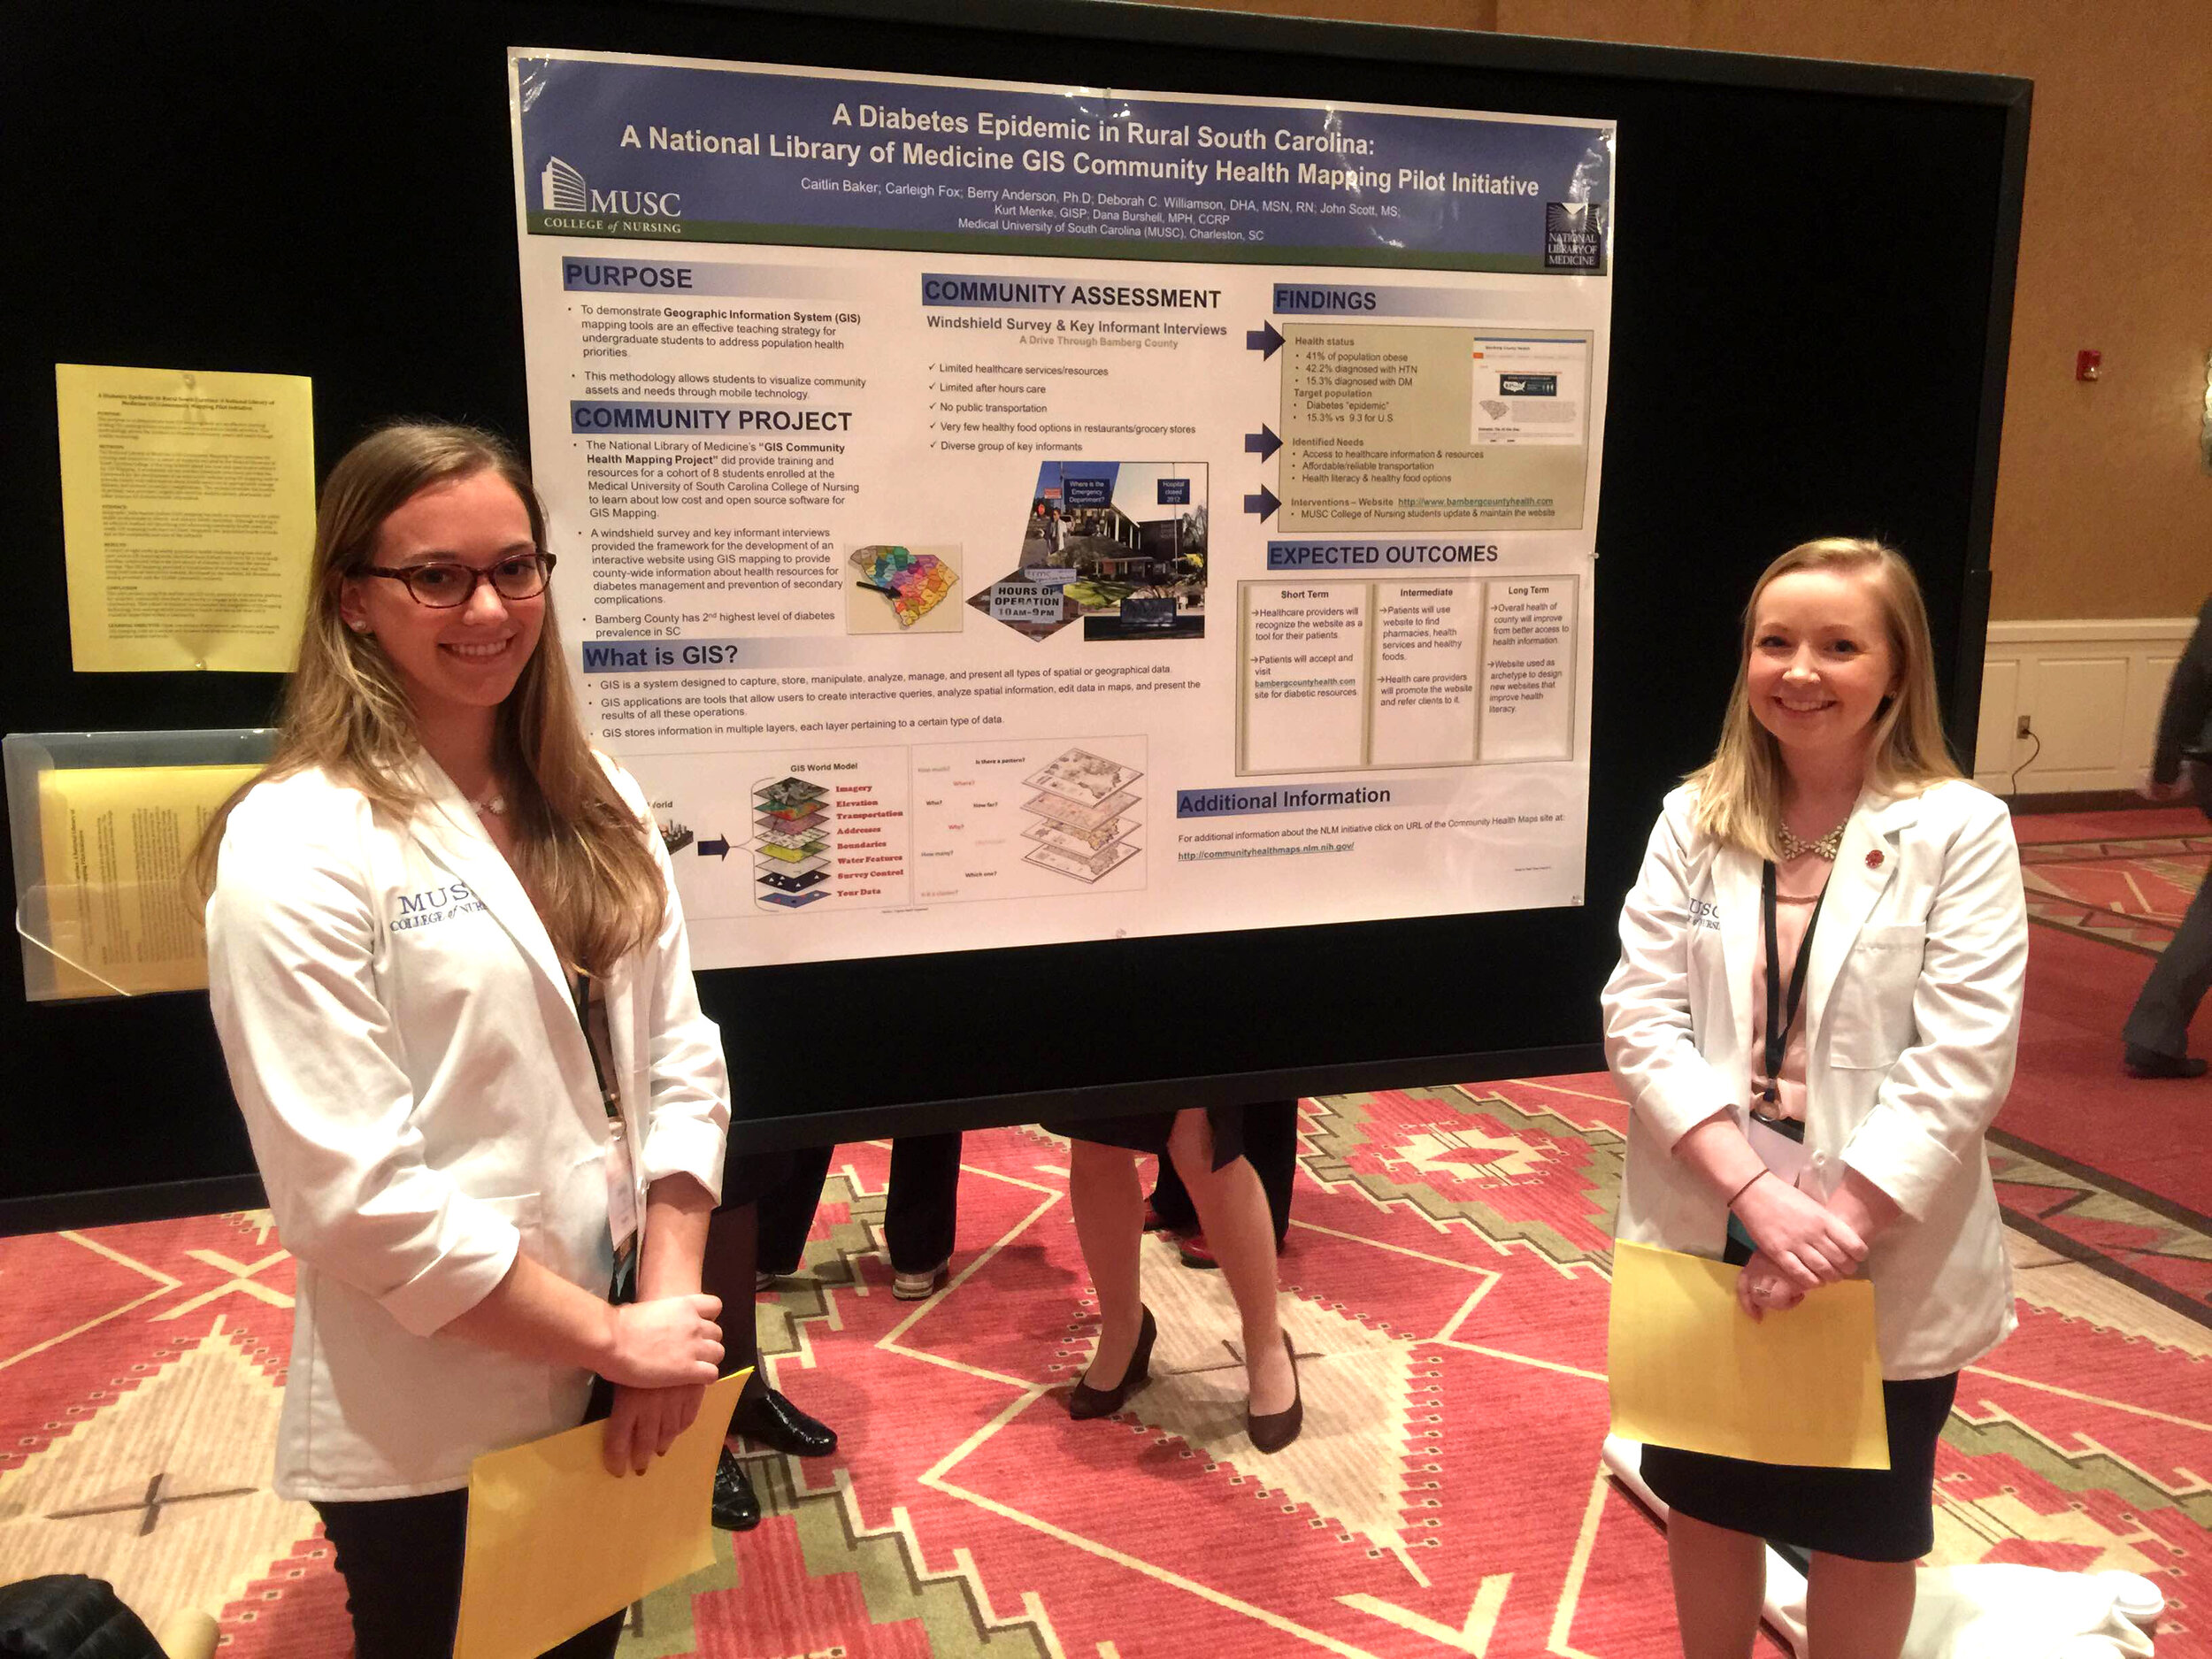 Finally, Dr. Williamson sees GIS as bi-directional: it supports visualizing gaps and assets while also providing the ability to disseminate and build on information via intervention programs to improve health outcomes and strengthen communities. GIS is also broadly applicable to almost any discipline and easily used by those with little expertise. “Presenting raw data to a community or students doesn’t mean a lot,” Dr. Williamson comments, “but when that same data is aggregated visually it instantly communicates a message to any audience.” GIS is clearly suitable as an effective educational tool in the classroom and in communities.CHM thanks Dr. Williamson for her continued collaboration and time spent advancing the CHM program through use of the CHM tools at MUSC. CHM values our partnership with MUSC and hope that the future is as mutually beneficial as the past few years.Field data collection for the CHM workflow bridges the divide between learning in a classroom and experiencing conditions in a community. For the capstone project, students use CHM labs and parts of the CHM workflow, including phone data collection with iForm or Fulcrum, integration of the data into QGIS, and presenting the data with Carto or Google Maps. Dr. Williamson’s students often upload their data from iForm to Google Maps because of its familiarity and easy access.One student project involved identifying migrant camps as a community in need, and assessing the community through surveys and key informant interviews. When the data showed that migrant workers often lack knowledge of health information and access to healthcare services, students mapped locations of migrant camps near Charleston, SC in relation to urgent care facilities and shared the data with the migrant outreach workers from a local community health center. Later, an intervention was developed to provide hands on CPR and first aid instruction to 60 workers. This project displays successful application of CHM tools in an educational and community context resulting in an intervention that may offer real change.
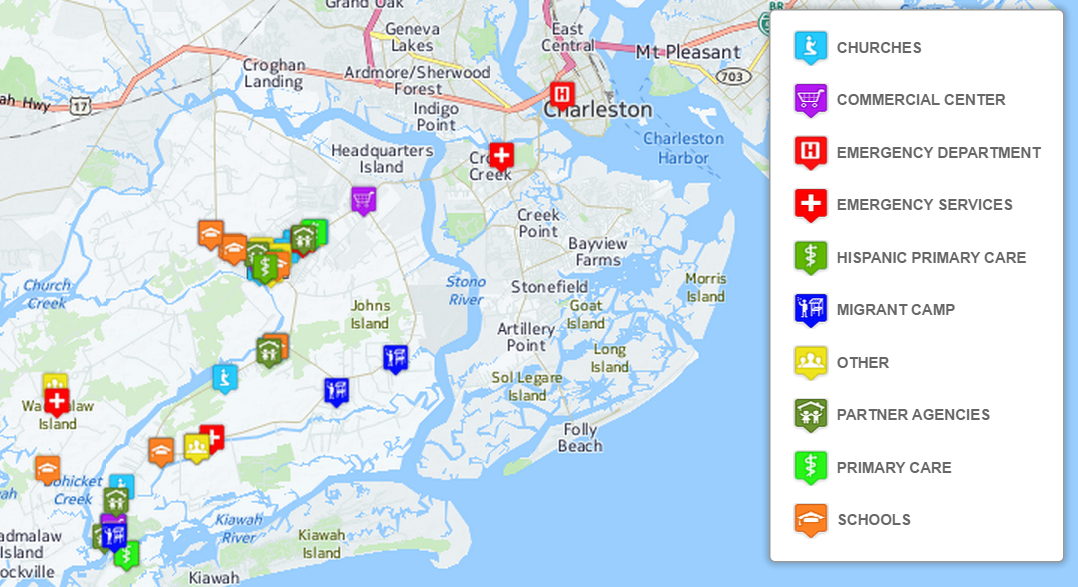
Visualizing an Intervention for Tobacco Control
Submitted by Jennifer Rewolinski
Dr. Heckman, an assistant professor of psychiatry and behavioral sciences at the Medical University of South Carolina (MUSC) in Charleston, used Community Health Maps (CHM) tools in his research on tobacco control. Smoking is the leading preventable cause of death worldwide and costs the US $130 billion in direct medical costs annually. Smoking is still a major public health issue that influences mortality, morbidity, healthcare costs, the environment, and quality of life.
Dr. Bryan Heckman
The outcome of Dr. Heckman’s precision medicine project will be a mobile app that aids smokers who recently quit by alerting them of proximity to stores which sell cigarettes or alternative nicotine products. Studies show that greater tobacco retailer density is associated with greater incidence of relapse; Dr. Heckman believes that mapping provides a new approach to visualizing environmental factors. A CHM training event at MUSC spurred his decision to integrate mapping into his own work using the CHM labs as a guide. These labs provide step-by-step instructions for implementing the CHM workflow. He used the data collection app Fulcrum on an iPhone to collect information on retailers: GPS coordinates, type, type of tobacco products sold, e-cigarette advertising, and photos. His team also used a high-powered Trimble GPS device to test accuracy of phone GPS, and the accuracy of phone GPS was adequate and more cost effective than more expensive GPS devices.
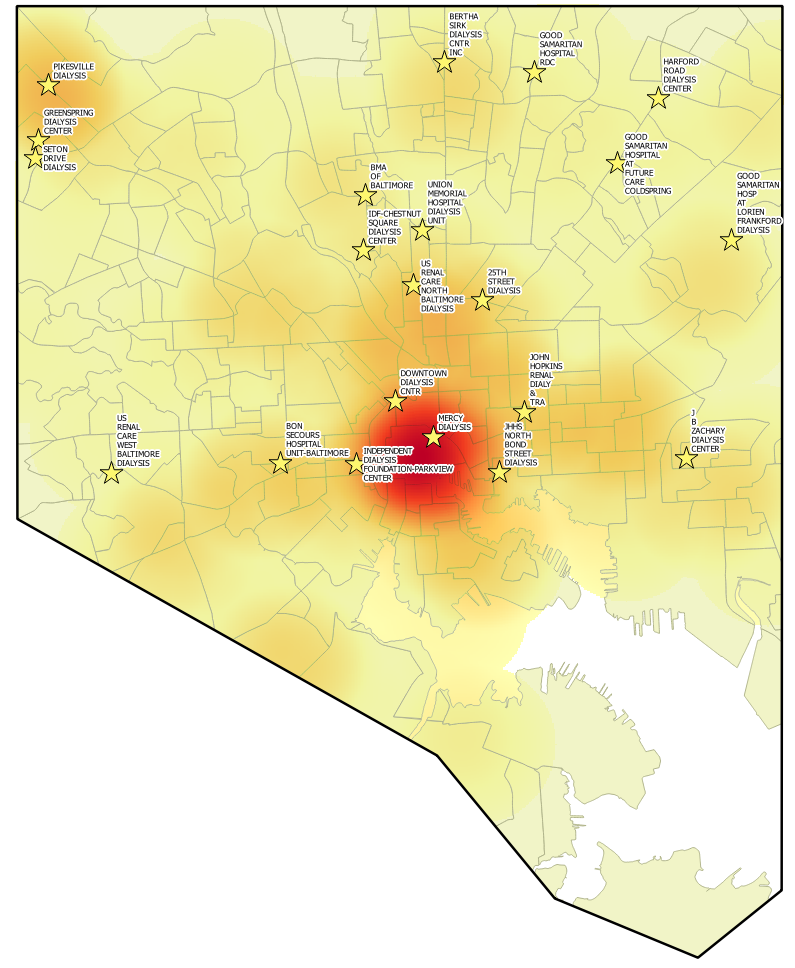
Figure 1. Dr. Heckman’s in progress map shows higher numbers of tobacco retailers are associated with Census Tracts that have both higher poverty and a higher percentage of minority populations.
Dr. Heckman integrated his Fulcrum data into QGIS software. He added national datasets from the American Community Survey and Behavior Risk Factor Surveillance System for Census tract data, and Synar for retailer data to check the validity of the Fulcrum data; field data collection with Fulcrum revealed a more accurate list of current retailers than the national secondary datasets provided. Dr. Heckman believes QGIS is a powerful tool with many features; he was not only able to use QGIS to monitor and visualize his research questions but also to guide his project decisions and hypotheses. His results will guide policy recommendations, improve access to care, and deliver novel interventions.
Figure 2. Dr. Heckman’s in progress map shows higher numbers of tobacco retailers are associated with Census Tracts with higher percentages of minority populations
For those attempting to undertake a health GIS project on their own, Dr. Heckman emphasized that all the tools needed are provided on the CHM blog; only time and patience are required. He also recommends asking for help and reaching out to other CHM users who have experience. Dr. Heckman’s project has the potential to affect behavior change and reduce health disparities via a mobile intervention app which identifies nearby tobacco retailers and prompts and provides an intervention and awareness of a health issue. Dr. Heckman’s experience is an example of how the CHM blog and tools might be used.
Dr. Heckman would like to thank Kurt Menke and the CHM team, Dr. Williamson from MUSC, and his mentors for inspiration and growth. He would also like to acknowledge the Hollings Cancer Center and American Cancer Society Institutional Research Grant that helps support his work, and Alex Hirsch for his help coordinating the project.
The CHM team would like to extend their own gratitude to Dr. Heckman as they sincerely appreciate his time and his support of the CHM blog.
CHM Workshop at the National Tribal Forum in Spokane, WA
This week the Community Health Maps team is heading to Spokane, Washington to teach a workshop at the National Tribal Forum for Excellence in Community Health Practice! We are honored to participate and engage a new community of mappers. It is a four hour workshop and by the end attendees will have:
- Built their own data collection form in Fulcrum
- Gone outside and collected some points
- Made an online map of what they collected in Carto
- Learned how to work with QGIS!
We'll report back on how it goes when we return. Stay tuned!
CartoDB Rebranded as Carto
Community Health Maps has long recommended the use of CartoDB for those interested in low cost online mapping and data visualization. In fact, CHM caught the beginning of this wave because CartoDB wasn't even launched until 2012! Early last month (July 2016) CartoDB was rebranded as Carto, which includes a new logo. However, once you get beyond the new logo your current account page including your data and maps remains unchanged. You can still build maps the way you always have in what is now known as Carto Editor.
 The main difference is that Carto now offers up a new interface named Carto Builder. The good news for Community Health Mappers is that their goal with Carto Builder is to introduce an updated interface. One that still does not require complex geospatial skills and programming. With Carto Builder they aim to make Location Intelligence (LI) more accessible to more people. This means it will give you point and click access to deeper analysis of your data. Builder will have all the functionality currently found in Editor along with the new tools.Eventually Carto Editor will be phased out and Carto Builder will be the interface everyone uses. You can request early access to Carto Builder here: http://go.carto.com/request-beta-access. New users of Carto will be given access the the Carto Builder in phases, over the next several months. All existing maps and data will be seamlessly migrated to the new interface. The following page answers Frequently Asked Questions about the migration from Editor to Builder: https://carto.com/docs/carto-builder/faqs/Once the migration is complete I will post about the new functionality. Stay tuned!
So What is Open Source Exactly?
This term ‘Open Source’ pops up in discussions about Community Health Maps and the blog and I realize many may not really know what it means. That’s OK, I’m going to explain it here. From both licensing and software development perspectives, there are two broad categories of computer software: proprietary and open source. The figure below shows some examples of both types. Proprietary Software Proprietary software is created and sold by a corporation. They create software and sell it to make a profit. When purchasing it you may also be paying for the privilege to get help and support using the software. Or you may have to pay extra for that privilege. Two examples of proprietary software are Microsoft Office and Esri’s ArcGIS. There is also a license that accompanies a proprietary software package. When you purchase software, you are actually just buying a license that gives you the rights to operate the software. You never actually own the software itself. That software license will restrict use in some way:
- the number of computers you are allowed to install the software onto,
- the time period that the software will operate, and
- the number of features you are licensed to use.
Open Source SoftwareOpen source software (OSS), on the other hand, is created by a community of software developers (programmers). It is created to solve a common problem and is made available freely for everyone’s use. Open Office, Android and QGIS are examples. Open source software also comes with a license. That license tends to grant rights to users. For example:
- The freedom to run the software for any purpose.
- The freedom to study how the software works.
- The freedom to redistribute copies so you can help your neighbor.
- The freedom to improve the program.
Access to the source code may not be important to most, but the freedom to use the software as you see fit very well may be. Why Give it Away for Free?To many it is counter-intuitive for something of value to be given away for free. However, open source software development isn’t entirely altruistic. Most of these programmers work for companies providing services with the software. Those involved in an open source project simply feel that this is a better way to create software. There are several reasons for this:
- there are a lot of “eyes” on the code and bugs can be spotted and fixed quickly,
- having access to the source code let's you understand how the software is working, it's not a 'black box,'
- you are not locked into a particular vendors system, licensing scheme or software release schedule,
- you have the freedom to create any missing functionality that you need
- you benefit from the contributions of others and vice versa.
Making Money with OSSObviously you can provide services using OSS. However, there are other ways to make money with open source. Companies like Facebook, IBM, Sun, and Google are all heavily involved in open source. Let’s take the example of Google. They may be the world’s largest open source company. One of the keys to their business are vast server farms, which include several million servers. Google never would have been able to get their company off the ground if it weren’t for the Linux operating system. The cost of putting a proprietary operating system like Windows on all those servers would have been prohibitive. Now their open source Android operating system is the most popular on the market with a 66.5% market share. In another example, even Esri's ArcGIS includes some open source software components 'under the hood.' This is because some open source software licenses allow that software to be bundled with proprietary software and sold for profit.Any given open source software is considered a 'project' and they aren’t all user friendly and useful. You still have to determine if the software will meet your needs. An important aspect is getting help and support. Things to look for include a good online manual, ‘how-to’ books, and an active listserv.QGISLet’s take QGIS as an example. It has fantastic support. It has a great online manual, training material, case studies, sample maps, commercial support, email listservs, plus a number of 'how-to' books written by people who use QGIS. The QGIS project does not have a corporation behind it. It has about 30 independent but dedicated core developers. They work in a democratic fashion, voting on new features to be implemented. As an end user you can provide input with feature requests! With QGIS, if there is a feature you need that doesn’t exist, you can hire (sponsor) a programmer to create it. It then may become part of the core program or it may be written as a standalone plugin. That feature then becomes part of the software and everyone benefits. As a user of the software, you can easily contact someone involved in developing the software and ask questions and request features. With proprietary software you never have such direct access to the development team. You can also donate to the QGIS project. Your donation will pay for developers to fix bugs and implement new features. Beyond programming there are many ways people can contribute to a project like QGIS. You can report bugs when you encounter them, write and translate documentation, contribute a case study, and write books.SummaryOpen source is both a development methodology and a software license. In the end it is really impossible to say that a proprietary software like ArcGIS is better than the open source equivalent like QGIS or vice versa. You must decide if either works for you, and freedom and monetary cost may be part of that decision.End Note:There are a lot of acronyms in GIS and specifically open source GIS. Here are some you may encounter:FOSS = Free and Open Source. Historically there were two similar software movements, Free Software and Open Source software. They are so similar that they now are lumped together, and people simply use this acronym when talking about them.FOSS4G – Free and Open Source for Geospatial. This is free and open source software specifically for mapping. OsGeo (below) holds annual open source GIS conferences called FOSS4G. The next is coming up later this month in Bonn, Germany.OsGeo – Open Source Geospatial Foundation – this is a non-profit organization whose mission is to foster global adoption of open geospatial technology by being an inclusive software foundation devoted to an open philosophy and participatory community driven development. To be considered an OsGeo project a software must meet certain requirements. QGIS is a project under the OsGeo umbrella.
How Does Esri Software Fit into the CHM Workflow?
Community Health Maps (CHM) necessarily focuses on low cost and open source tools. This is because our goal is to find mapping tools that can be used by any community group, no matter the budget or resources. However, that doesn’t preclude people from using Esri software or other proprietary mapping tools too. One benefit of using Fulcrum for data collection, and QGIS for analysis and cartography, is that they both support a wide range of common GIS formats. This means that the data you’ve created via these two platforms can be easily brought into Esri’s ArcGIS software. Similarly if you have data you have created with Esri tools they can be brought into QGIS or Carto. This feature is known as 'interoperability' and QGIS is highly interoperable. For example, QGIS can work with shapefiles, Esri personal and file geodatabases, KML and over 100 other formats!From the outset we knew there were many scenarios for mapping software being used in public health and community organizations. For instance, there are larger organizations who are already using tools such as Esri’s ArcMap, ArcGIS Pro or ArcGIS Online. With this scenario there are still several reasons the CHM mapping tools could be useful.
- It might be that the organization doesn’t have enough Esri licenses for everyone in the office who’s interested in doing mapping work. In this case Fulcrum, QGIS or Carto could be used to fill the need.
- An organization may find that their Esri license doesn’t give them access to certain tools they need. They could use comparable tools in QGIS to fill the need, without having to pay extra license fees just for one or two extra tools.
- There may be smaller affiliated satellite groups that don’t share the same access to the software. In this case, these groups could use CHM suggested tools. Because of good interoperability they would then be able to provide data back to the central hub, where they could be incorporated seamlessly with the rest of the organizations data.
- There may be certain tasks that are easier and faster to do in one piece of software and others that are easier in another. For example, I use both ArcGIS and QGIS daily to do different things. Many beginners also find QGIS to be more intuitive. GIS is simply a tool and by incorporating QGIS you are giving yourself a bigger toolbox.
If you are in an organization using another software package don’t worry. The tools we are promoting as part of this project can be integrated quite seamlessly with your current tools. It doesn’t have to be Coke or Pepsi, or Ford or Chevy. You can have both!


