Education

CHM Has a Busy Fall with Workshops and Storms!

We had a busy fall giving three workshops in September and October. First Community Health Maps traveled to Spokane Washington to conduct a half day technical workshop at the National Tribal Forum for Excellence in Community Health Practice.img_1639This event was organized by the Northwest Portland Area Indian Health Board and supported by the Robert Wood Johnson Foundation. We weren't certain who or how many would attend, and I expect attendees weren't entirely sure what Community Health Mapping was all about either. However, it turned out to be a very engaged group representing tribes from many regions of the country. Within a few hours everyone was able to:
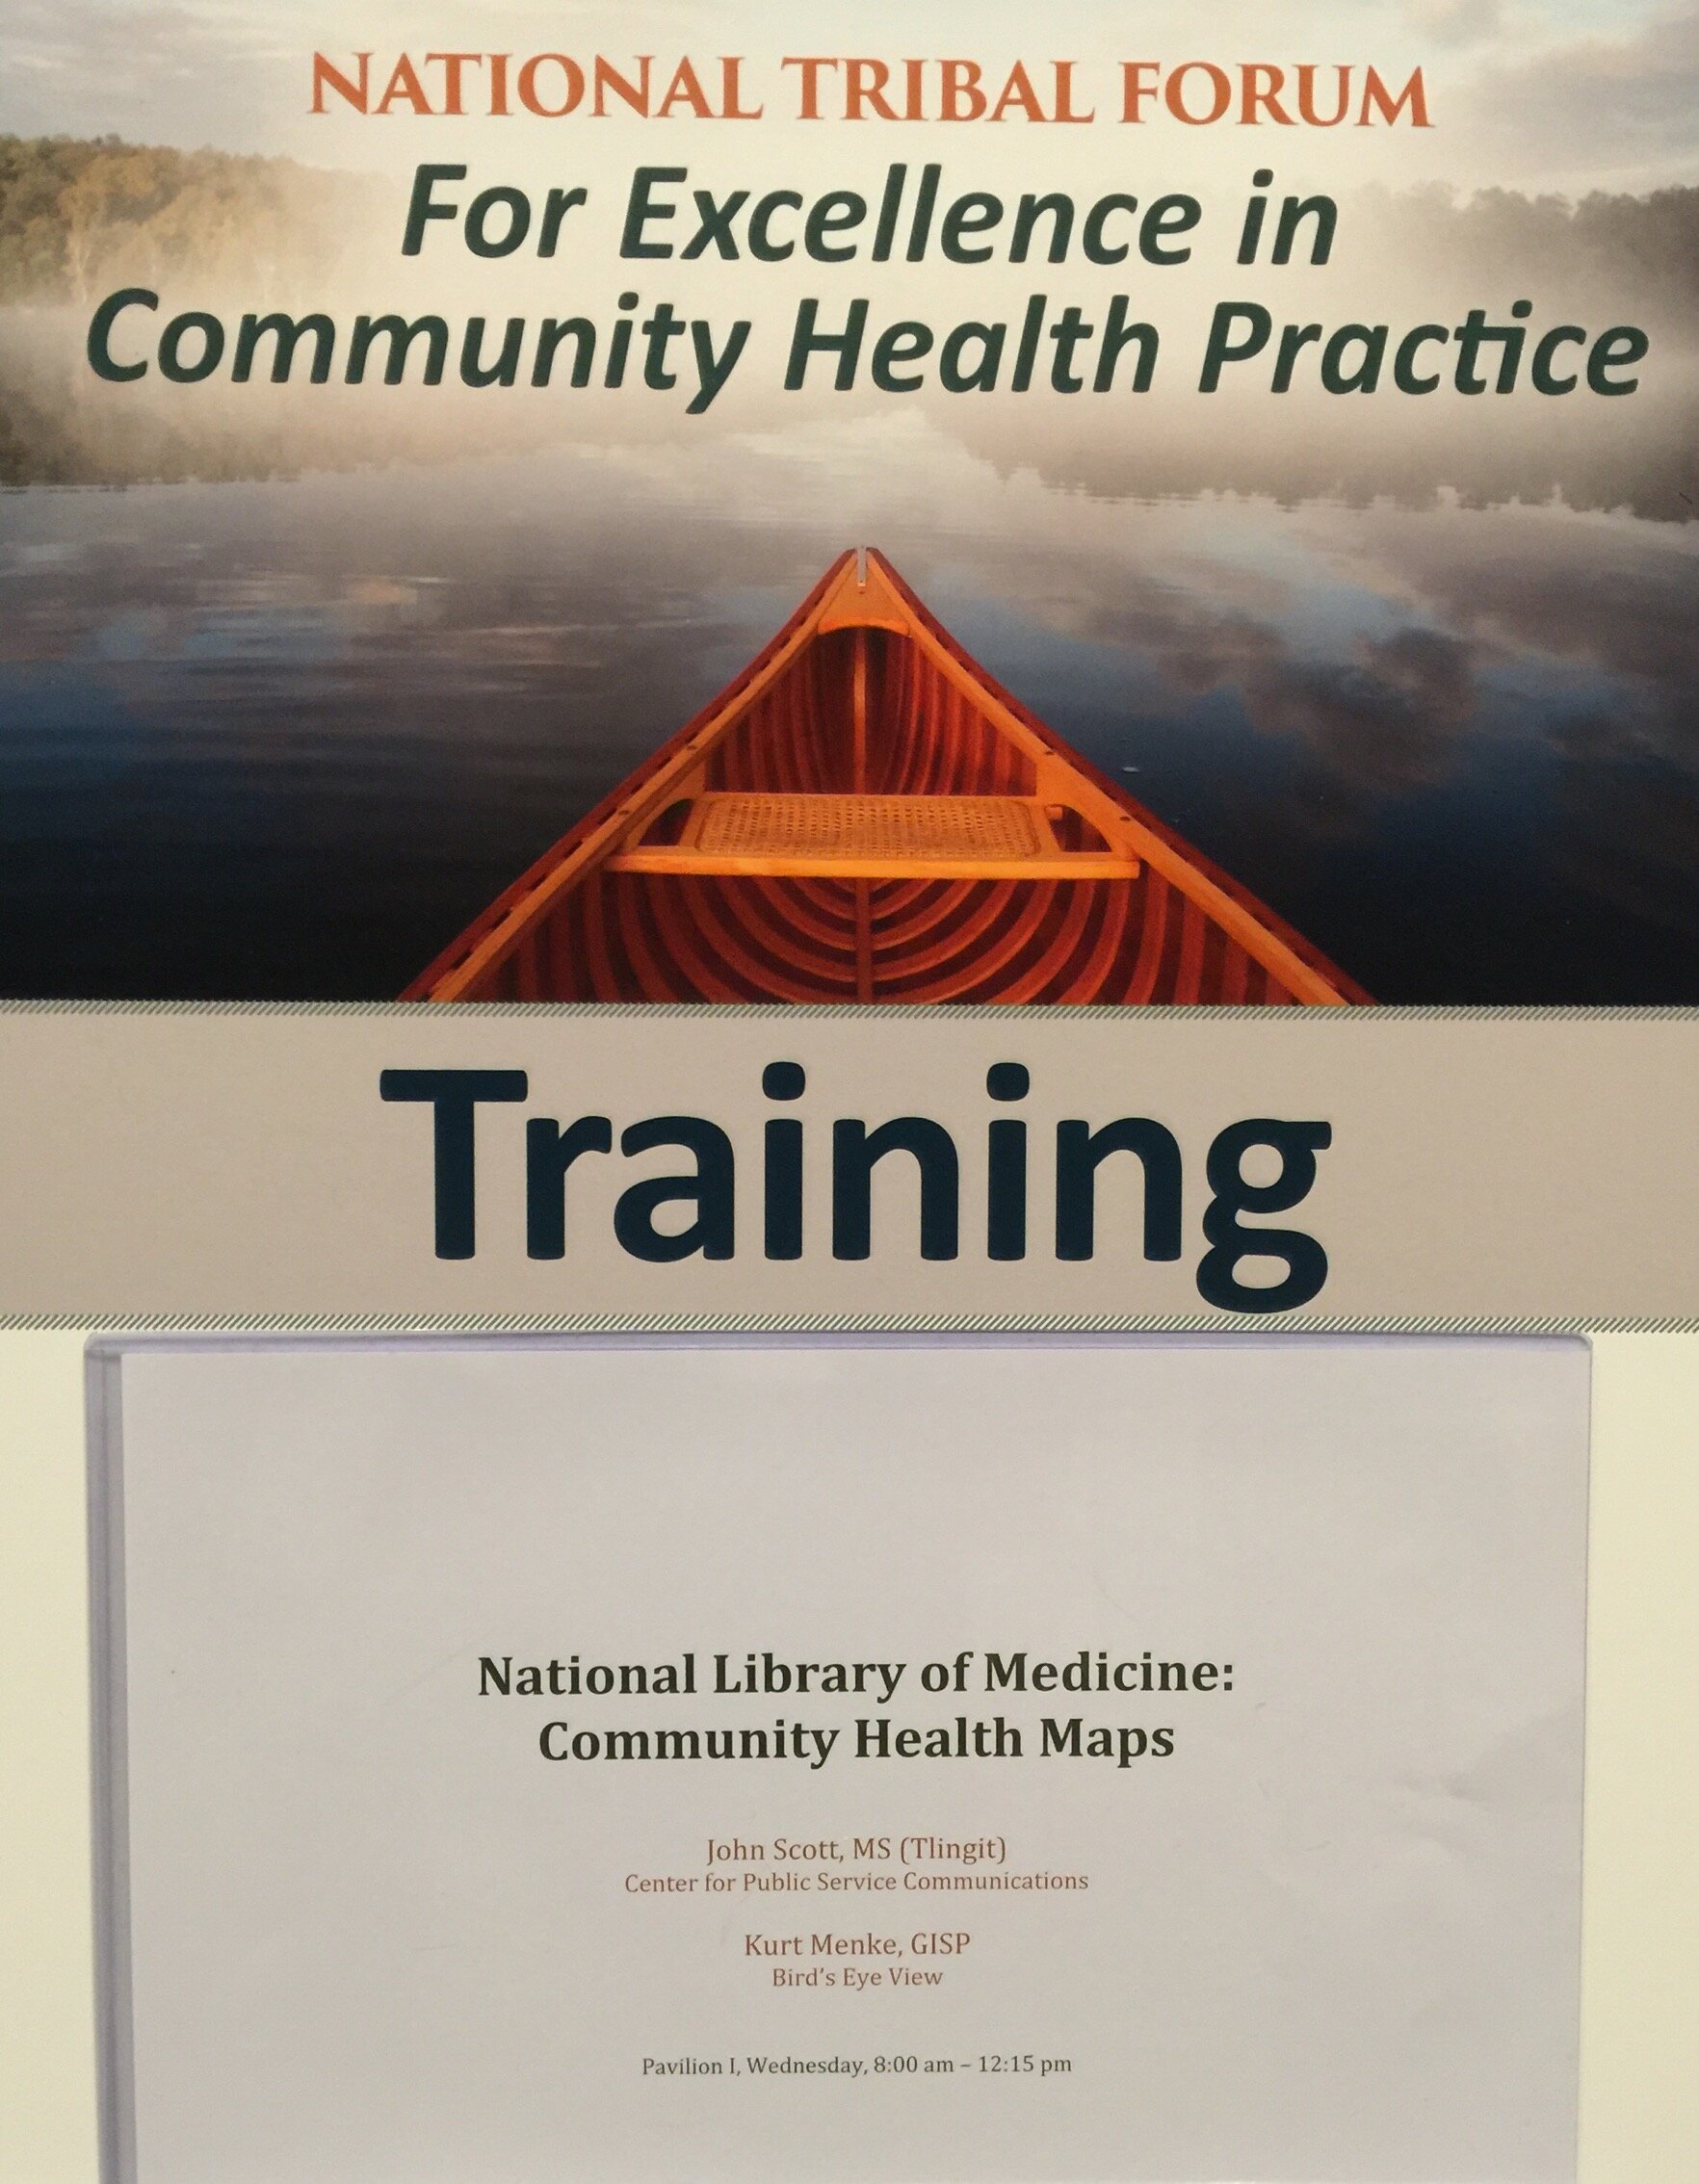
  • Create a field data collection form in Fulcrum
  • Collect some data around the conference center on their smartphones/tablets
  • Make a map of their data in Carto
  • Learn how to bring the data into QGIS

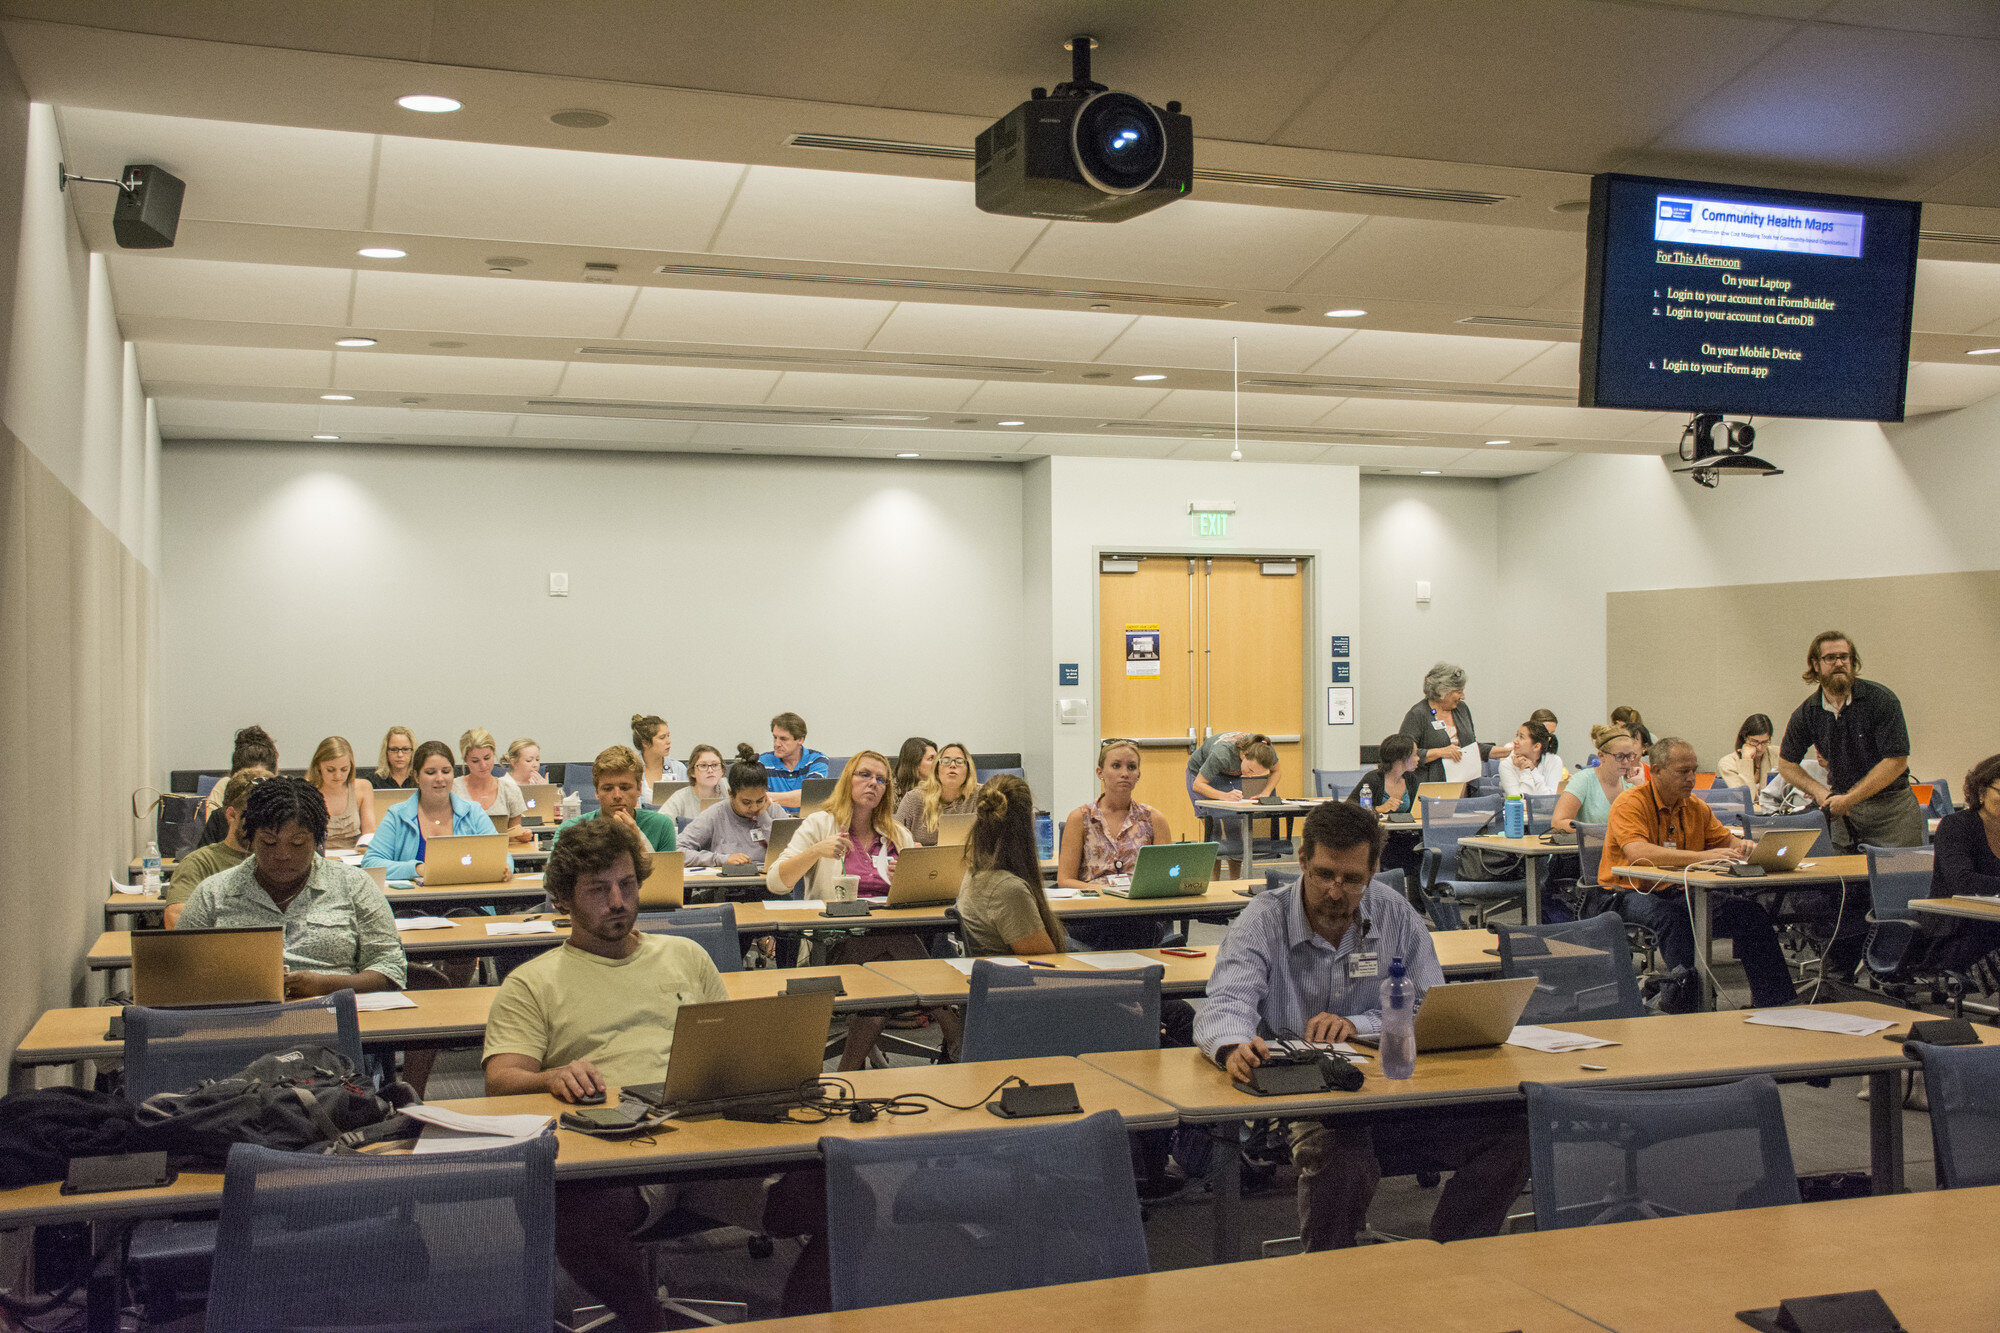
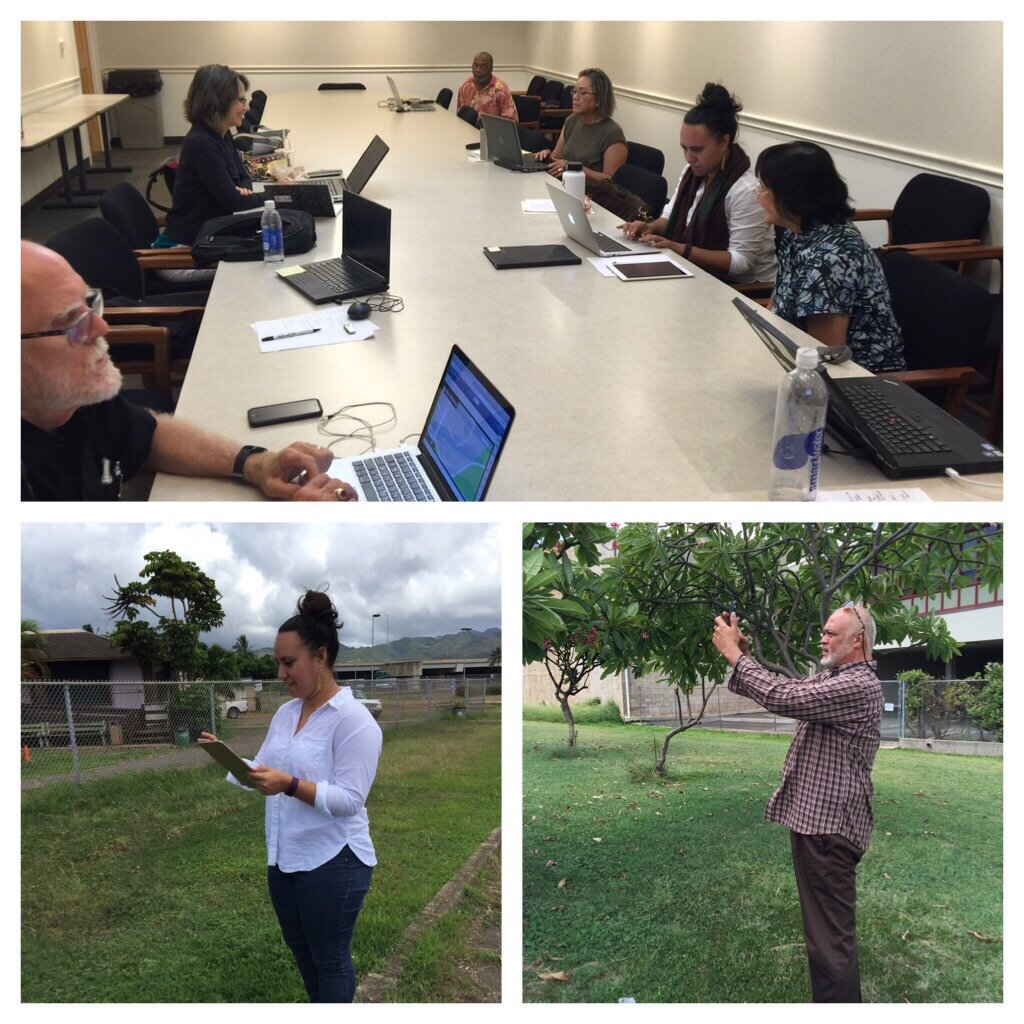
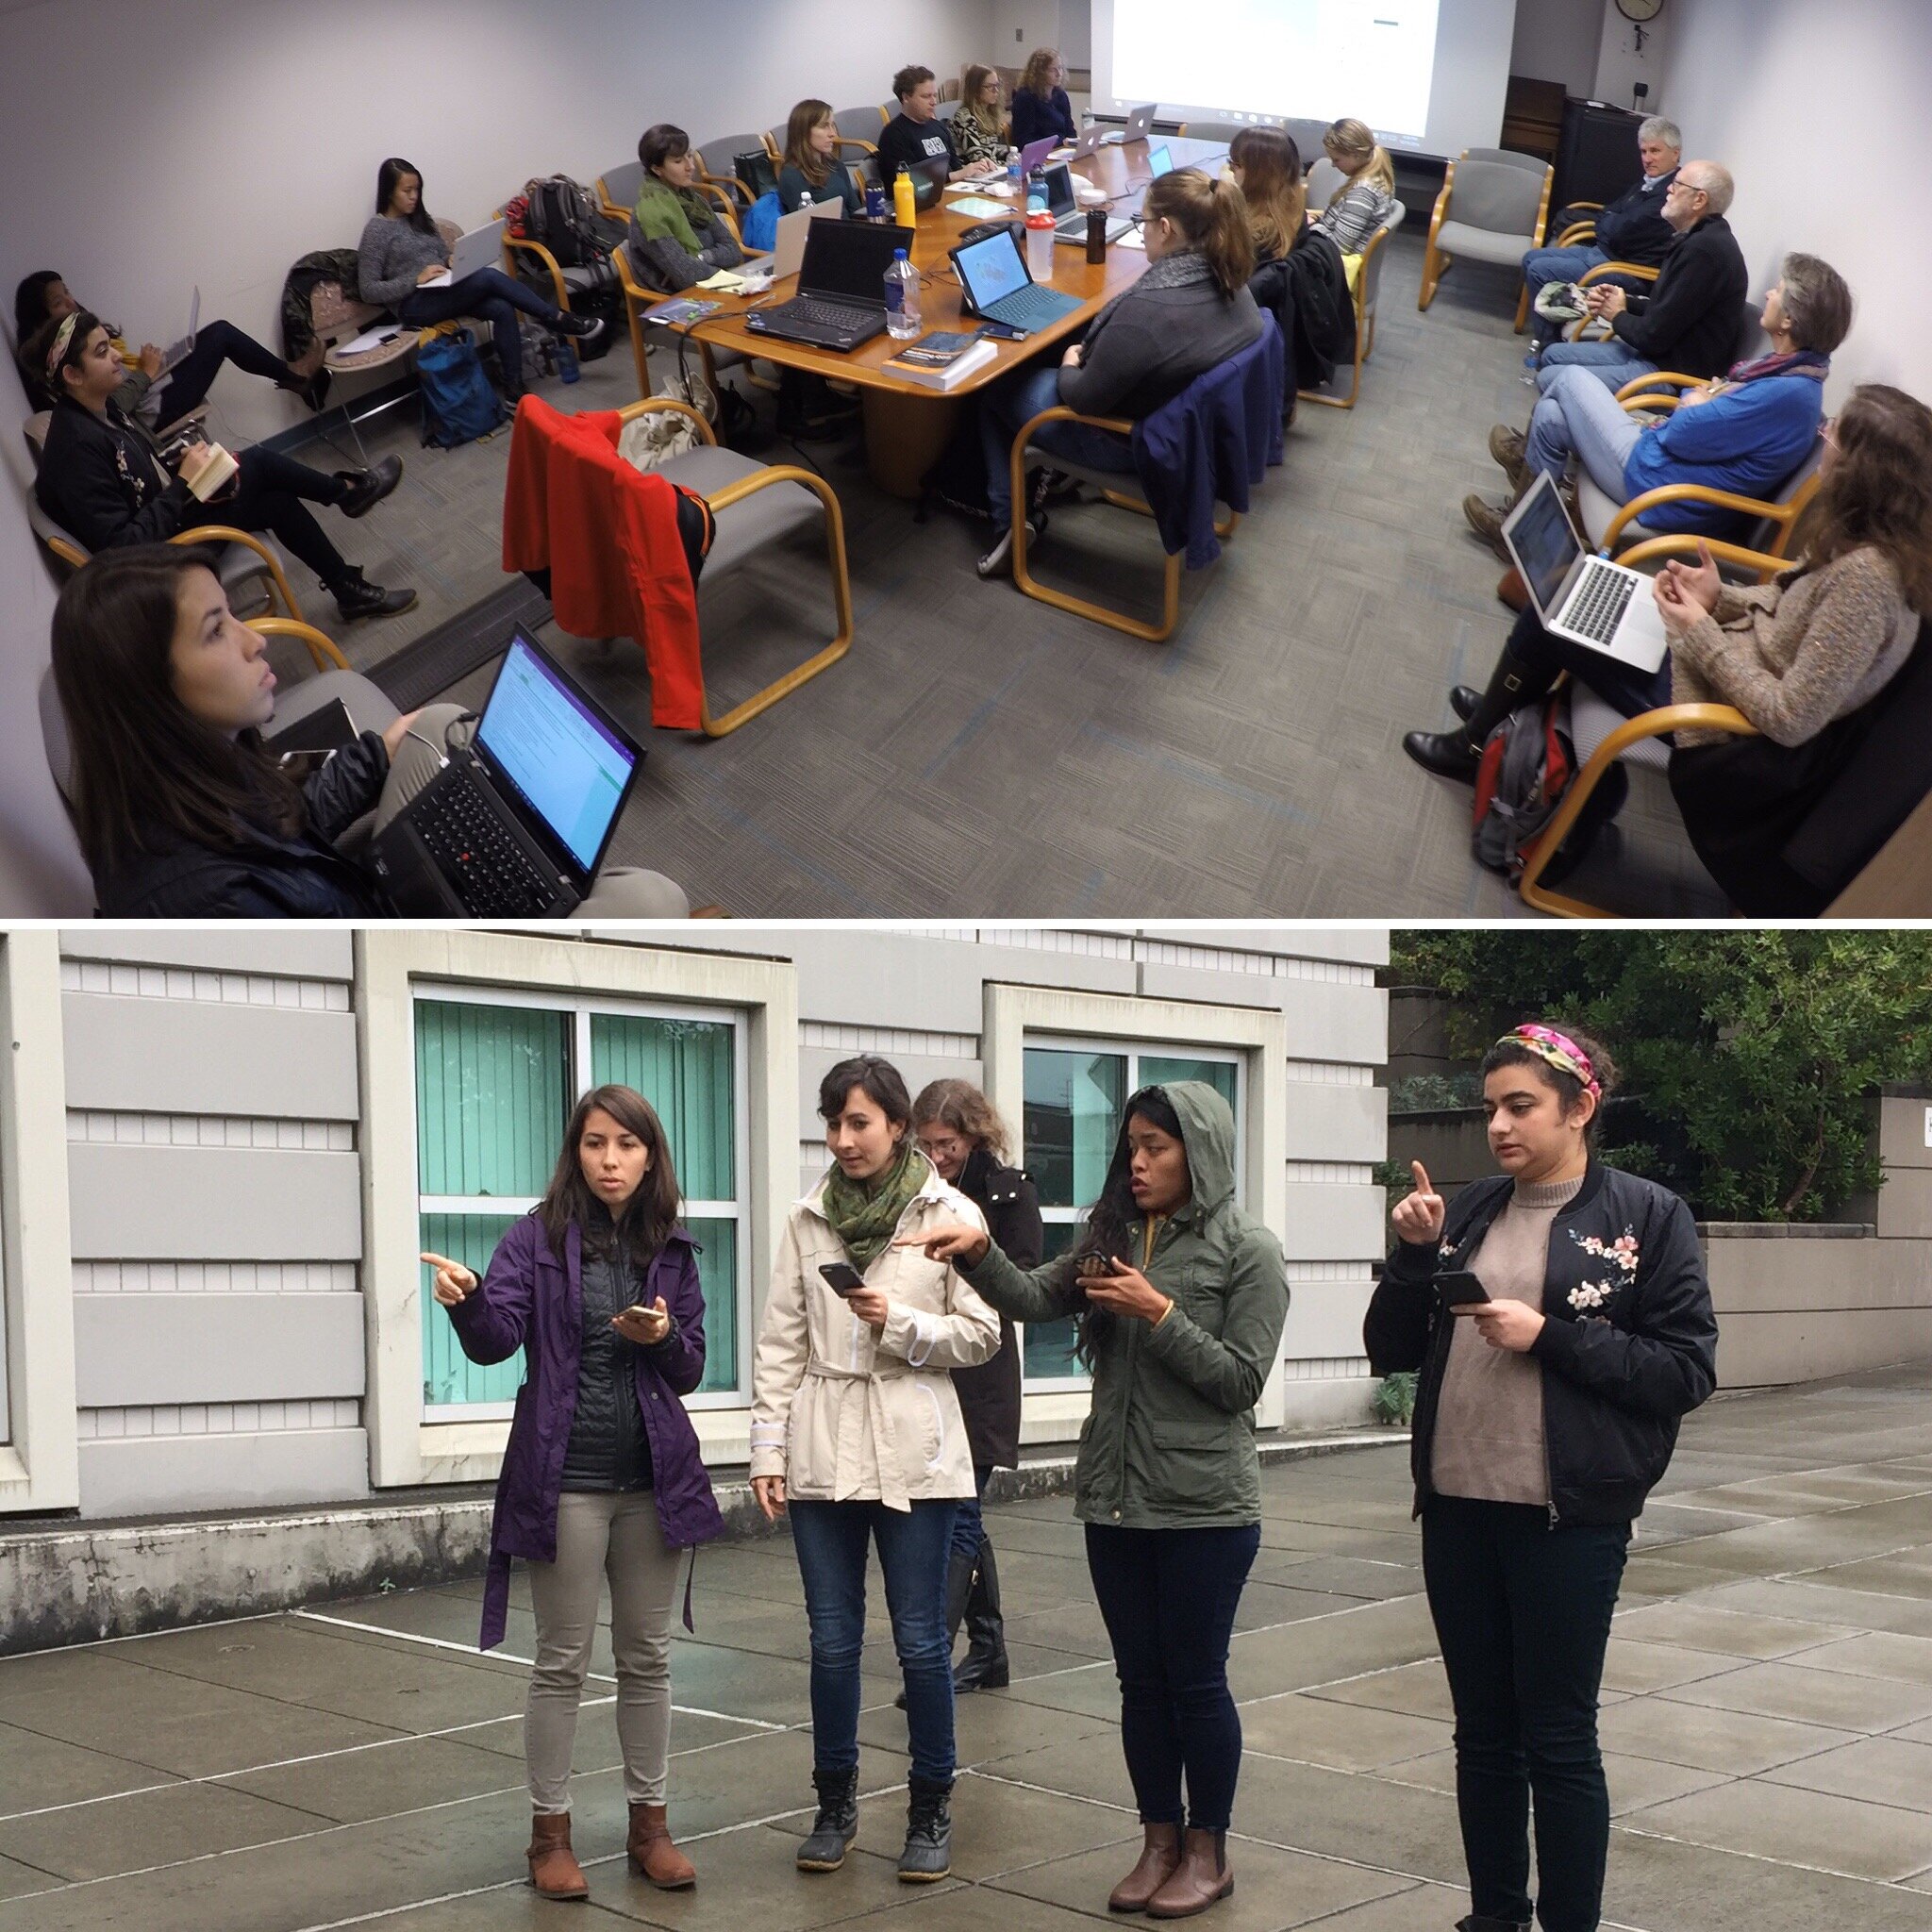
This was a typical CHM workshop with most never having done any mapping work before. As such it was a very empowering experience for the participants to learn how to use this technology to map their community in just a few short hours.From there we traveled to Honolulu, Hawai'i to give a workshop organized by Papa Ola Lokahi. There were two hurricanes (Lester and Madeline) heading towards the islands. Fortunately they both veered off and didn't cause any damage or disruptions! The attendees came with a plethora of ideas on how mapping could fit into their work including:A) tracking scholarship recipients of the Native Hawaiian Health Scholarships program,B) supporting the Native Hawaiian Cancer Network,C) mapping Dr. Ben Young’s research on historical tracking of Native Hawaiian Health professionals,D) mapping Native Hawaiian Homelands to provide resource data to providers and community members, andE) use the CHM "train the trainer" model to increase ongoing trainings for service providers including community health outreach workers and patient community navigators in Hawai'i.img_1004After a brief break we headed to Seattle, Washington, again there were two separate storms including, the remnants of Typhoon Songda, bearing down on the region threatening to disrupt power and services! Again fortunately the storms didn't make a direct hit on the area and the workshop proceeded on schedule.We went to train students in the capstone course of the Community Oriented Public Health Practice Program at the University of Washington. This is our second year supporting this program. The first year was a huge success with two students attending the APTR Conference and presenting their work.Like last year we had  a full house with students eager to learn about community mapping. Both first year and second year students were in attendance. Several second year students will submit proposals for consideration, to receive a stipend and support for using Community Health Maps in their capstone projects. Jamie Smeland is the first of the group to be awarded the stipend for her capstone project entitled, "Honoring the Collective Wisdom: Documenting a Cross-Racial and Intergenerational Movement to Shift Power to Youth and Parent Leaders to Improve Educational and Health Outcomes for Students of Color in South Seattle & South King County." We look forward to working with these students in the coming months.IMG_2178.JPGIn the near future we will be offering an updated set of Community Health Mapping labs and a platform for CHM webinars. Stay tuned! In the meantime if you are interested in Community Health Maps and/or receiving CHM training contact John Scott (jcscott at cpsc.com) for more details.
GIS as an Educational Tool at MUSC

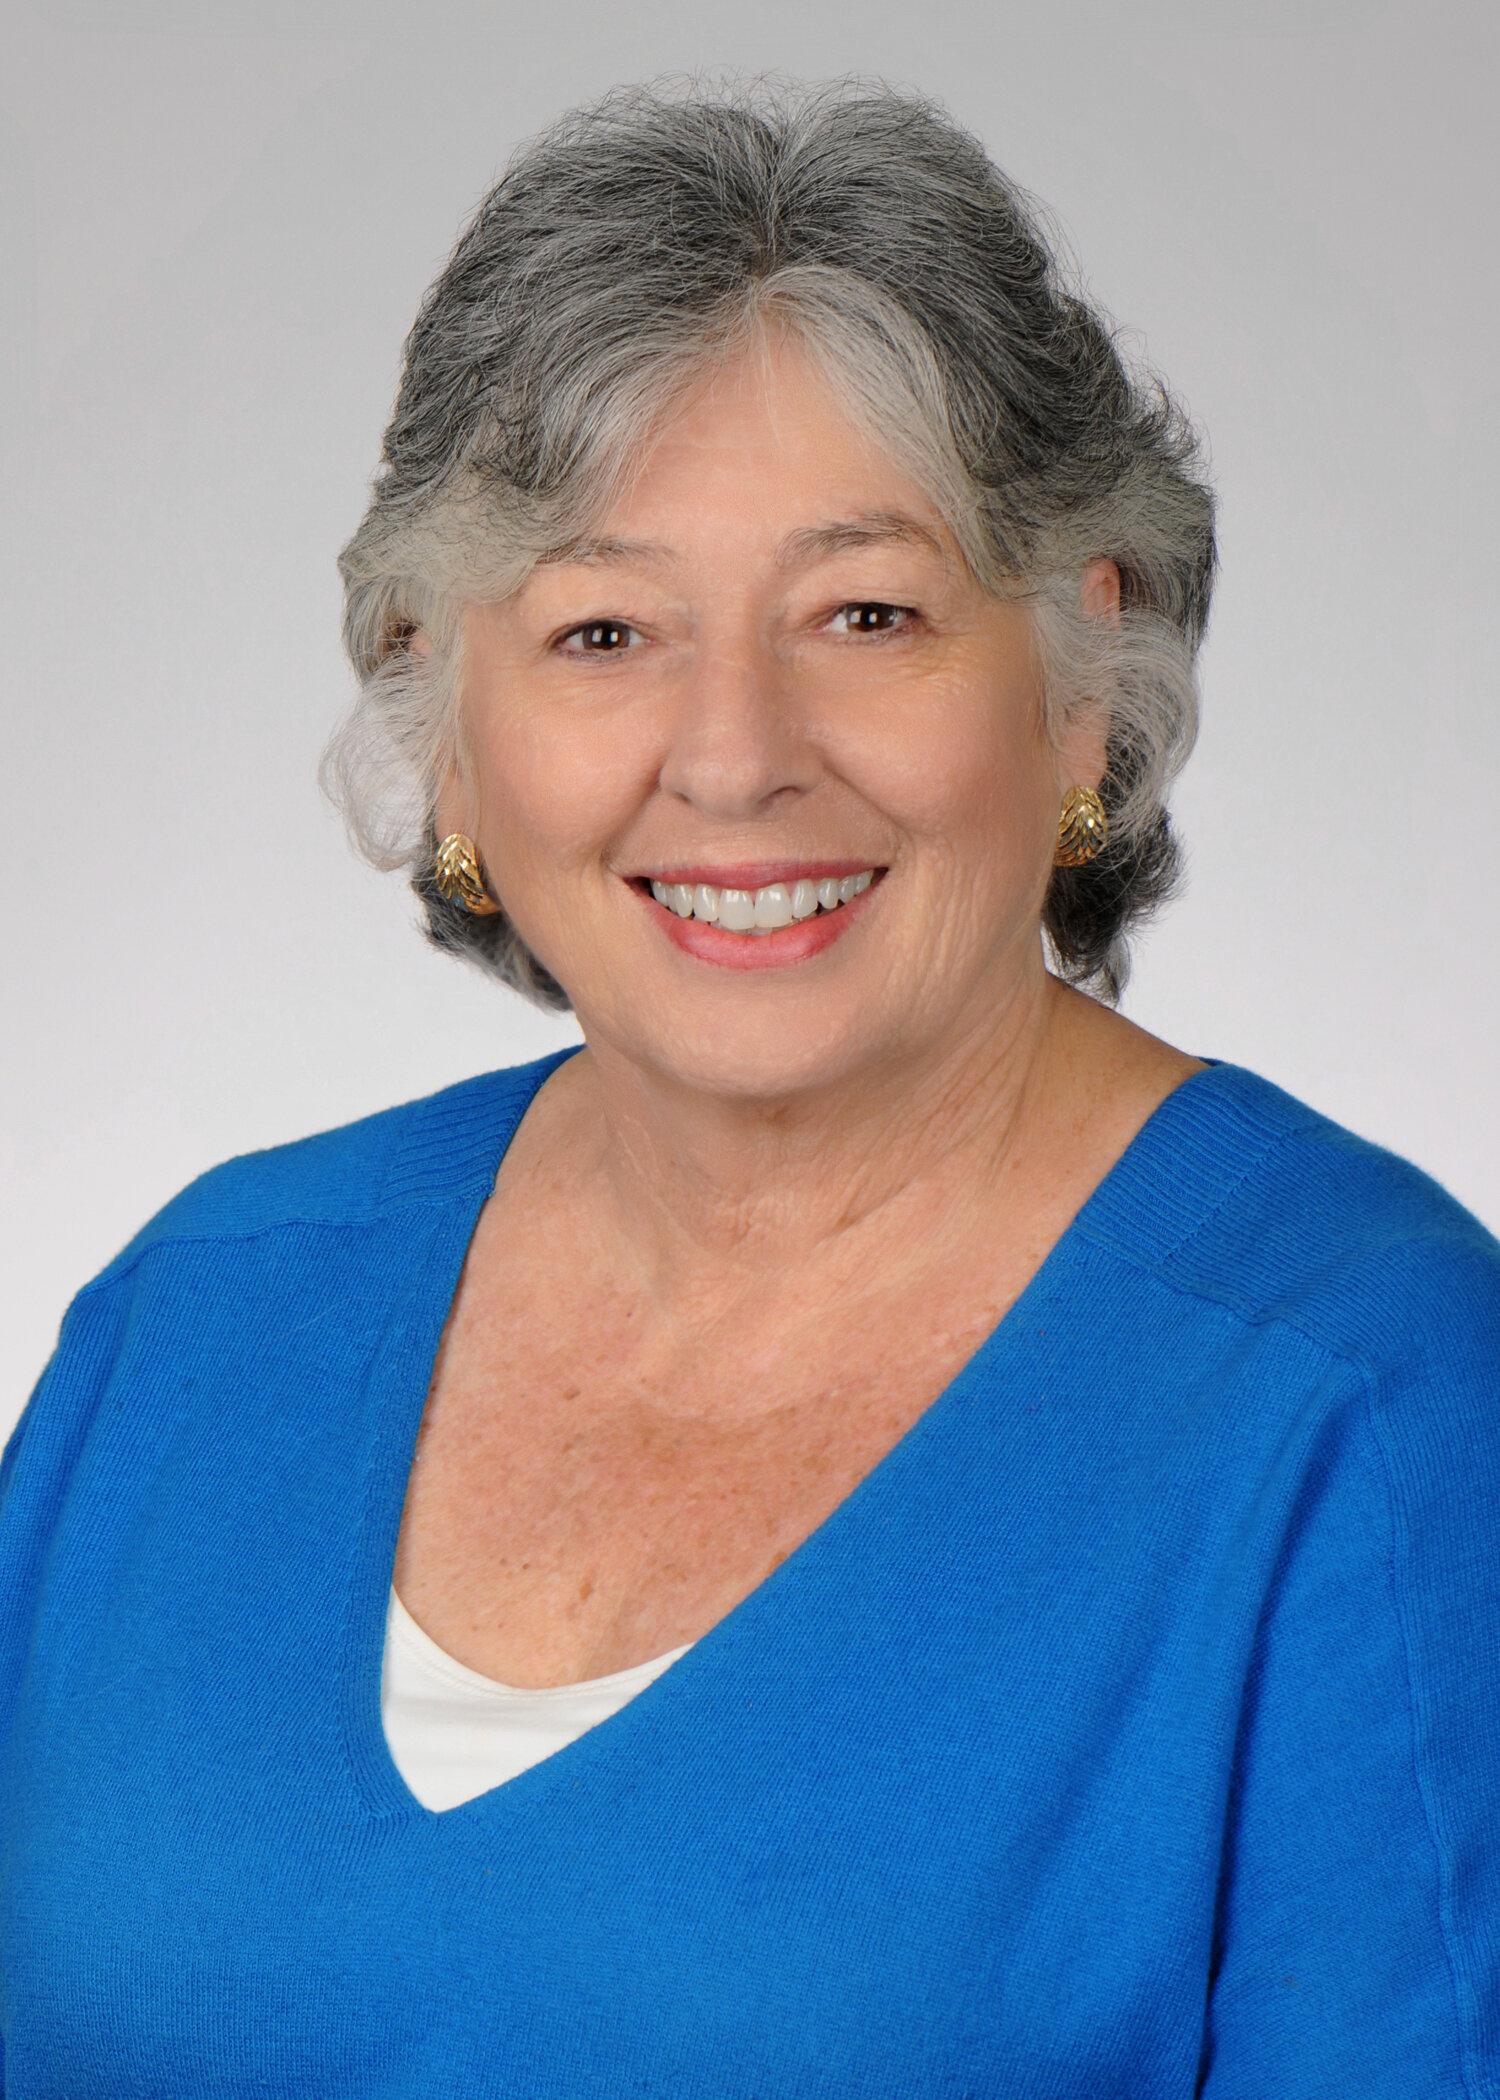
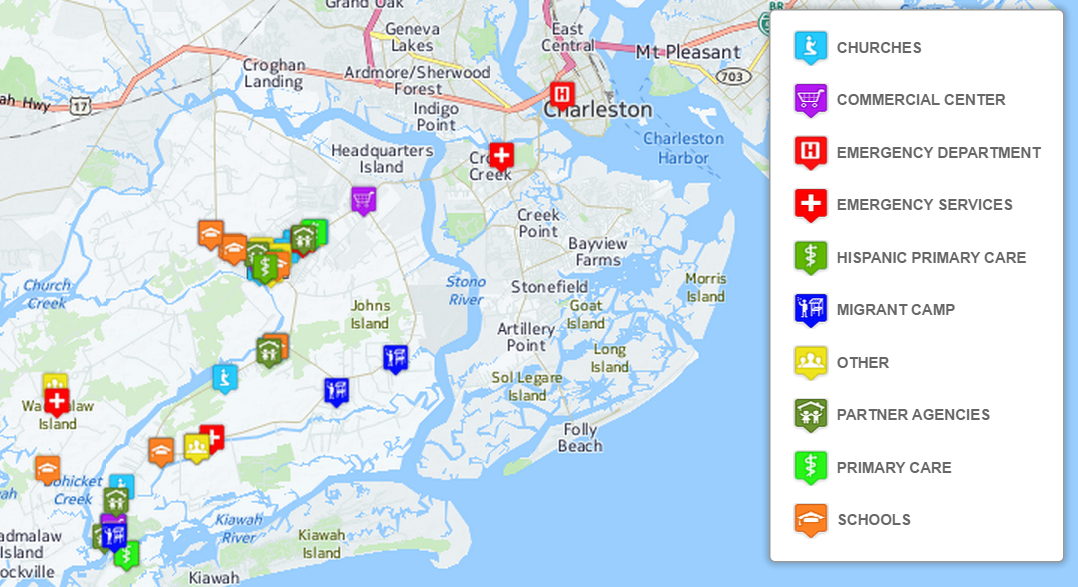
Submitted by Jennifer RewolinskiDr. Deborah Williamson is an Associate Professor in the College of Nursing at the Medical University of South Carolina (MUSC), Charleston. Dr. Williamson, Community Health Maps (CHM) and MUSC have partnered in providing training that integrates GIS and CHM tools for a high school Teen Health Leadership Program. Dr. Williamson has worked with both community members and students.wilmsndDr. Williamson believes that, “GIS has the potential to substantially increase community engagement and is truly a concept of the neighborhood taking control of their data.” She notes that while researchers might study a community, that a community’s input is essential to understanding the cultural and environmental context surrounding health issues: “GIS mapping puts the community members on more of a level playing field with their research partners.” GIS can empower and educate community members to identify their key issues, to become a part of an analysis, and to provide solutions. When communities are given the opportunity to map their own health, discovery, and awareness, positive changes can result.  When a community feels it has more of a say through engagement with GIS, or communication with a map, intervention is more likely to be effective.For the past three semesters, Dr. Williamson has used GIS in her own classroom as a capstone project for population health students.  They, “find it fun and can take it with them into other settings, it fits into the world of new technology, and it takes people to the next step of looking at health issues.” Mapping offers a different way to help students visualize Social Determinants of Health and to make the connection between what population health is, and the factors that promote or deter it.IMG_9585_v2Finally, Dr. Williamson sees GIS as bi-directional: it supports visualizing gaps and assets while also providing the ability to disseminate and build on information via intervention programs to improve health outcomes and strengthen communities. GIS is also broadly applicable to almost any discipline and easily used by those with little expertise. “Presenting raw data to a community or students doesn’t mean a lot,” Dr. Williamson comments, “but when that same data is aggregated visually it instantly communicates a message to any audience.” GIS is clearly suitable as an effective educational tool in the classroom and in communities.CHM thanks Dr. Williamson for her continued collaboration and time spent advancing the CHM program through use of the CHM tools at MUSC. CHM values our partnership with MUSC and hope that the future is as mutually beneficial as the past few years.Field data collection for the CHM workflow bridges the divide between learning in a classroom and experiencing conditions in a community. For the capstone project, students use CHM labs and parts of the CHM workflow, including phone data collection with iForm or Fulcrum, integration of the data into QGIS, and presenting the data with Carto or Google Maps. Dr. Williamson’s students often upload their data from iForm to Google Maps because of its familiarity and easy access.One student project involved identifying migrant camps as a community in need, and assessing the community through surveys and key informant interviews.  When the data showed that migrant workers often lack knowledge of health information and access to healthcare services, students mapped locations of migrant camps near Charleston, SC in relation to urgent care facilities and shared the data with the migrant outreach workers from a local community health center. Later, an intervention was developed to provide hands on CPR and first aid instruction to 60 workers. This project displays successful application of CHM tools in an educational and community context resulting in an intervention that may offer real change.CharlestonMigrantMap.png
Announcement: Extreme Heat & Health Webinar

There will be a webinar next week entitled: Extreme Heat and Health: Creating Environmental Intelligence Through Science, Predictions, and Engagement. The specific date and time are: April 28th, 2016 from 4 - 5:30pm EDT. This will likely be an interesting webinar for many Community Health Mappers! Click this link to learn more.2016-04-22_101608

APTR: Teaching Prevention - Albuquerque, NM

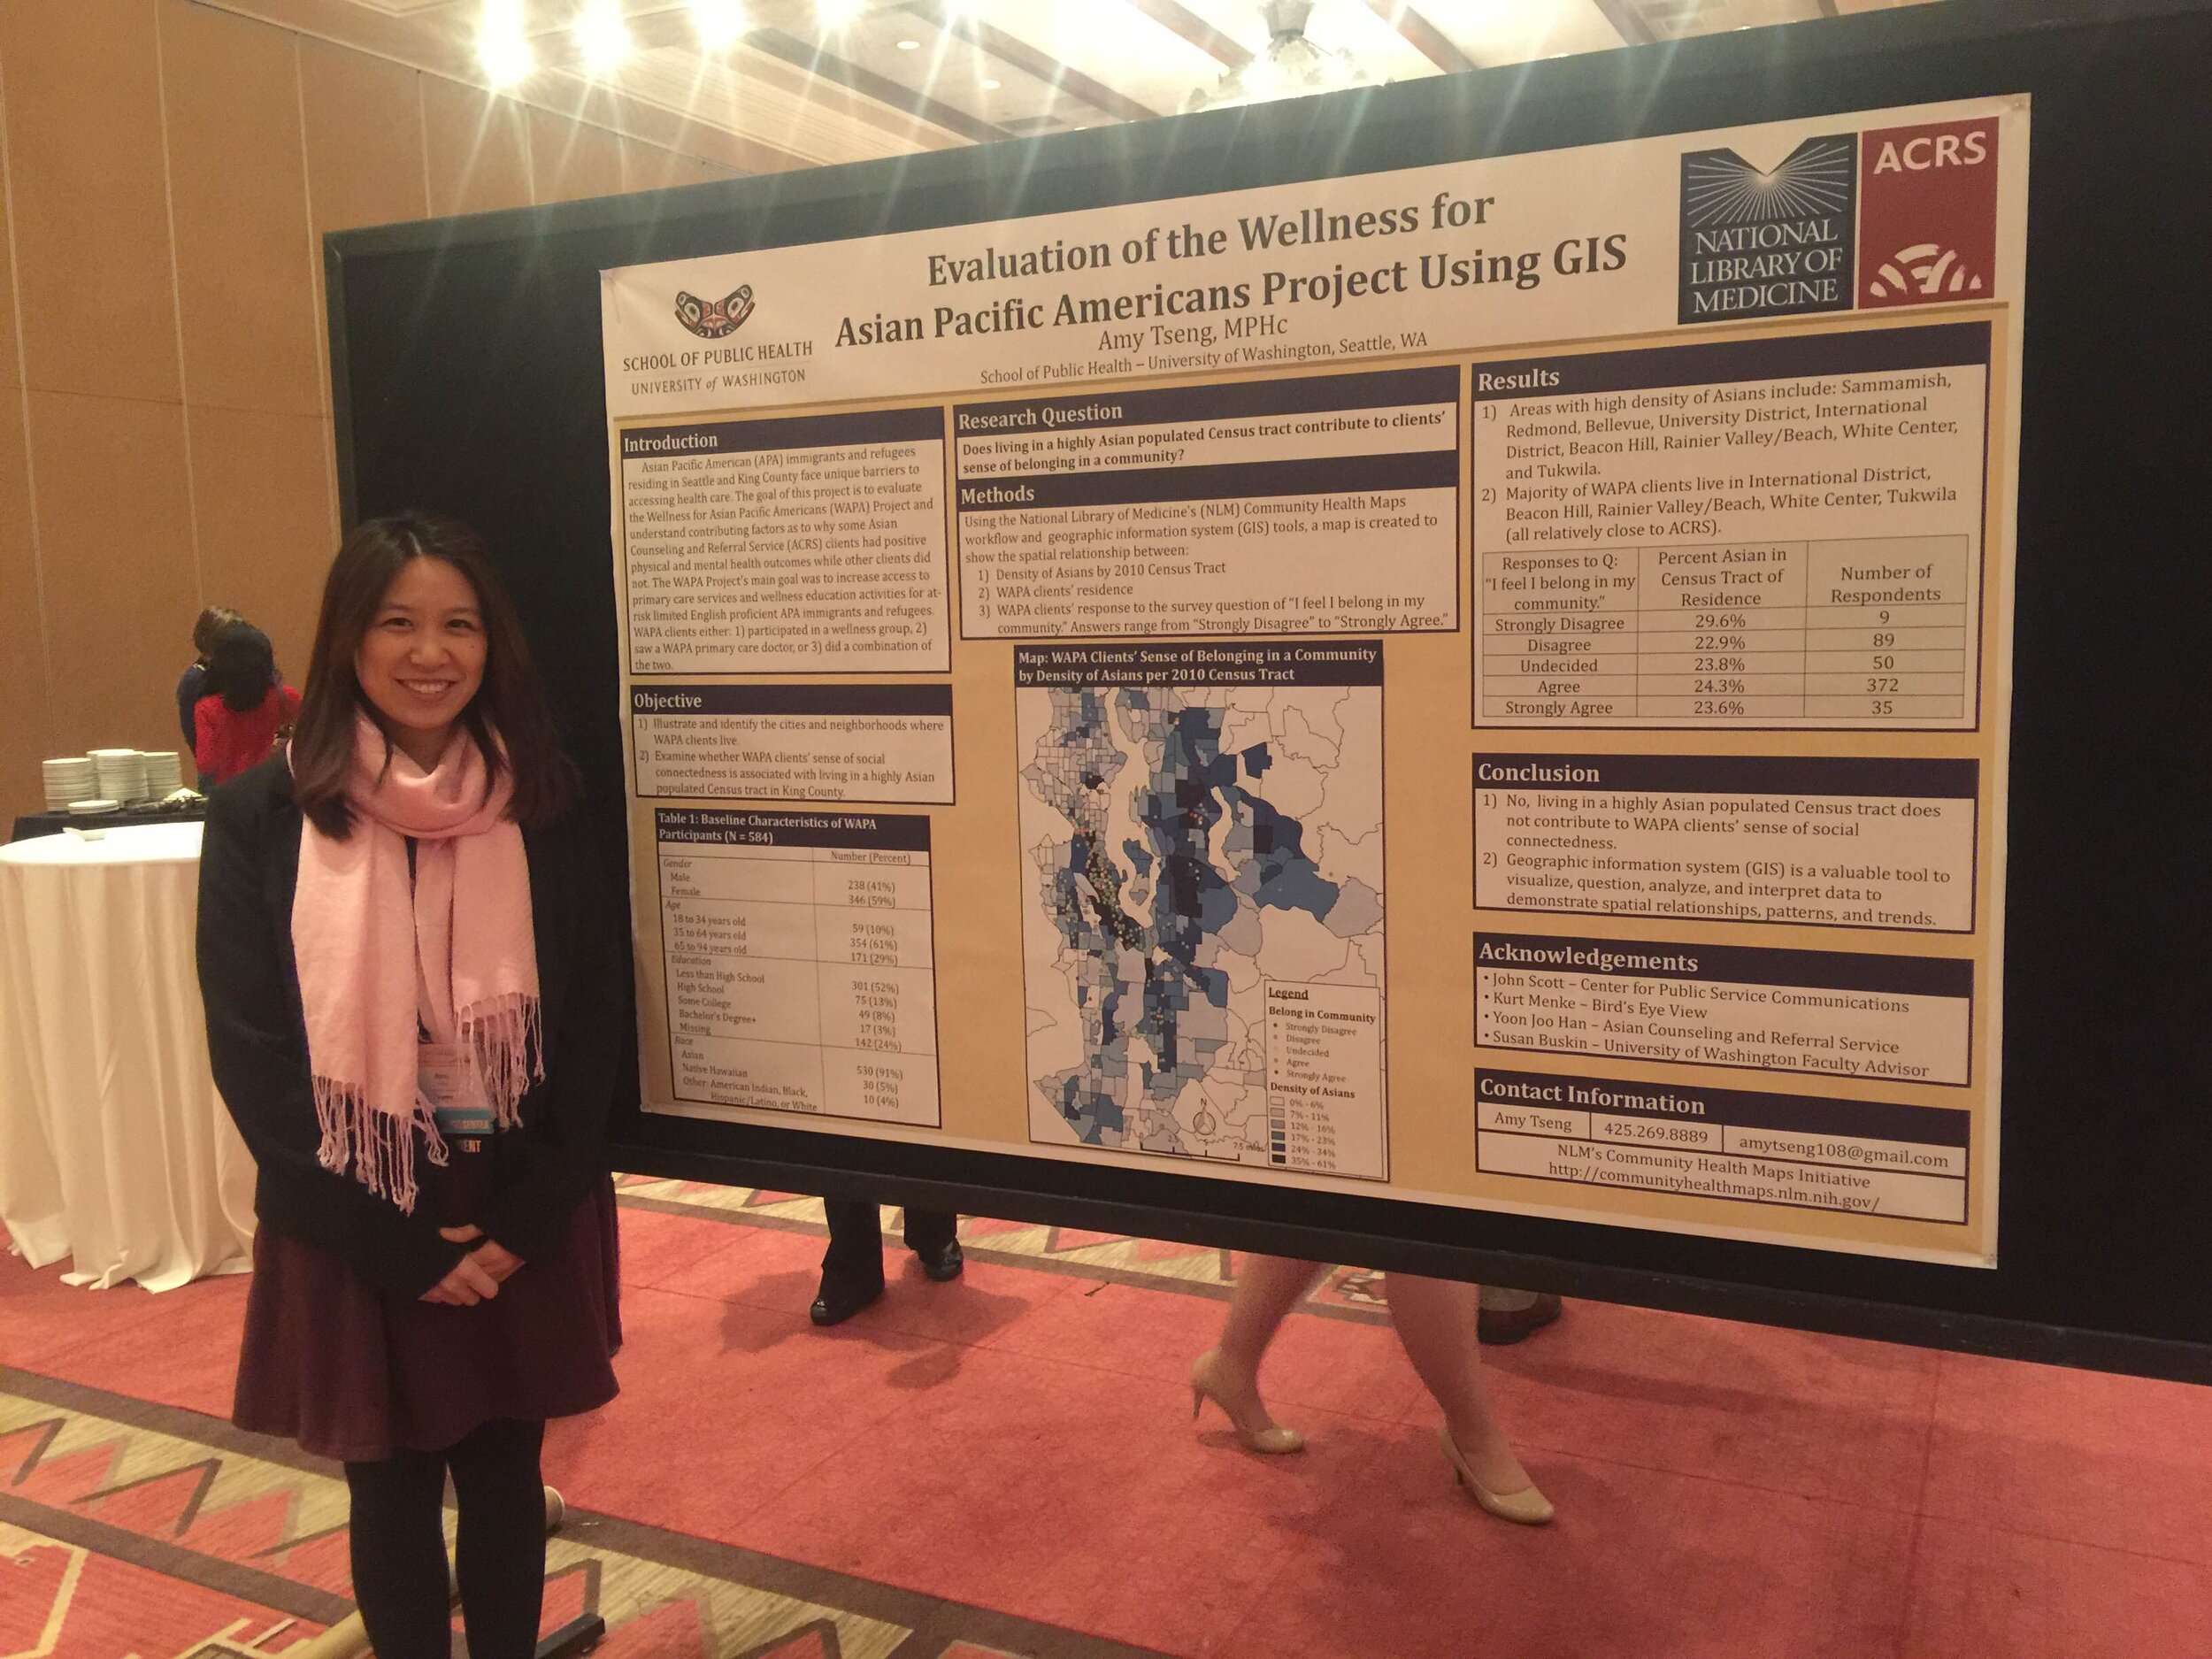
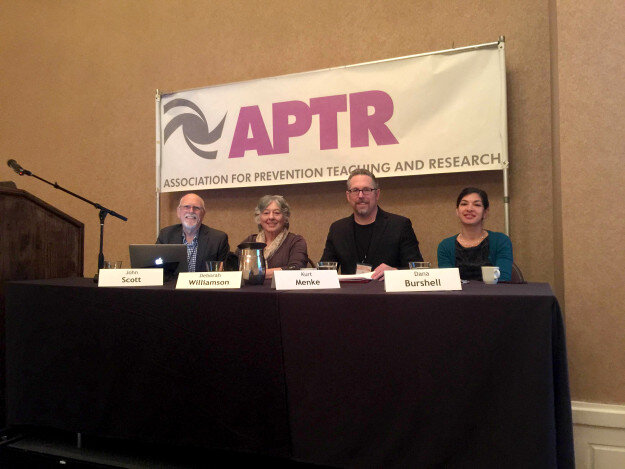
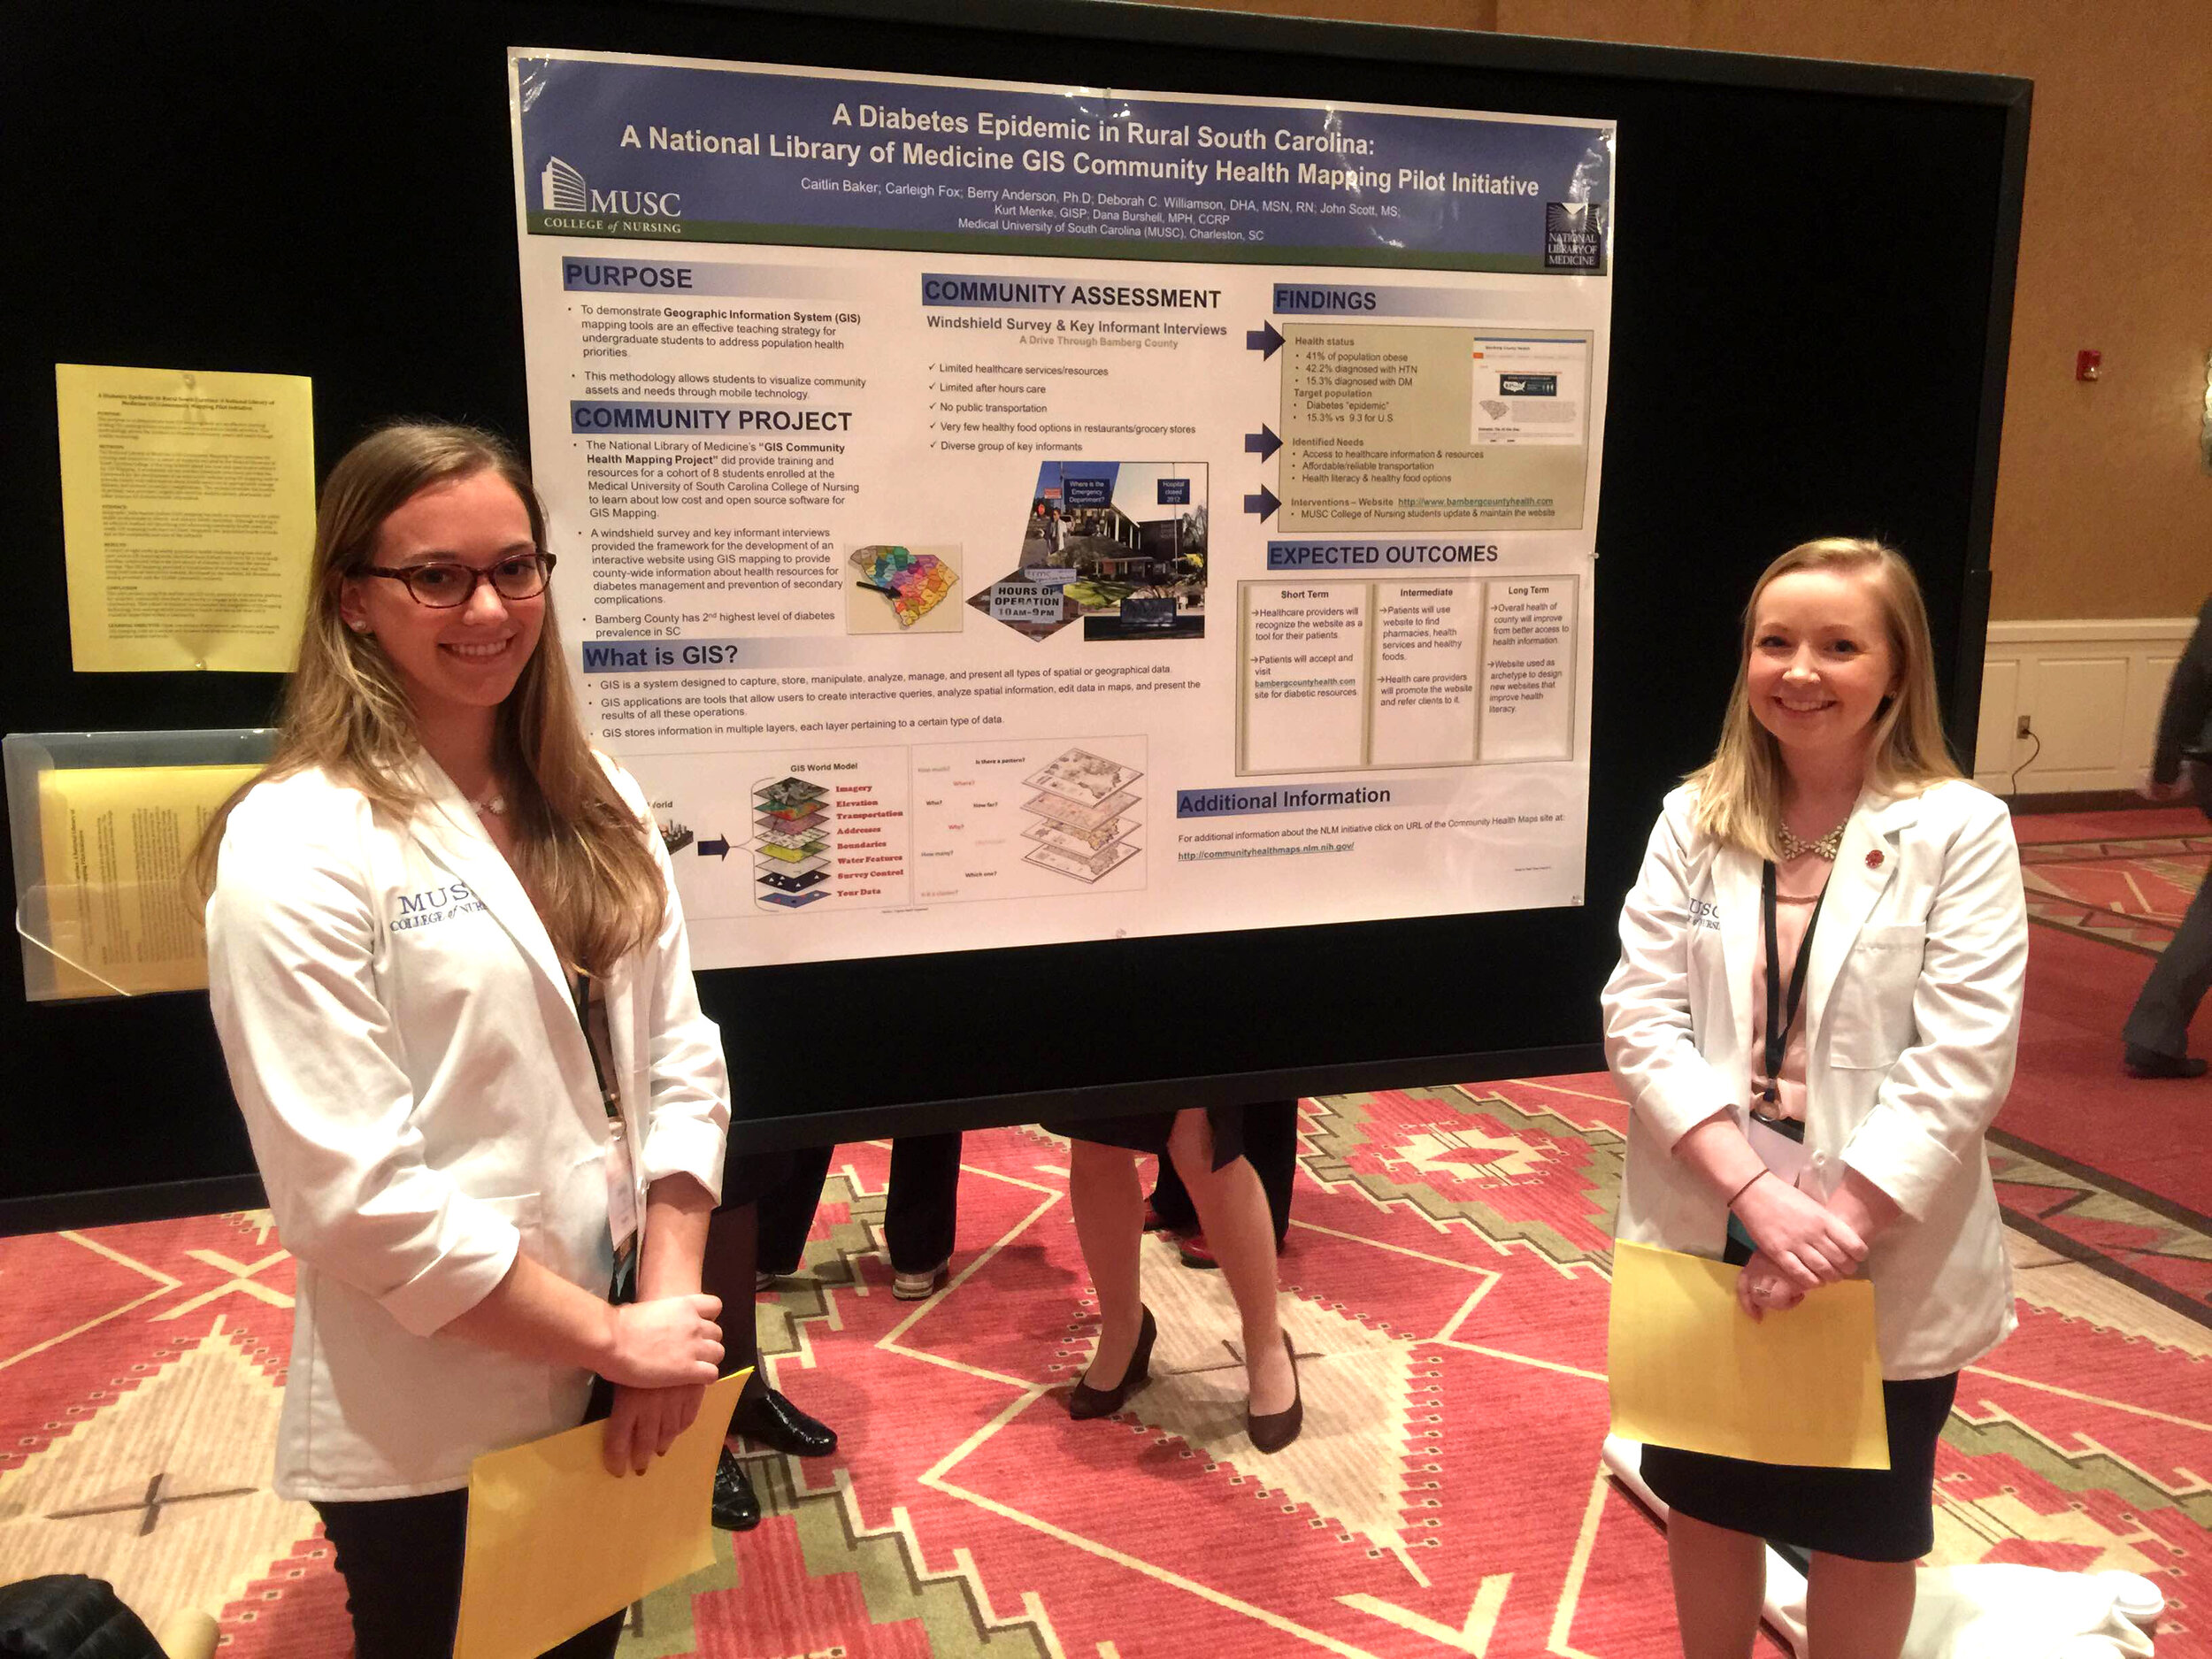
Community Health Mappers had a strong presence at the recent APTR Teaching Prevention conference held in Albuquerque, New Mexico last week.APTR Teaching Prevention Conference LogoThe theme of the conference was Preparing Students to Address Emerging Issues, and four students presented work incorporating the CHM mapping protocol. Medical University of South Carolina (MUSC) College of Nursing students Caitlin Baker and Carleigh Fox presented a  poster on their project "A Diabetes Epidemic in Rural South Carolina." They used mobile devices to conduct a windshield survey of a rural South Carolina community to better understand the diabetes epidemic.Caitlin Baker and Carleigh Fox Presenting at the APTR Poster SessionAmy Tseng, a student at the University of Washington's School of Public Health, presented a poster outlining her project, "Evaluating of the Wellness for Asian Pacific Americans Using GIS." This is her capstone project in the Community Oriented Public Health Practice program . One question she is attempting to answer is whether there is a relationship between having a sense of community and the density of Asian Pacific Americans  in a given neighborhood. She is utilizing QGIS and Fulcrum to help answer this question.Amy Tseng (UW) Presenting at the APTR Poster SessionChristina Yantsides, also in the School of Public Health at the University of Washington, presented her capstone project, "Bicycle Injuries and Fatalities: A GIS Mapping Project" in both a the Sunday afternoon lightning session, and the Sunday evening poster session. She is using QGIS to help identify clusters of bicycle accidents in Seattle and gain a better understanding of the causal factors.Christina Yantsides (UW) Presenting at the APTR Poster SessionThe final morning of the conference myself, John Scott, Dr.  Deborah Williamson (MUSC) and Dana Burshell (MUSC) presented the "National Library of Medicine (NLM) Community Health Mapping Project." Often conference attendees are tired by the final morning. However, we were excited to present to a standing room only crowd of about 75 attendees! Collectively we introduced the project and the National Library of Medicine, and went on to show how successfully the project has been implemented from Hawai'i to South Carolina. I heard several audible gasps from the audience as we presented examples. This caused me reflect on the fact that mapping and GIS is simply what I do all day long, however, to many it is still a new and exciting tool. We finished with a quick live demo of downloading data from Fulcrum and uploading it into CartoDB to show how quick and easy it is.John Scott, Deborah Williamson, Kurt Menke and Dana Burshell Before Presenting at APTRCollectively it was a very successful demonstration of how Community Health Mapping can be used by community organizations, educators and students. APTR was a very interesting conference and a great fit for Community Health Mapping. Several conference organizers suggested we teach a Community Health Mapping workshop at next years conference! Looks like we will be back!IMG_9778_v2

Wildly Successful Community Health Mapping Workshops at MUSC!

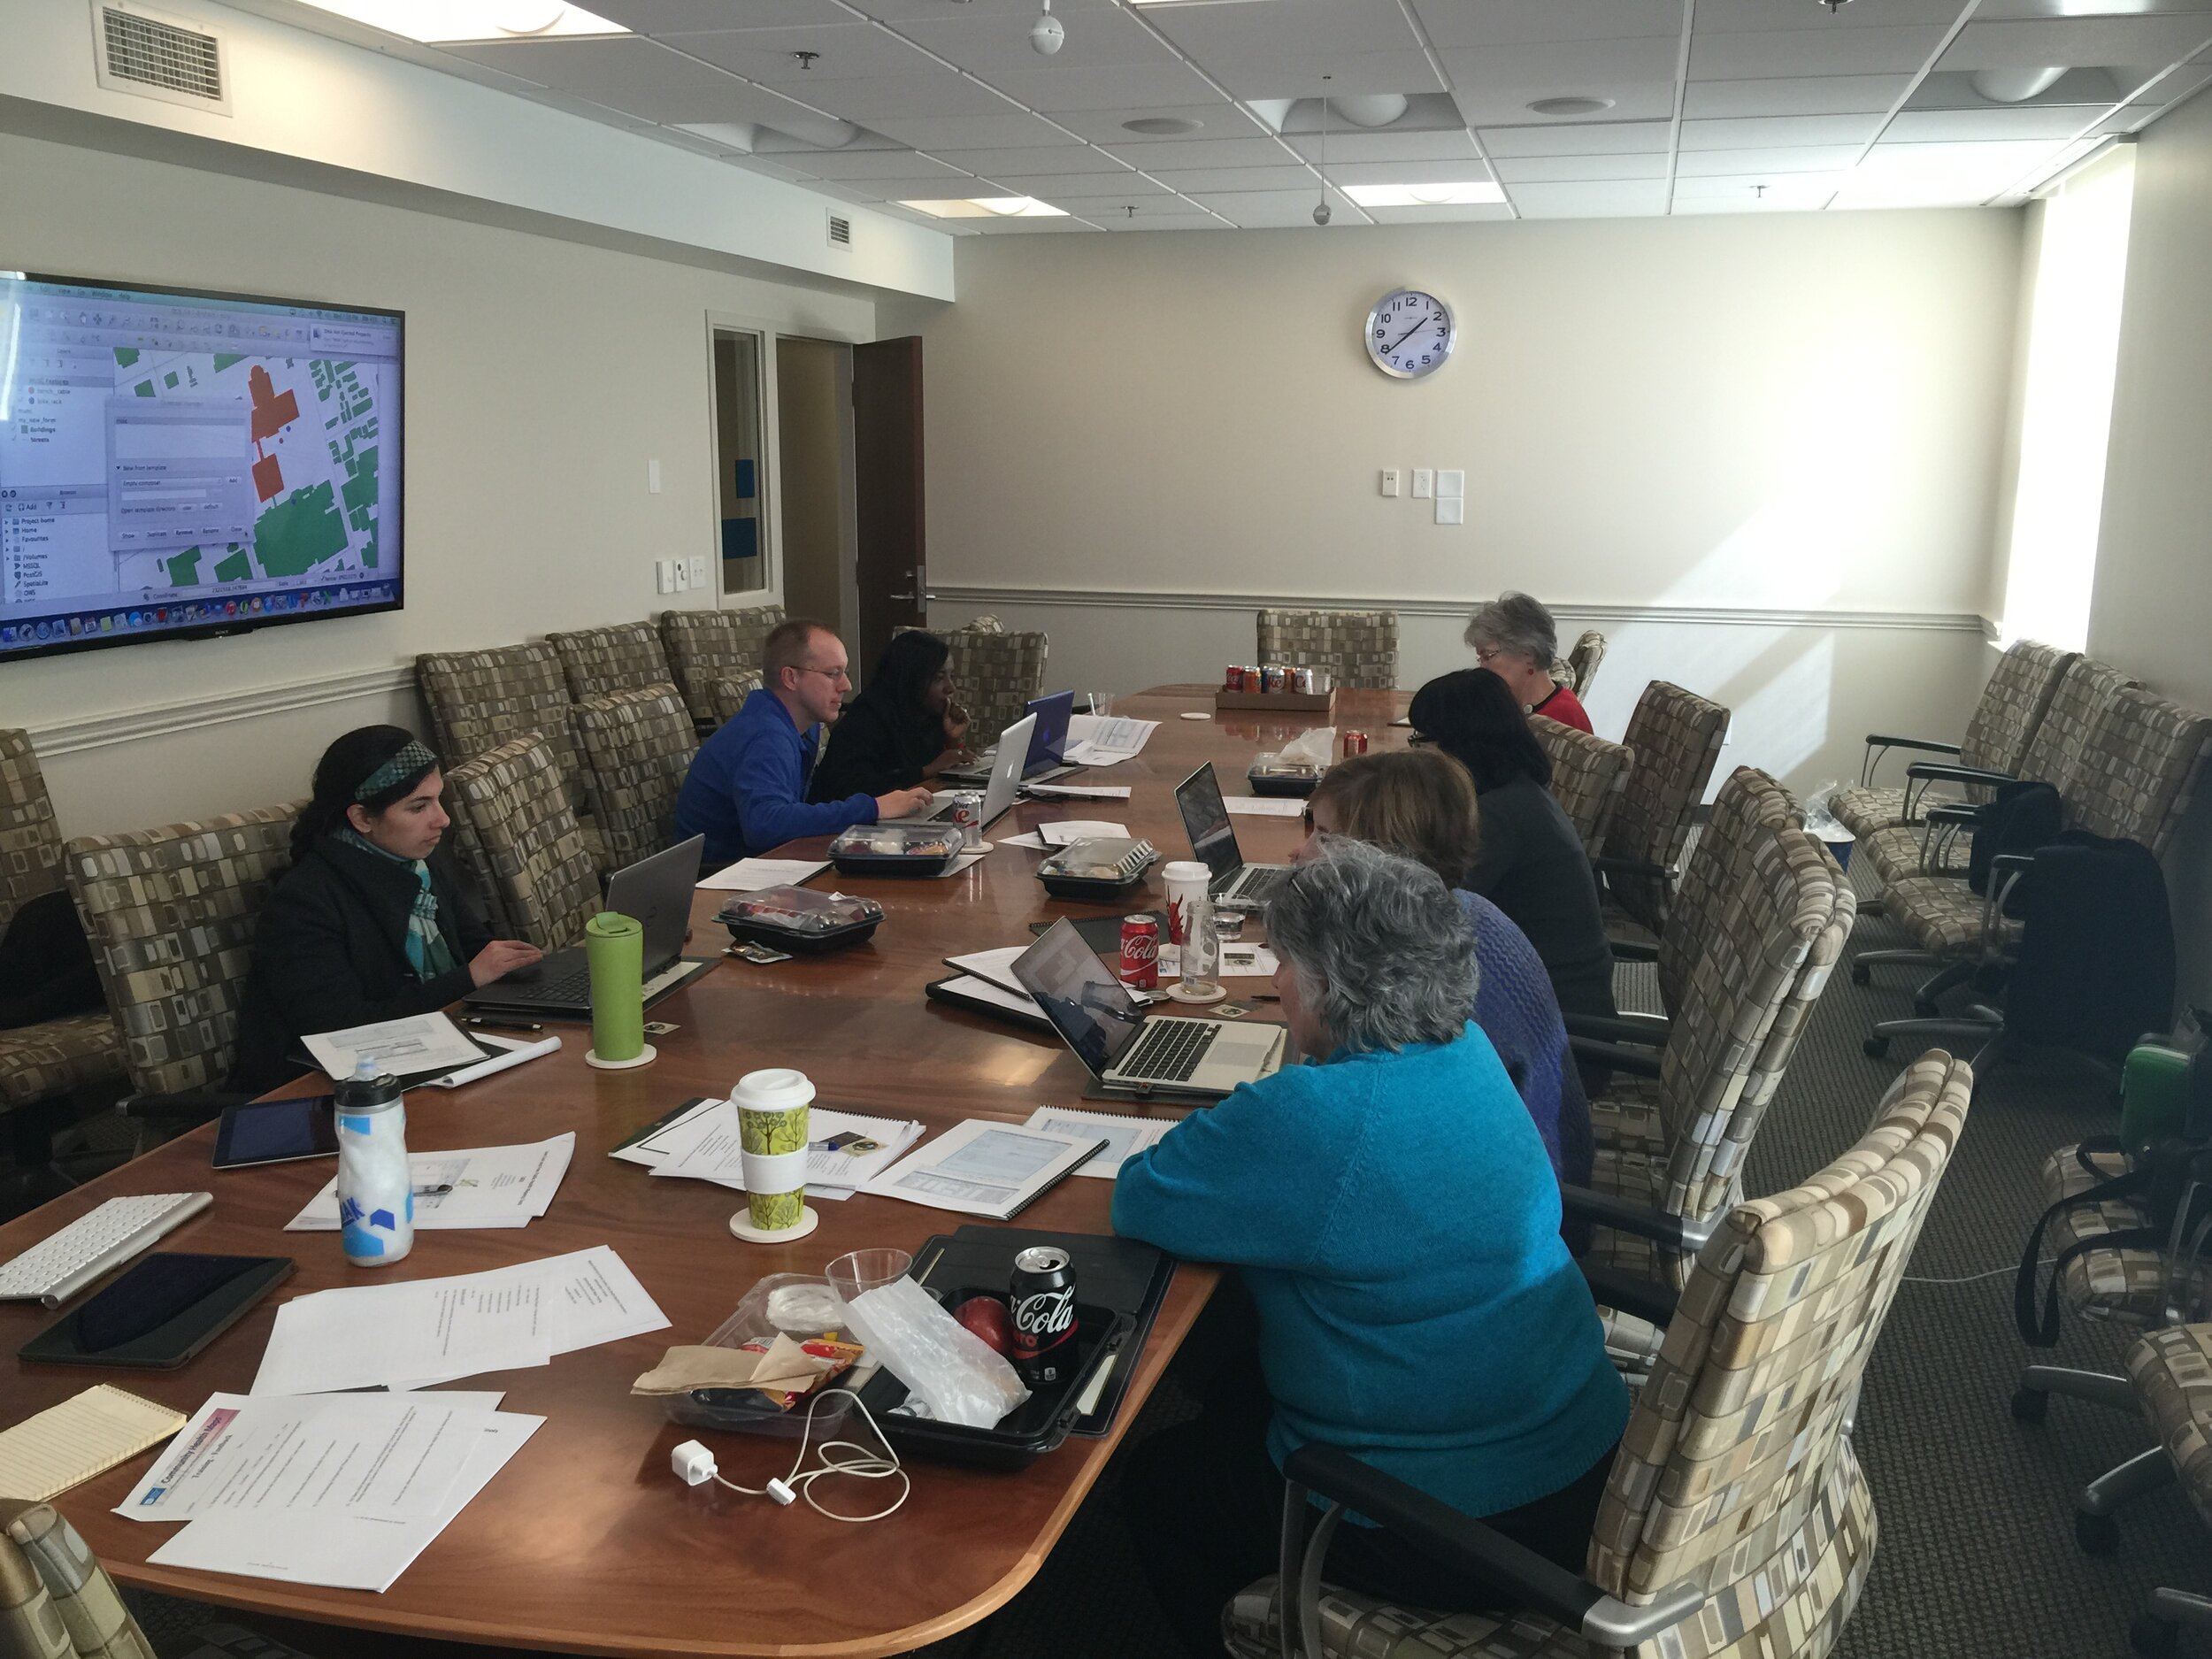
Community Health Maps (CHM) conducted it's largest and most successful workshops ever at the end of September at the Medical University of South Carolina (MUSC). The training at MUSC was divided into three workshops and a presentation. The attendees were a mix of professors, students and researchers, most of whom had little to no experience with GIS. Despite this fact, nearly everyone was able to collect data and make a map. This is a testament to the easy to use nature of the CHM workflow.It began Monday morning with the first workshop. This was an Intermediate Session for those Community Health Mappers who had been working on projects since the April CHM workshop. We spent two hours covering more advanced topics and answering project specific questions.Kurt Menke explaining advanced QGIS features.Following that, Kurt Menke presented a CHM project overview at a brown bag lunch session to 30 attendees. Matt Jones closed this session with a 10 minute talk detailing how he used The Community Health Maps workflow this summer to map access to care on Johns Island.The second workshop was Monday afternoon. It was a two hour session covering field data collection with iForm, and mapping that data online with CartoDB. There were 55 attendees at this session, the vast majority of whom had no GIS experience. In just two hours all 55 attendees were able to collect field data and make a map in CartoDB!iForm and CartoDB Workshop AttendeesThe final workshop on Tuesday was a 5 hour session covering the use of QGIS. The workshop consisted of a custom Charleston based QGIS exercise. Each of the 35 participants worked with a set of Charleston GIS data while learning the basic layout of QGIS. They learned how to add data, style it, and compose a map. The workshop ended with a discussion of each participants goals and project specific questions.QGIS Workshop AttendeesIn total almost 80 people attended one or more sections of the training! Thanks go out to Dr. Deborah Williamson for hosting the workshops, Dana Burshell for organizing the entire event and assisting during the workshops, and to Sarah Reynolds who was invaluable in providing Mac and QGIS support!

Community Health Maps Presentation and Training at the Medical University of South Carolina

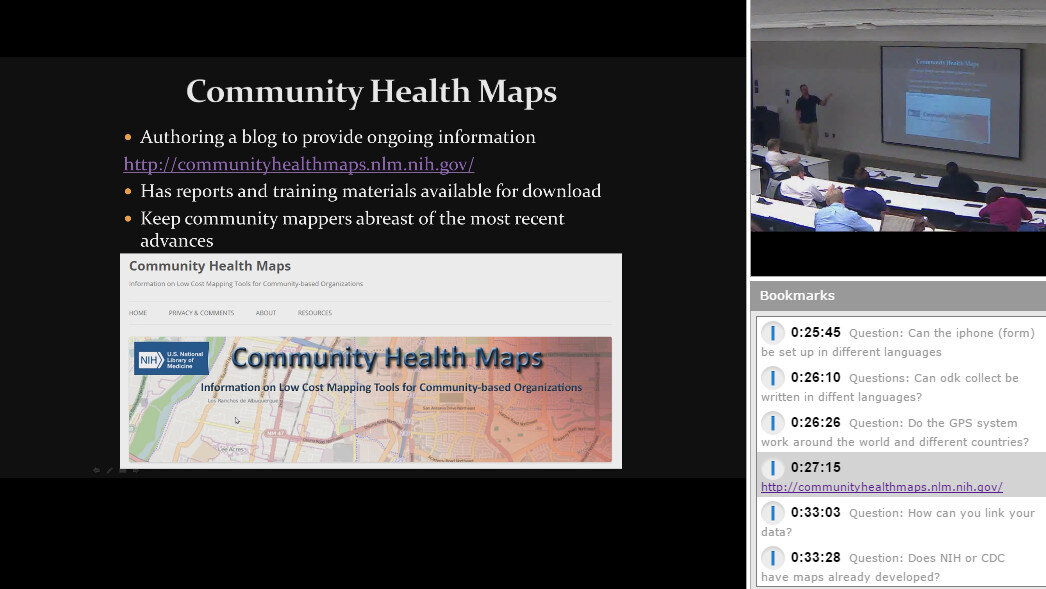
In May Kurt Menke presented the Community Health Maps project, and conducted a training at the Medical University of South Carolina College of Nursing. The presentation was recorded and is now available online. The presentation was about 45 minutes and includes the powerpoint slides, audio and visual. This is a great way for you to learn more about the project from the comfort of your own office!Community Health Map Presentation at MUSC

Teens Map Environmental Health of Their Community (Sea Islands, South Carolina)

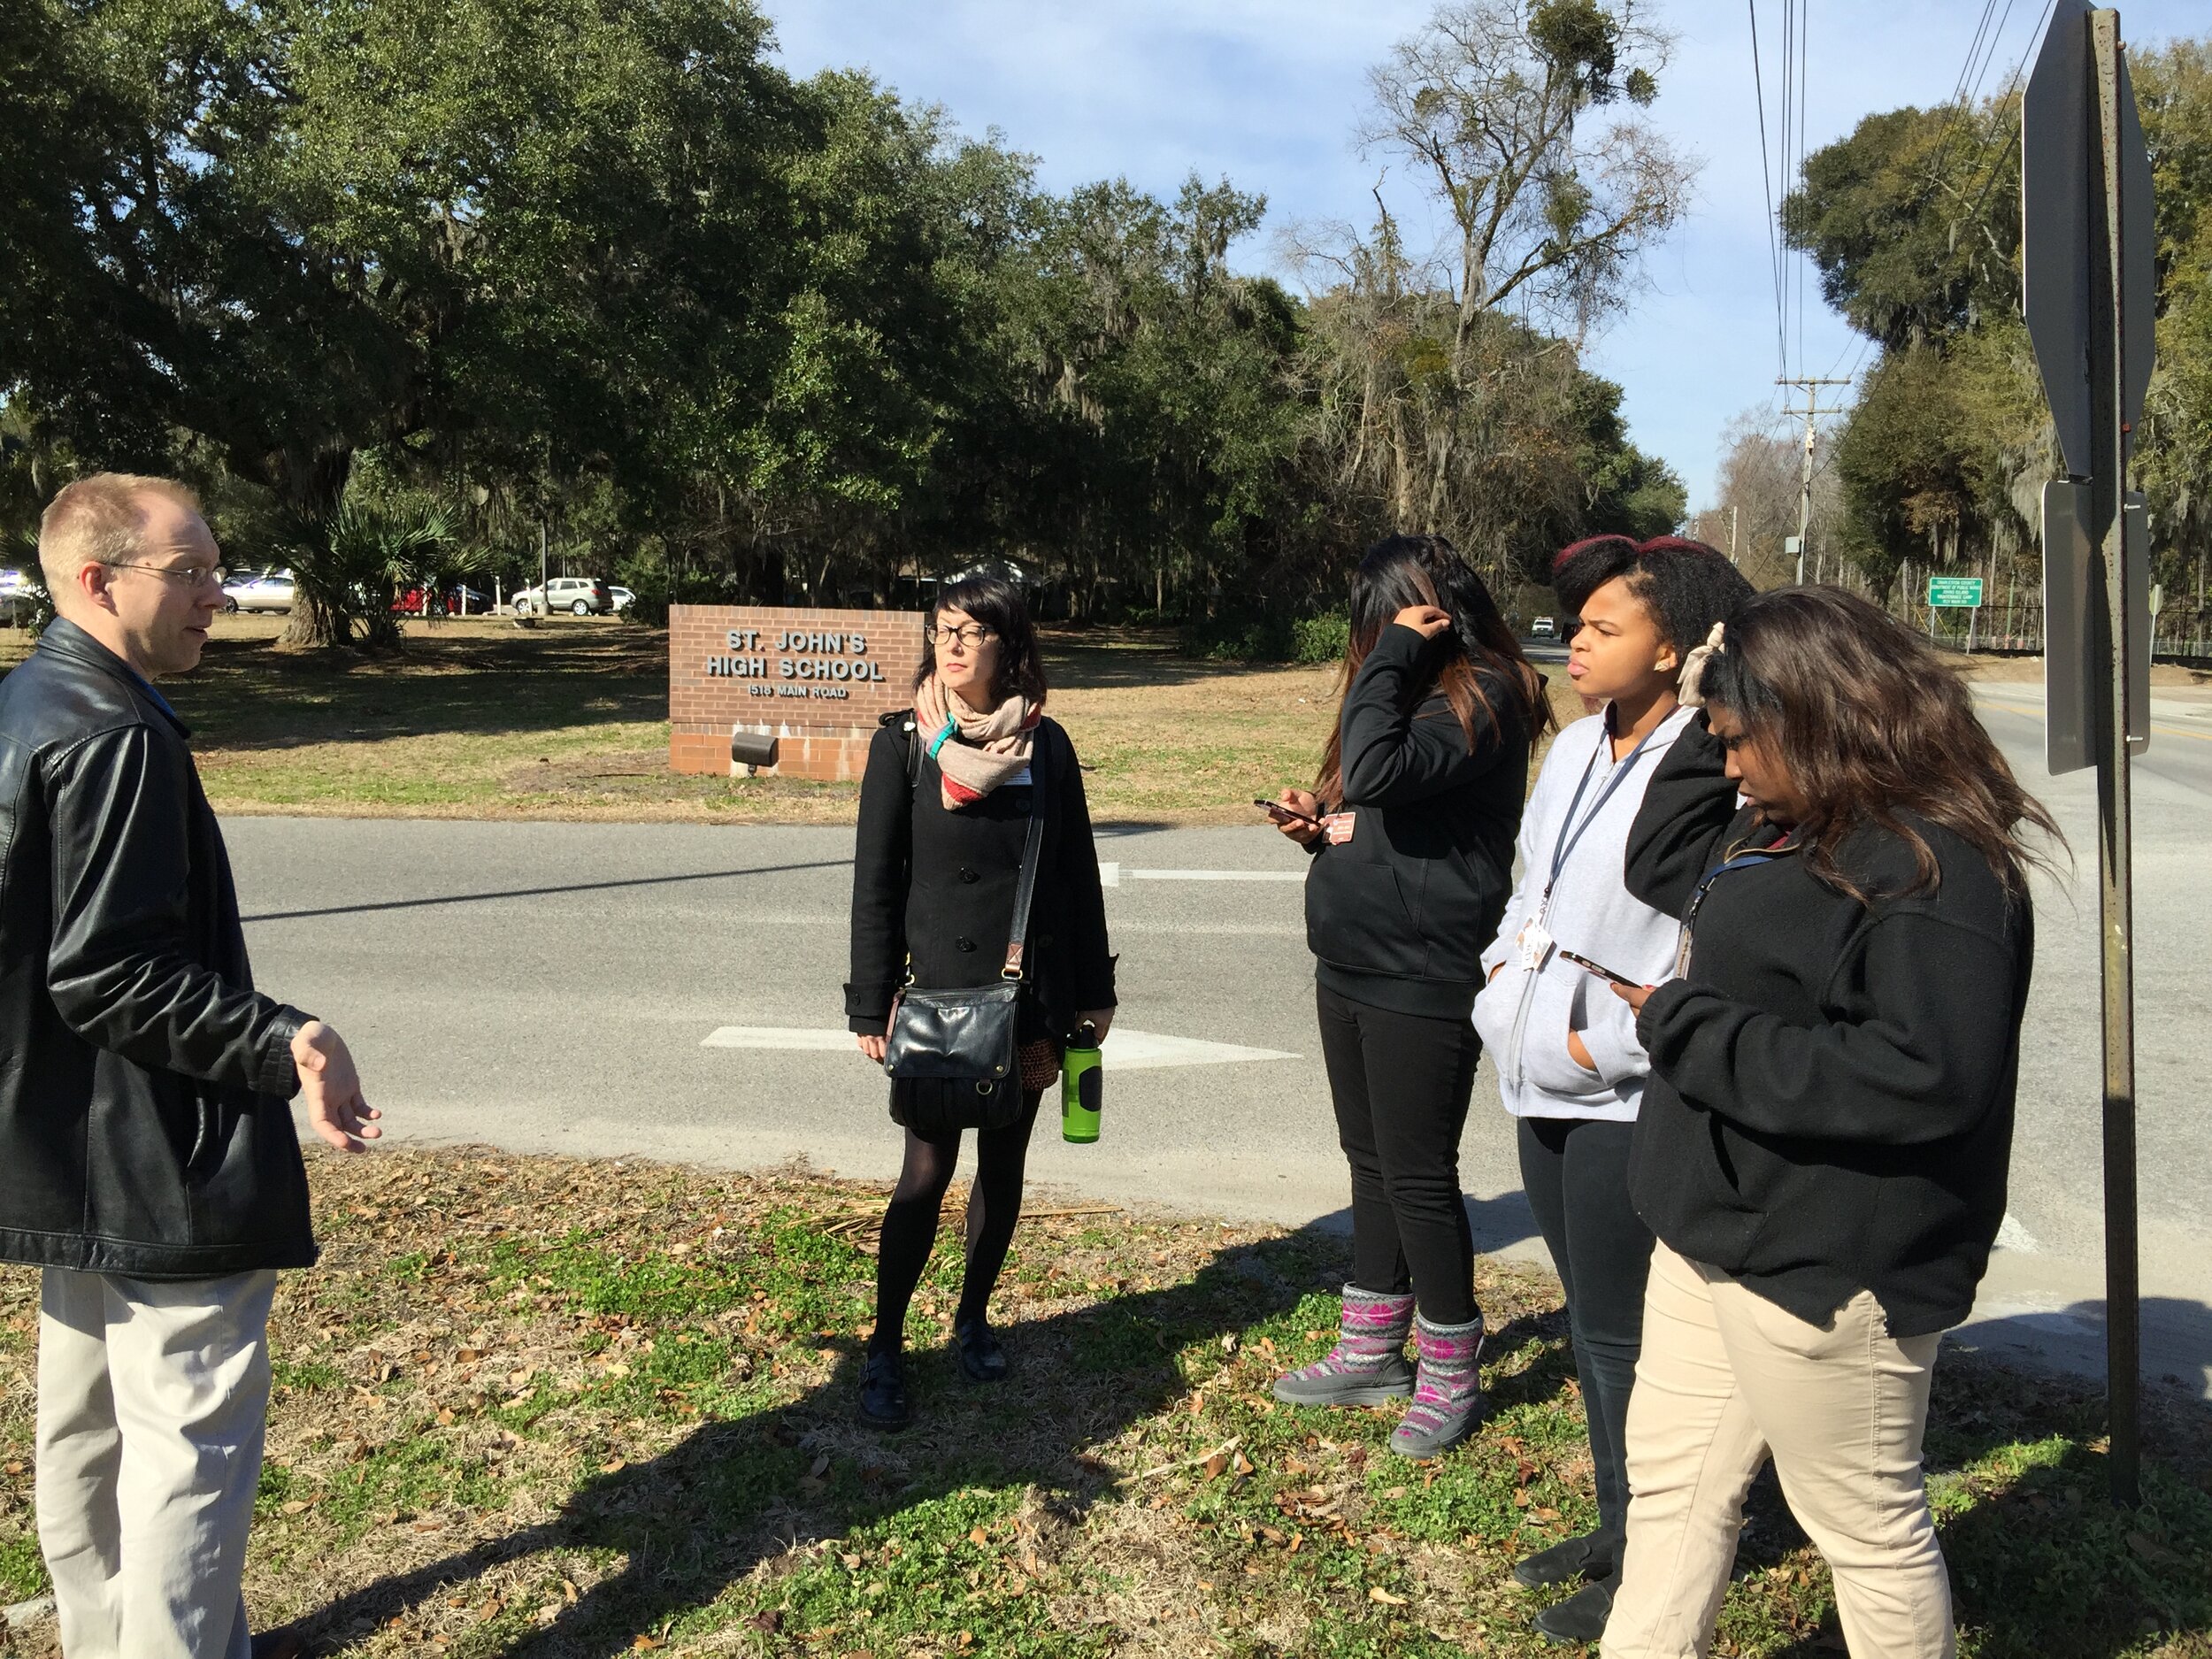
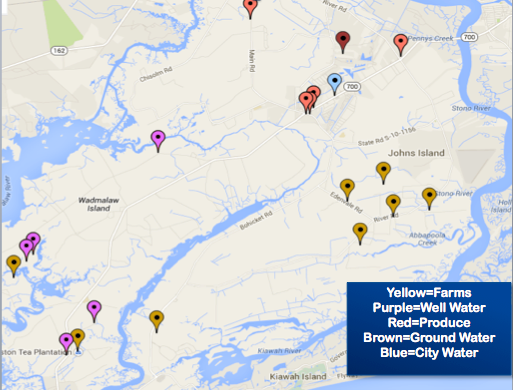
By Guest Blogger: Derek Toth - Communities in Schools CharlestonThe Teen Health Leadership Program (THLP) is in their eight year of existence at St. John’s High School on Johns Island. The program gathers leaders of the school together and focuses on a health topic they feel is affecting their community and assists the community in understanding this topic through the use of media dissemination.  In the past, topics included Autism, Cancer, Stress, Obesity and Alcohol and Drugs and This year, the students wanted to look at their community as a whole with a topic of Environmental Health.The THLP students wanted to see what makes their Sea Island community different.  The Sea Islands are composed of John’s Island, Wadmalaw Island, Seabrook Island and Kiawah Island outside of Charleston, South Carolina.  Students primarily come from John’s and Wadmalaw Islands. These islands are extremely different for many reasons. The students wanted to be able to translate these differences in a new form for the Teen Health Leadership Program. The students were presented with an opportunity to use the Community Health Mapping tools discussed on this blog, and some training made available from the National Library of Medicine. With GIS, the students can pin point differences within the islands for their community to see.(This January Kurt Menke conducted a Community Health Map training at the Medical University of South Carolina College of Nursing.  Two teachers with Communities in Schools Charleston attended and the next afternoon Kurt Menke went to St. John's High School and showed the students how to map their campus with their iPhones.) Derek Toth teaching his students to map their campusThe students used smart phones, along with an app named iForm, to map points of interest with GPS. They collected well water locations, ground and city water sources, as well as, places in the community to purchase food. The food resources they mapped included farmers markets, produce stands, grocery stores and local farms. The students were able to indicate these points on a map. Google maps was used to create the final map.With the final map they were able to determine that people on Wadmalaw Island have less access to food and water than those on St. John's Island. For example, Wadmalaw Island is limited in places to buy produce or groceries, and has limited access to the farms that John’s Island has. Residents of Wadmalaw Island are on well water, and obtain their produce at the local grocery store on Johns Island, as opposed to driving to one of the many local farms.Teen Health Leadership Program Seal Islands Access to Food and WaterThe final  map was inserted into the Environmental Health project for the community to have a unique perspective of their Sea Island Community. Overall, the students felt that using their smart phones to map their community was easy to learn and fun. They were able to grasp the information quickly and seemed pleased with their results. The group feels it reached it’s goal of accomplishing a fresh look at the Sea Islands and felt it added to their presentation on Environmental Health.

Community Health Maps Survey

If you've followed this blog, you know that  the goal of the Community Health Maps initiative is to help community organizations identify and apply low-cost and easy-to-use online mapping tools (GIS). If you are a first time visitor to this site we encourage you to peruse the blog entries.The purpose of these tools is to improve understanding and visualization of health conditions in the community so that attention might be best directed to reduce health disparities. This site is a collaborative effort between the National Library of Medicine, the Center for Public Service Communications, and Bird’s Eye View.To help advance this mission we have developed a survey.  The goal of this survey is to assess community health organizations’ satisfaction with GIS / mapping resources currently available to them.  The information will be used to improve NLM’s Community Health Maps site and tailor it to specific user requirements.You are encouraged to click the link below and take this brief survey.https://www.surveymonkey.com/s/NLM_GISsurvey

Community Health Maps Conducts a Training in the South Carolina Lowcountry

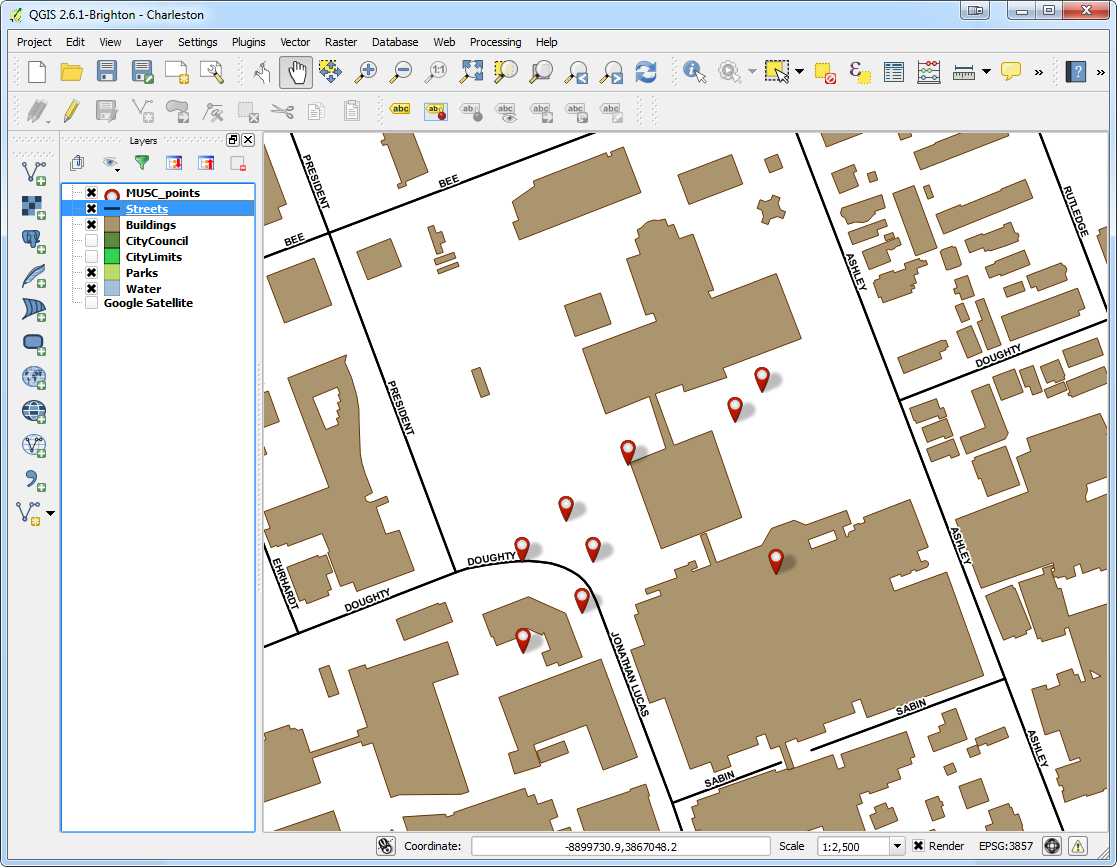
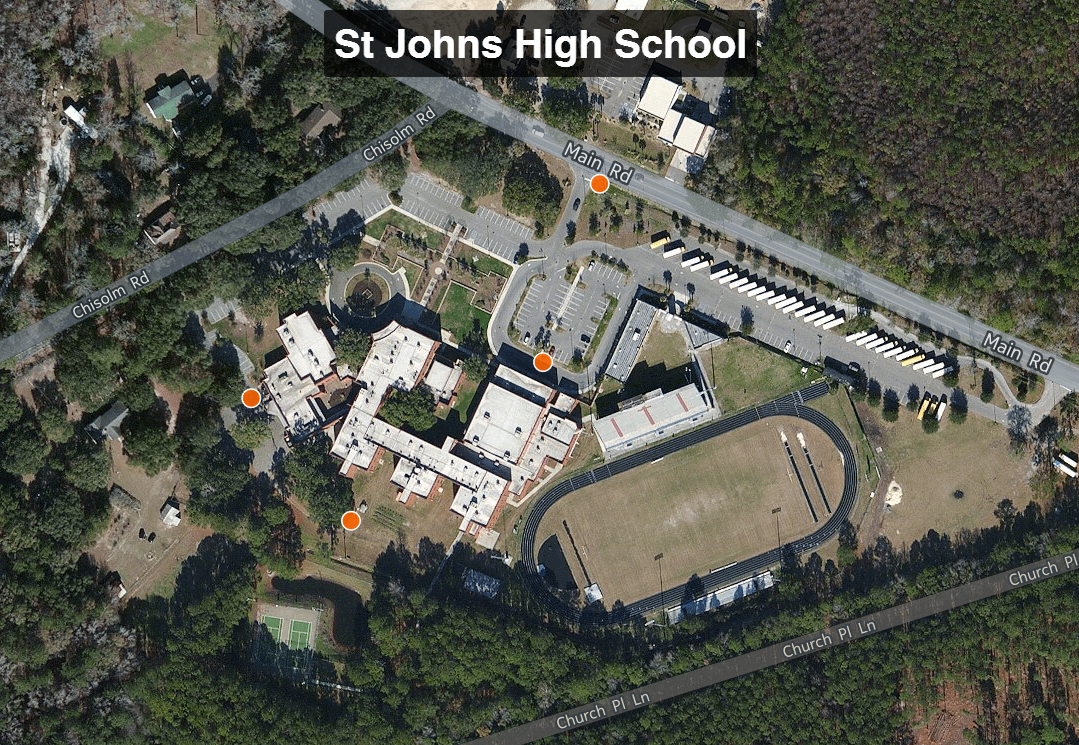
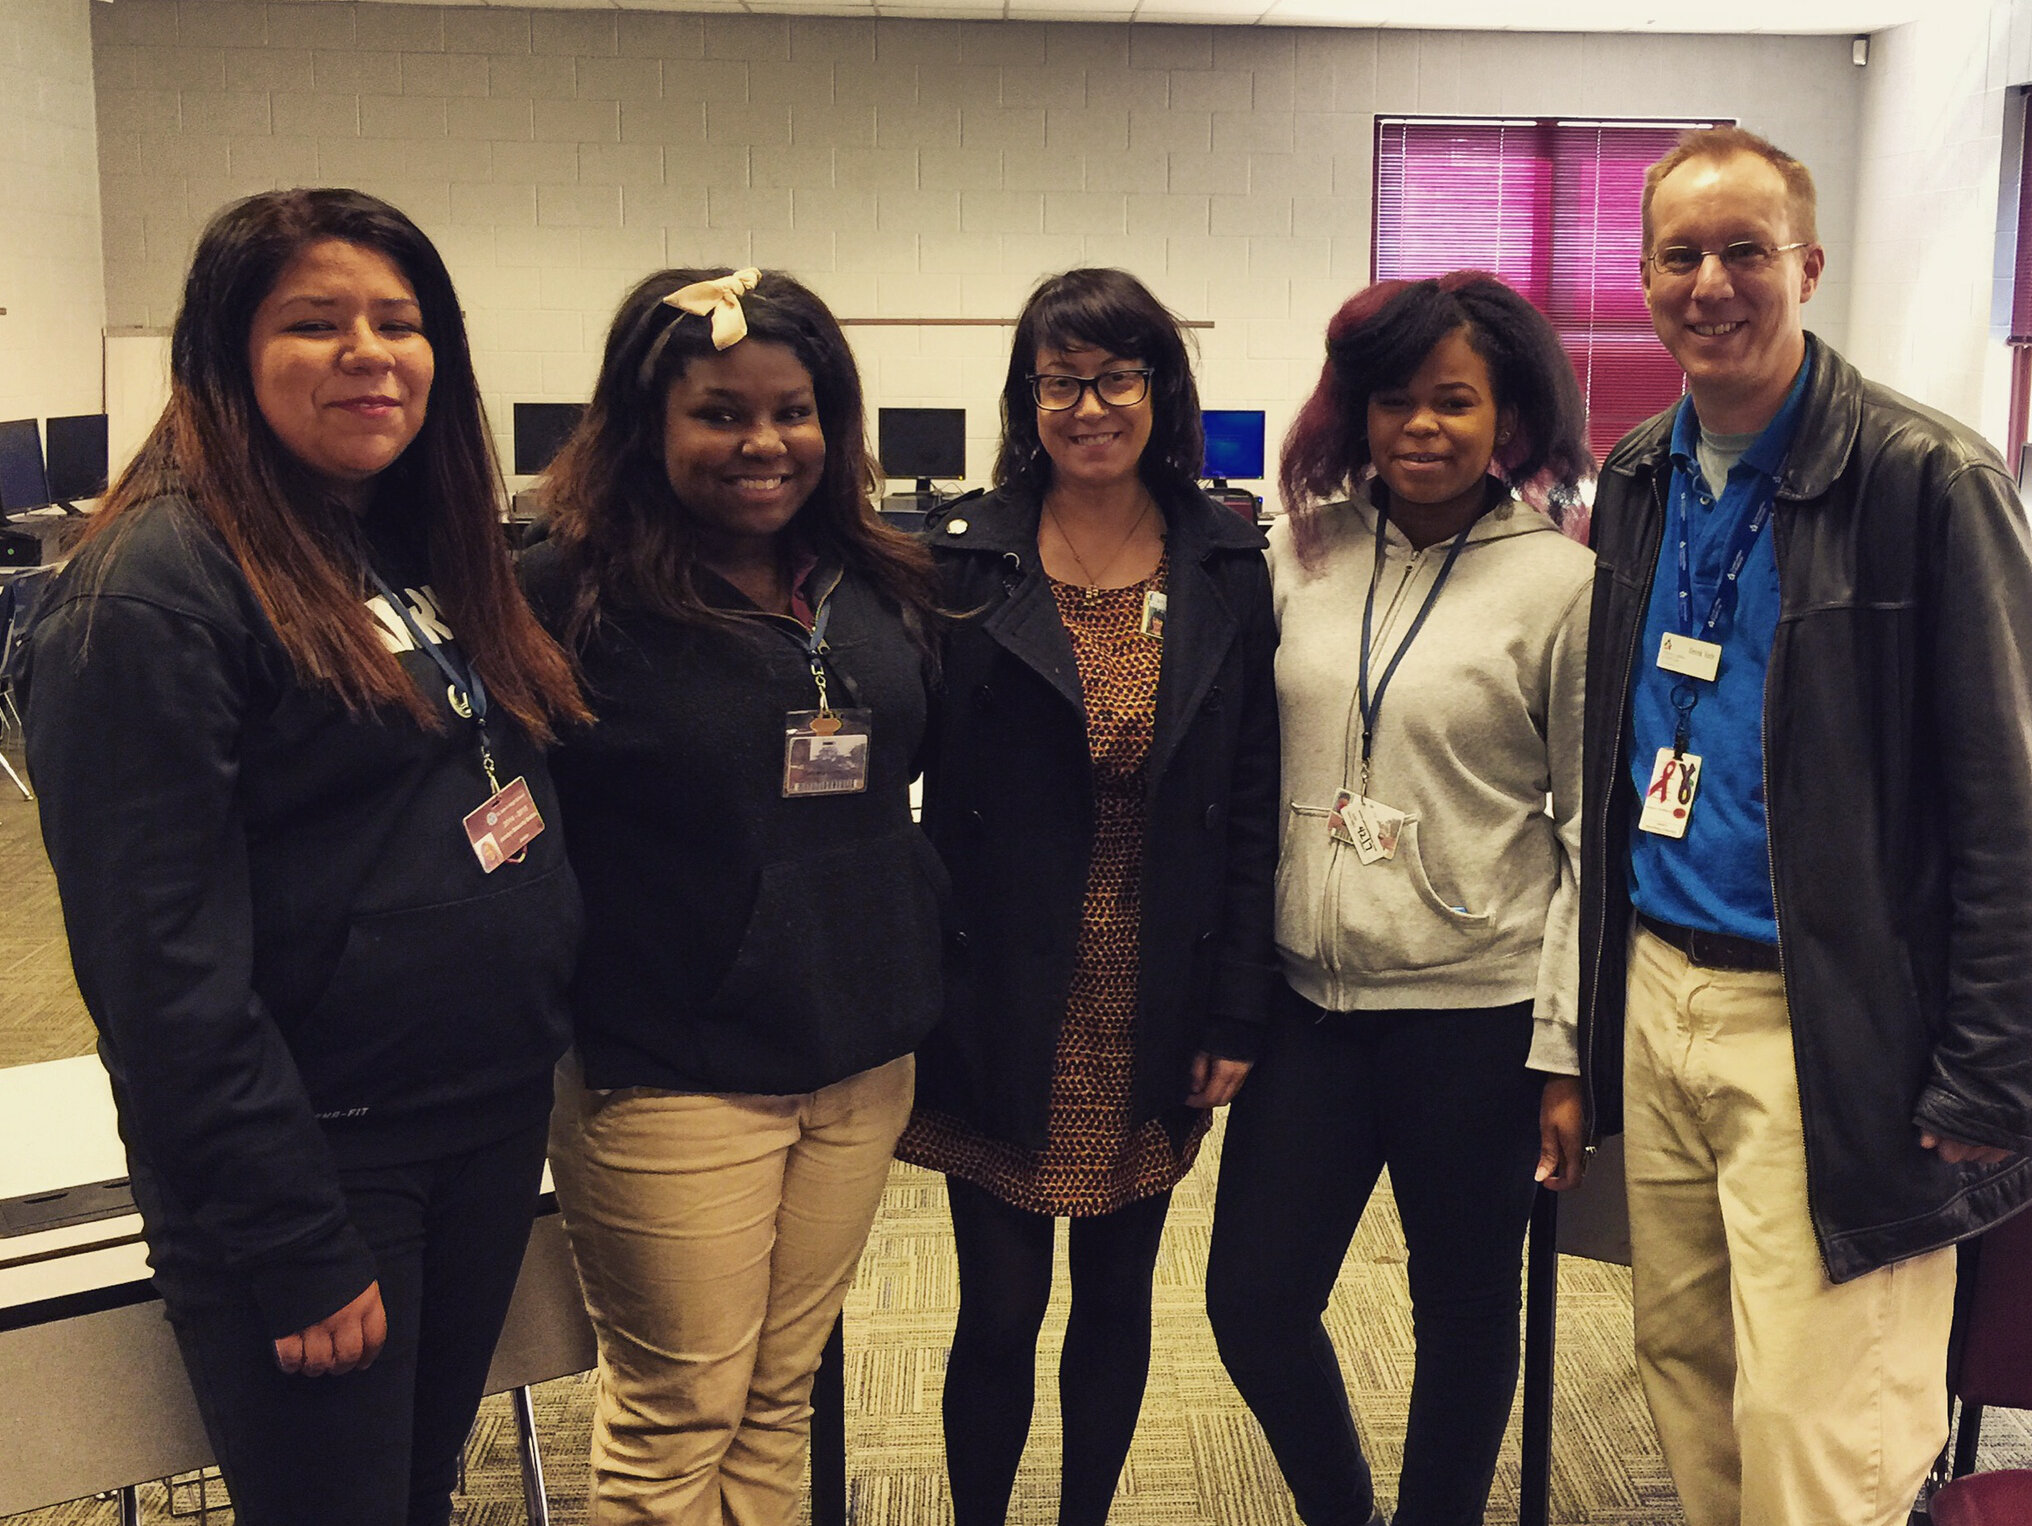
Recently Kurt Menke headed to Charleston, South Carolina to train several groups how to map their communities. This region is also known as the 'lowcountry' due to the flat, low elevation geography. The training was hosted by the Medical University of South Carolina (MUSC) and included people from Communities in Schools - Charleston (CISC) and the MUSC College of Nursing.MUSC Community Health Mapping Training SessionFirst everyone learned how collect GPS field data with iPads. For this we used a new app named iForm. This app was used in lieu of EPI Collect, which no longer supported on iOS. (The next blog post will cover iForm in more detail.) iForm is an app very similar to the Android app ODK Collect, allowing a custom data collection form to be developed. To practice we collected bike rack locations  and seating areas around the MUSC campus. The afternoon was spent working with everyone's  data. GPS data points were brought into QGIS and shown against some local Charleston GIS data layers.MUSC Data Points in QGISThe points were also uploaded to CartoDB. CartoDB is another new component of the Community Health Mapping workflow. It has become more intuitive than GIS Cloud and worked really well. (Note: There will be a post on using CartoDB soon too.)The following day I visited CISC's Derek Toth and three of his students at St. John's High School on John's Island, SC. Over a working lunch Mr. Toth showed students how easy it is to collect GPS points with their iPhones. We collecting several points while walking around the campus.IMG_5459Afterwards we went back inside and showed them how to upload the points into CartoDB and make a map. The figure below shows the results of 45 minutes worth of work! Click on the map to open the live version.St Johns High School MapThis spring these three juniors will be leading the charge to map their island!  They will be presenting their work to the National Library of Medicine later this spring. I look forward to seeing their work!St. Johns High School Mapping Team

Technology + Youth = Change

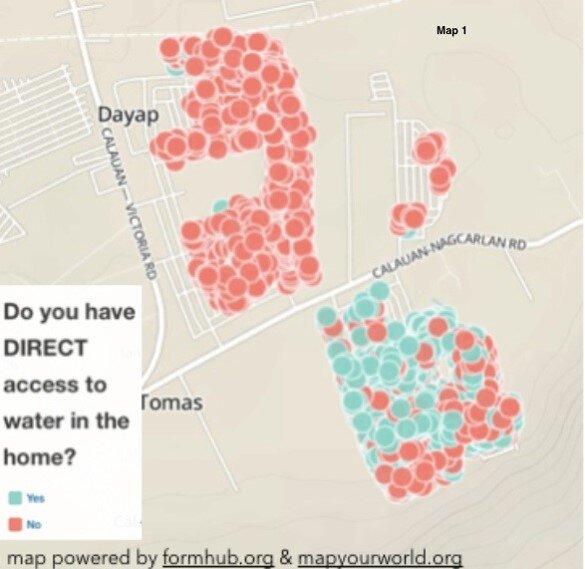
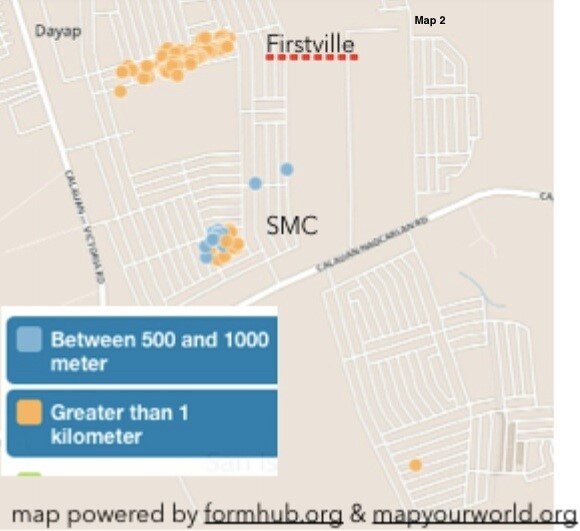
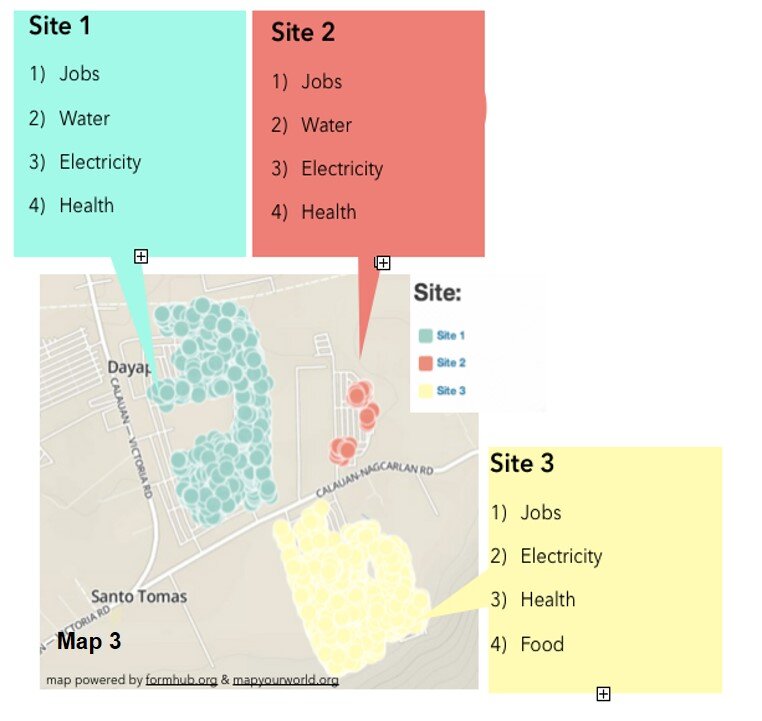
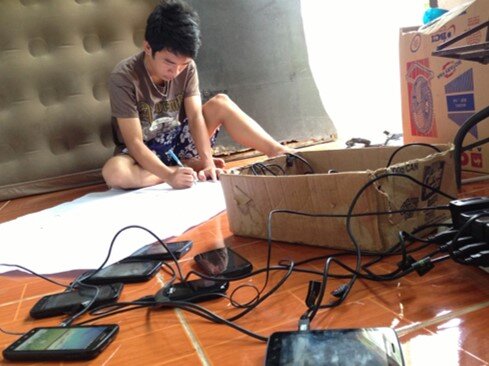
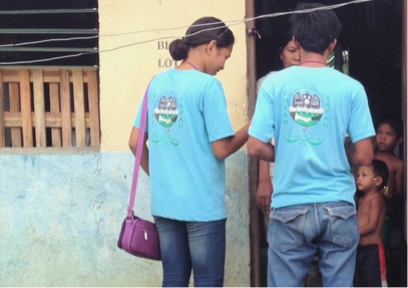
by Chad Noble-TabioloIt all started in May 2013 when I watched the documentary entitled Revolutionary Optimists on PBS’s Independent Lens. It showed how young people from a slum in Kolkata, India were able to map the deficient and unsafe water taps in their community, in order to plea with the government for more and safe drinking water lines. The film highlighted technology in an unconventional way. It showed GIS-technology as an innovative tool to mobilize youth for social change.This heralded the beginning of a partnership with Map Your World to develop a mapping project in the Philippines in the summer of 2013. Through coordination with domestic and international partners, the youth mapping program was implemented in Southville 7 — an impoverished and neglected slum community, about three-hours south of metro Manila. The issues faced in Southville 7 ranged from lack of access to jobs, water and electricity to food insecurity and child and maternity health; and because of a lack of response from both the government and non-governmental sectors, the project was aimed to raise awareness and demand change.In just a few weeks, a dozen phones were donated. Youth, ranging from 15 to 23 years old, were trained to go house-to-house to collect data. By the end of three months, 3000 families were surveyed and the needs of the community were mapped. Depicted below is Map 1, which shows the families who have direct access to water in their homes.Families who have direct access to water in their homes.Because of the unequal distribution of resources, it was evident who had direct access to water and who did not. Map 2 shows those families who did not have direct access to water. These families had to walk more than 1 kilometer to a communal water tap.Families who had to walk more than 1 kilometer  to water.Lastly, Map 3, represents the top four needs according to the three different subdivisions or sites in Southville 7.  Collectively these maps and data provide an opportunity for proper and adequate planning for public health infrastructure and needs.The top four needs according to the three different subdivisions or sites in Southville 7: Jobs, Water, Electricity and Healthcare.The Android mobile phones used by the youth were powered by open-source applications for GPS-mapping and data collection. ODK Collect or Open Data Kit was the data collection tool utilized in the project. It can be found on the Android market. (NOTE: This tool is also described in the Community Health Mapping blog post on Field Data Collection). This tool is functional only after uploading a survey form that is created in Microsoft Excel and uploaded to the companion site www.formhub.org. The maps were created online with Map Your World, an online community mapping tool inspired by the Revolutionary Optimists documentary.Map Your World BannerIn the end, the 30 youth involved in the mapping project were able to accomplish an endeavor that many people in their community had not expected. They were able to successfully map who in their community had access to water, electricity, jobs and vaccination for children under five years old, among others. They became leaders who are now equipped with leadership and technological skills that many in their community lack. They were empowered to raise awareness about the social injustices and health inequalities existing among them.One of the community mappers with an array of Android phones.The Southville 7’s mapping work was primarily a vehicle for instilling hope, and the use of GPS/mapping-technology offered an opportunity for the youth to be the voice for their community. According to one youth, “For me, mapping is like knowing. Knowing the problems, and how people are coping with them. Through the work we can open the eyes of the people, not only the things that can help them, but things that can help us all.Youth mapping their community