Announcement

CHM Workshop at the National Tribal Forum in Spokane, WA

This week the Community Health Maps team is heading to Spokane, Washington to teach a workshop at the National Tribal Forum for Excellence in Community Health Practice! We are honored to participate and engage a new community of mappers.2016-08-29_161231It is a four hour workshop and by the end attendees will have:

  • Built their own data collection form in Fulcrum
  • Gone outside and collected some points
  • Made an online map of what they collected in Carto
  • Learned how to work with QGIS!

We'll report back on how it goes when we return. Stay tuned!

CartoDB Rebranded as Carto

Community Health Maps has long recommended the use of CartoDB for those interested in low cost online mapping and data visualization. In fact, CHM caught the beginning of this wave because CartoDB wasn't even launched until 2012!CartoDBEarly last month (July 2016) CartoDB was rebranded as Carto, which includes a new logo. However, once you get beyond the new logo your current account page including your data and maps remains unchanged.  You can still build maps the way you always have in what is now known as Carto Editor.CartoThe main difference is that Carto now offers up a new interface named Carto Builder. The good news for Community Health Mappers is that their goal with Carto Builder is to introduce an updated interface. One that still does not require complex geospatial skills and programming. With Carto Builder they aim to make Location Intelligence (LI) more accessible to more people.  This means it will give you point and click access to deeper analysis of your data. Builder will have all the functionality currently found in Editor along with the new tools.Eventually Carto Editor will be phased out and Carto Builder will be the interface everyone uses. You can request early access to Carto Builder here: http://go.carto.com/request-beta-access. New users of Carto will be given access the the Carto Builder in phases, over the next several months. All existing maps and data will be seamlessly migrated to the new interface. The following page answers Frequently Asked Questions about the migration from Editor to Builder: https://carto.com/docs/carto-builder/faqs/Once the migration is complete I will post about the new functionality. Stay tuned! 

Discover QGIS - A new QGIS workbook!

Two years ago, myself and several colleagues authored the GeoAcademy which is the first ever GIS curriculum based on a national standard – the U.S. Department of Labor’s Geospatial Competency Model (GTCM). The GTCM consists of the knowledge, skills and abilities needed to be a working GIS professional.  Our team was honored with the 2015 GeoForAll Educator of the Year award for this effort. The GeoAcademy consists of 5 complete college courses.

  • Introduction to Geospatial Technology Using QGIS
  • Spatial Analysis Using QGIS
  • Data Acquisition and Management Using QGIS
  • Cartography Using QGIS and InkScape
  • Remote Sensing Using QGIS and GRASS

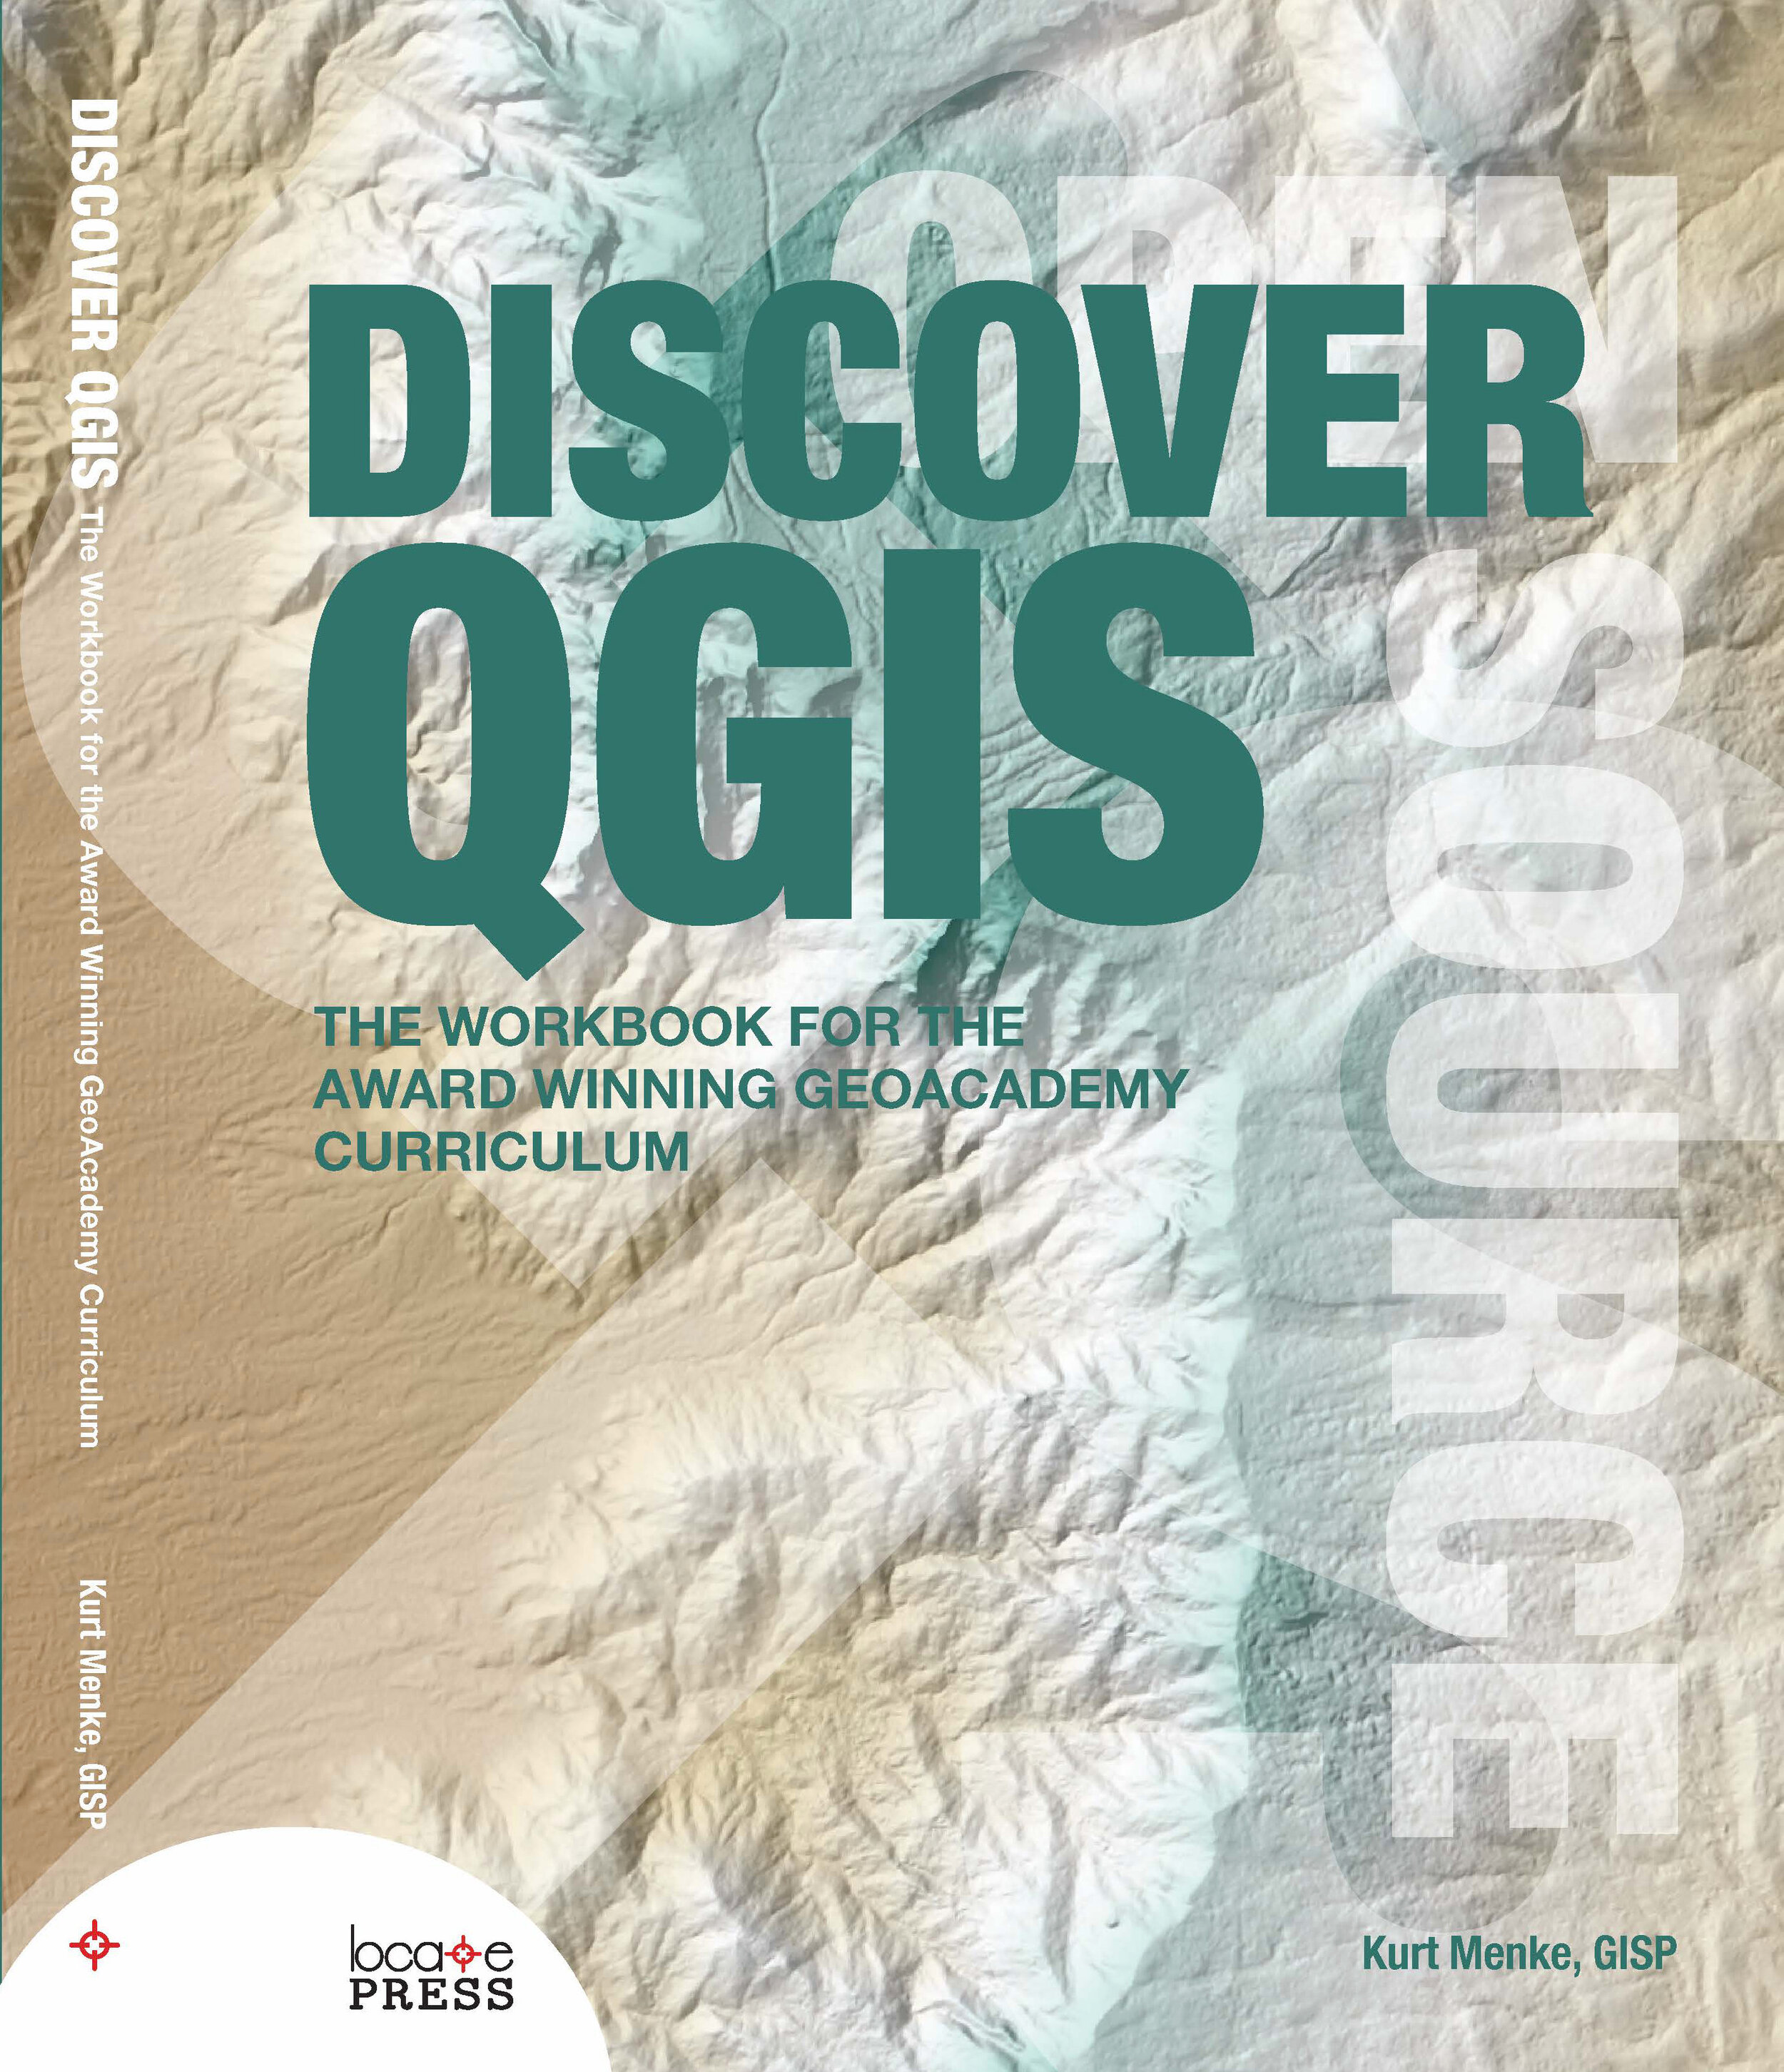
This winter I converted the curriculum to fit into a convenient workbook format with Locate Press. The workbook is called Discover QGIS.As you may be aware, QGIS is evolving rapidly. A new version is released every 4 months!  Due to this rapid development pace each spring a long-term release (LTR) is created. The LTR version is supported for a calendar year and is better for production environments. Originally written for QGIS 2.4, the GeoAcademy material in this workbook has been updated for use with QGIS 2.14 LTR. It therefore represents the most up-to-date version of the GeoAcademy curriculum. In addition to working with QGIS, it also includes exercises doing analysis tasks with the powerful GRASS GIS software, both alone and via the GRASS QGIS plugin. The cartography section includes exercises with InkScape. Here you'll learn how to begin a map in QGIS and use InkScape to finish a publication quality map.At the moment the digital version of the workbook is available as a Preview Edition for only $24.99. Purchasing this preview entitles you to the full version when it is released. There are just a few formatting issues to resolve.This book will be a great resource for Community Health Mappers wanting to build their skills. The 470 page workbook comes with exercise data, challenge exercises and solution files!Discover QGIS

Announcement: Extreme Heat & Health Webinar

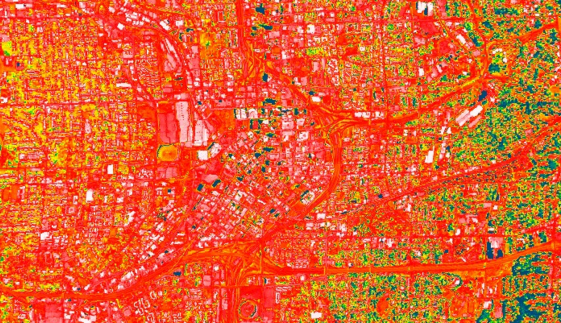
There will be a webinar next week entitled: Extreme Heat and Health: Creating Environmental Intelligence Through Science, Predictions, and Engagement. The specific date and time are: April 28th, 2016 from 4 - 5:30pm EDT. This will likely be an interesting webinar for many Community Health Mappers! Click this link to learn more.2016-04-22_101608

White House Announces the Opportunity Project

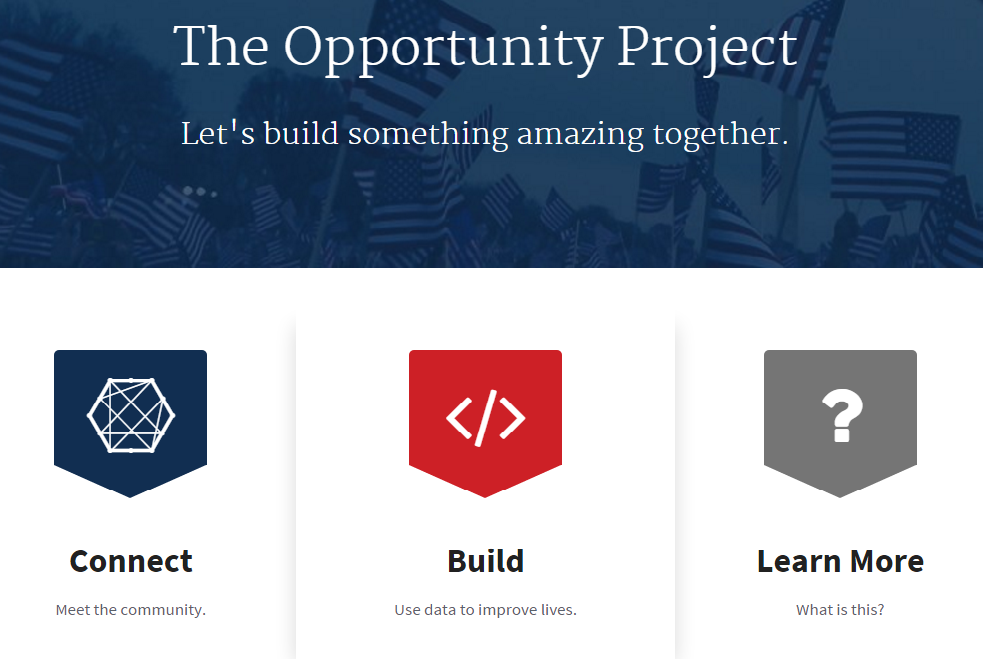
This week the White House announced the Opportunity Project. It is an open data initiative geared towards empowering communities with data and tools to improve economic mobility. Open data is the data equivalent of open source software. It is licensed so that it is freely available to use by anyone.The main page for the project can be found here: http://opportunity.census.gov/.Opportunity Project WebsiteIt includes links to sources of open data and online tools built on open data, ,many of them map based. This looks to be a great resource for Community Health Mappers! 

A New Version of QGIS v2.14 Has Been Released!

Currently a new version of QGIS is released every four months!  To help users deal with this rapid development pace, the version put out each spring is designated as a long-term release (LTR). This means it will be supported for one calendar year. After that, new stable versions continue to be posted quarterly and any bug fixes associated with those quarterly versions are applied to the LTR. The LTR is recommended for production environments. It has a slower release cycle, and receives regular bug fixes throughout the year. Monday February 29th QGIS 2.14, the next LTR was released. It is nicknamed 'Essen' after the town in Germany where a recent developer meeting was held.essenEssen has a lot of new features. You can visit the Visual Changelog to read about all the new features in detail. You can also see who developed and sponsored each new feature. Community Health Mappers might be especially interested in these new features:

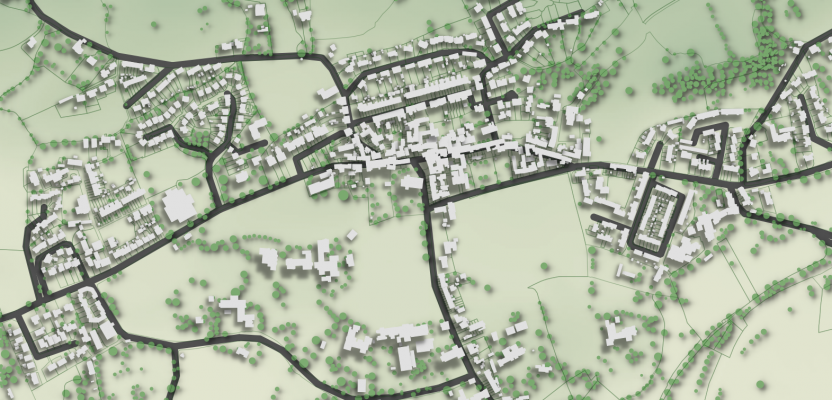
  • the new 2.5 D renderer which allows you to extrude features into space.

With25DandTreesShaddow-832x400

  • improved labeling
  • better control over map elements in the Print Composer
  • an improved Processing Toolbox
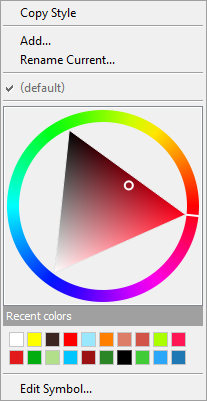
  • the new widget you get by right clicking on a layer in the Layers Panel and choosing Style. It allows you to change the color for a symbol without having to open a single dialog box!

2016-03-02_151603If you are using QGIS you should visit the download page and install the latest version! Note that the Mac installer takes a little longer to assemble and may not be available for several more days.Happy GIS'ing!

Community Health Mapping: A New Year Review

To start the New Year I thought I’d begin with a review of Community Health Mapping (CHM). There are a lot of new project partners, and I thought it would be a good time to give a project overview. CHM is a collaborative effort between the National Library of MedicineCenter for Public Service Communications and Bird’s Eye View. The National Library of Medicine is funding the initiative.The overall goal is to empower community organizations serving vulnerable or underserved populations with low cost, intuitive mapping technology. Therefore we’ve been working with programs organizations who:

  • Focus on vulnerable populations
  • Frequently use and collect data
  • Need effective, scalable & easy to use mapping tools
  • Lack resources (i.e., for proprietary GIS training & software)

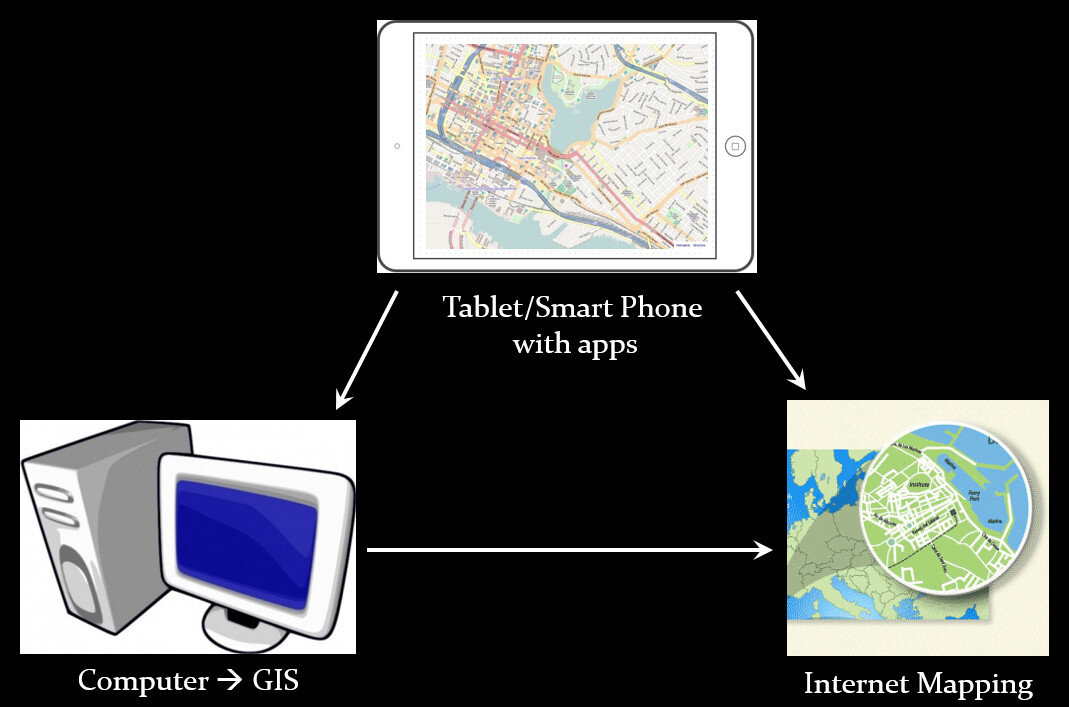
We have identified a suite of tools that allow you to collect custom field data, analyze that data, combine it with other spatial datasets, and generate both static maps and/or dynamic maps on the internet. This allows organizations to collect and work with their own data, and if appropriate, share it with others. CHM involves three components that meet all basic mapping needs:

  • Field Data Collection
  • Desktop Analysis and Cartography
  • Internet Mapping

Community Health Mapping WorkflowA given project may not require all three, however, collectively these components address the basic needs of all mapping projects.Field Data Collection:Rather than focusing on the use of expensive GPS receivers, we recommend the use of smart phones and tablets for these reasons:

  • Most community-based organizations already have them!
  • Many know how to use them
  • They're intuitive
  • They're portable
  • They come with an on board GPS receiver (iPhone 5 uses GPS + GLONASS)
  • Have on board cameras
  • Can connect to wireless networks
  • Access to the internet
  • Email is available
  • “There's an app for that!”

SmartPhones and Tablets vs. Traditional GPS ReceiversOf course an important consideration is horizontal accuracy. You can read our blog post on that topic to see if mobile smart devices meet your project needs.When collecting data you need to be able to develop your own custom data collection form. The top three mobile apps we have found are:

Desktop Analysis and Cartography:After community field data collection, the next step typically involves bringing the data into a desktop GIS. This is the middle step in the workflow. Here the data can be viewed against basemaps such as Google or OpenStreetMap, and combined with other organizational data. This is also where analyses (proximity, density etc.) can be conducted. Presentation quality maps can also be generated in this step.The software we found to be the best fit is QGIS. This is an open source desktop GIS software. It has many strengths:

  • It can consume many kinds of data, including all the data that would come out of the field data collection apps.
  • It is both intuitive and robust.
  • It has a large suite of geoprocessing tools for analyzing data.
  • It will run on Windows, Mac, or Linux.
  • It is free to download and install.
  • It is well documented.
  • There is a large user community.
  • New functionality is being continuously added. New stable versions are being released every 4 months!
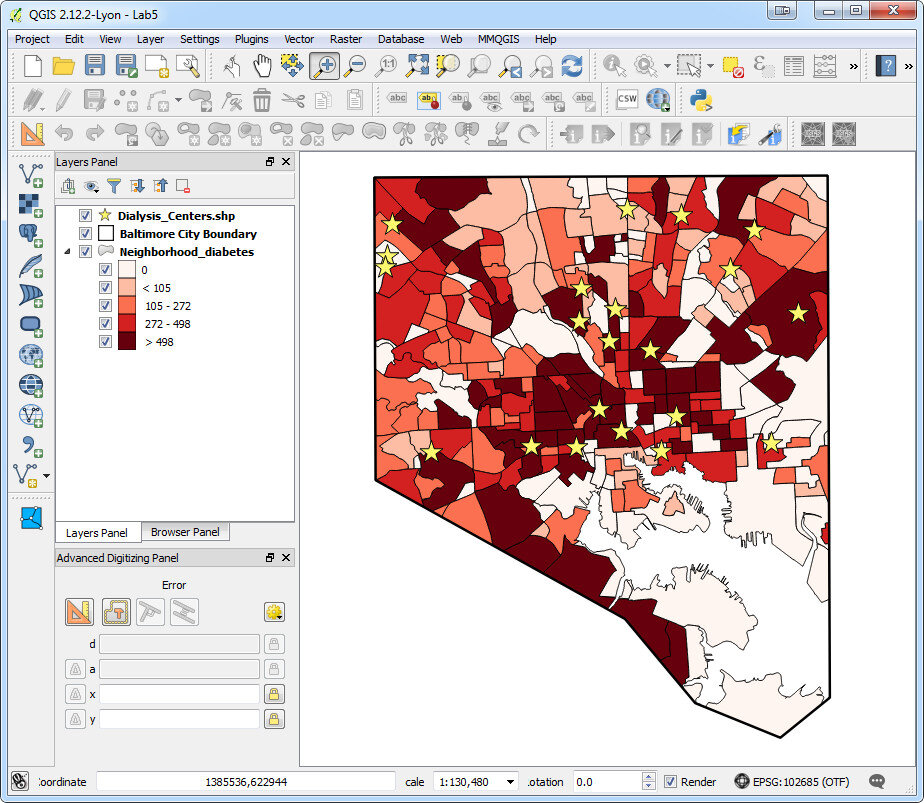
Baltimore Diabetes Data in QGIS DesktopWeb PresentationOften you may want to present an interactive map of your results. Interactive means the map reader can zoom in/out, pan the map and turn layers off and on. For this we recommend CartoDB.You can sign up for a free account, which gives you 50Mb of storage space. Data can be collected with a smart phone or tablet and brought directly into CartoDB.  It is a very intuitive platform. You can literally drag and drop a spreadsheet onto the CartoDB page and have the data upload to your account.  It will accept the most common geospatial file formats including: spreadsheets and comma delimited text files with addresses or coordinates, KML/KMZ, GPX, and shapefiles.CartoDB also has great documentation including:

Baltimore Diabetes Data in CartoDBIn ConclusionThis blog has a lot of resources including reviews of mapping technology and case studies. You might begin by clicking on some of the links in this entry. We are also working on a 6 lab CHM curriculum that interested parties will be able to use to hone their skills. Stay tuned for that!We are always looking for new partners and continuously work to support current project partners. If you are interested, or have questions please don't hesitate to contact John Scott (jscott at cpsc.com) or Kurt Menke (kurt at birdseyeviewgis.com). Most importantly get out and do some mapping in 2016!   

Wildly Successful Community Health Mapping Workshops at MUSC!

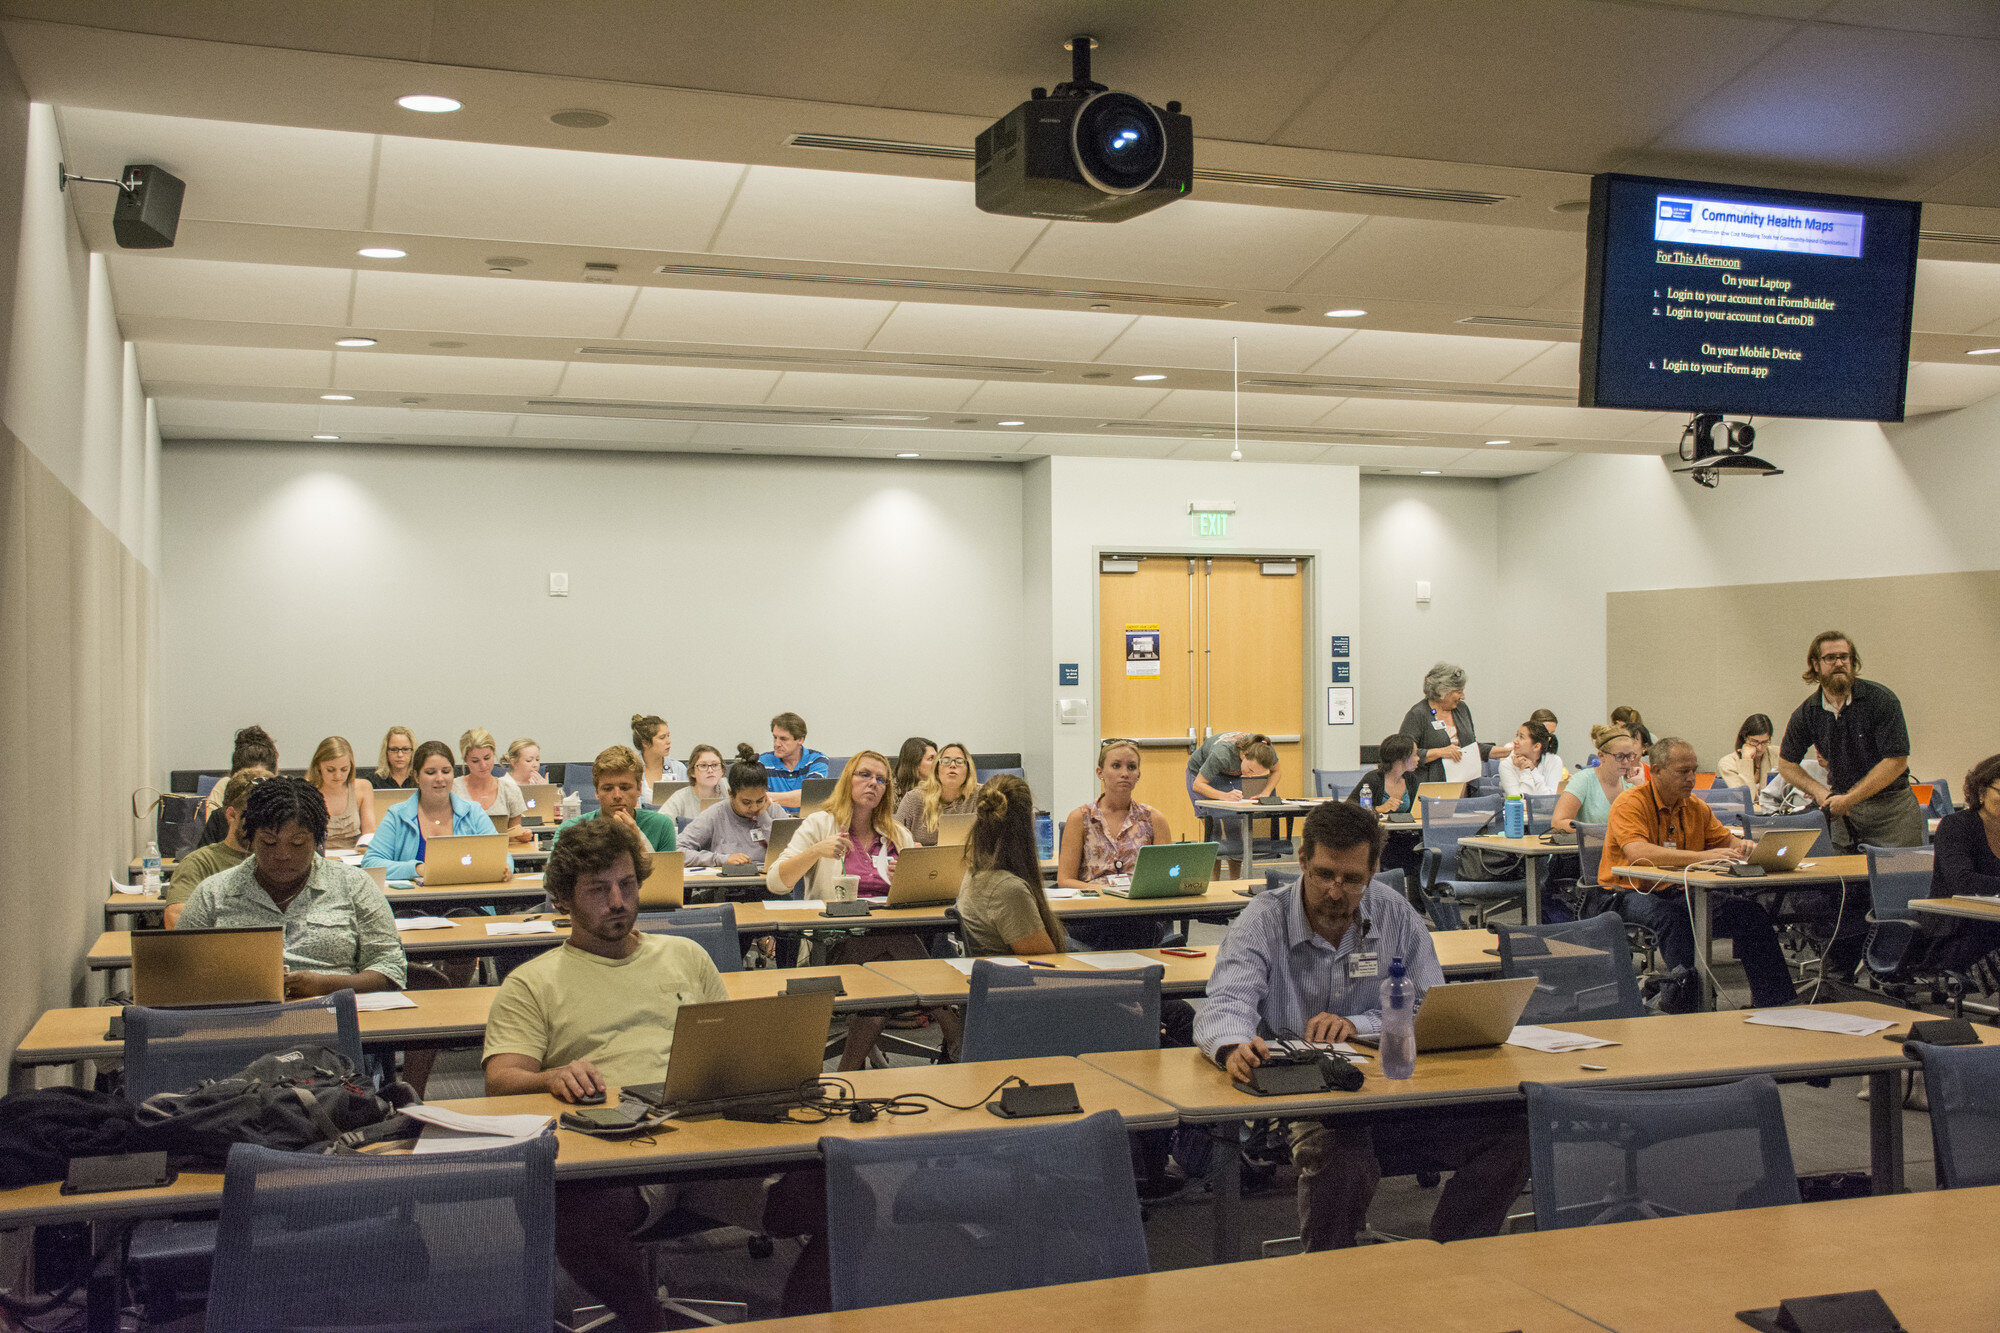
Community Health Maps (CHM) conducted it's largest and most successful workshops ever at the end of September at the Medical University of South Carolina (MUSC). The training at MUSC was divided into three workshops and a presentation. The attendees were a mix of professors, students and researchers, most of whom had little to no experience with GIS. Despite this fact, nearly everyone was able to collect data and make a map. This is a testament to the easy to use nature of the CHM workflow.It began Monday morning with the first workshop. This was an Intermediate Session for those Community Health Mappers who had been working on projects since the April CHM workshop. We spent two hours covering more advanced topics and answering project specific questions.Kurt Menke explaining advanced QGIS features.Following that, Kurt Menke presented a CHM project overview at a brown bag lunch session to 30 attendees. Matt Jones closed this session with a 10 minute talk detailing how he used The Community Health Maps workflow this summer to map access to care on Johns Island.The second workshop was Monday afternoon. It was a two hour session covering field data collection with iForm, and mapping that data online with CartoDB. There were 55 attendees at this session, the vast majority of whom had no GIS experience. In just two hours all 55 attendees were able to collect field data and make a map in CartoDB!iForm and CartoDB Workshop AttendeesThe final workshop on Tuesday was a 5 hour session covering the use of QGIS. The workshop consisted of a custom Charleston based QGIS exercise. Each of the 35 participants worked with a set of Charleston GIS data while learning the basic layout of QGIS. They learned how to add data, style it, and compose a map. The workshop ended with a discussion of each participants goals and project specific questions.QGIS Workshop AttendeesIn total almost 80 people attended one or more sections of the training! Thanks go out to Dr. Deborah Williamson for hosting the workshops, Dana Burshell for organizing the entire event and assisting during the workshops, and to Sarah Reynolds who was invaluable in providing Mac and QGIS support!

Community Health Maps Presentation and Training at the Medical University of South Carolina

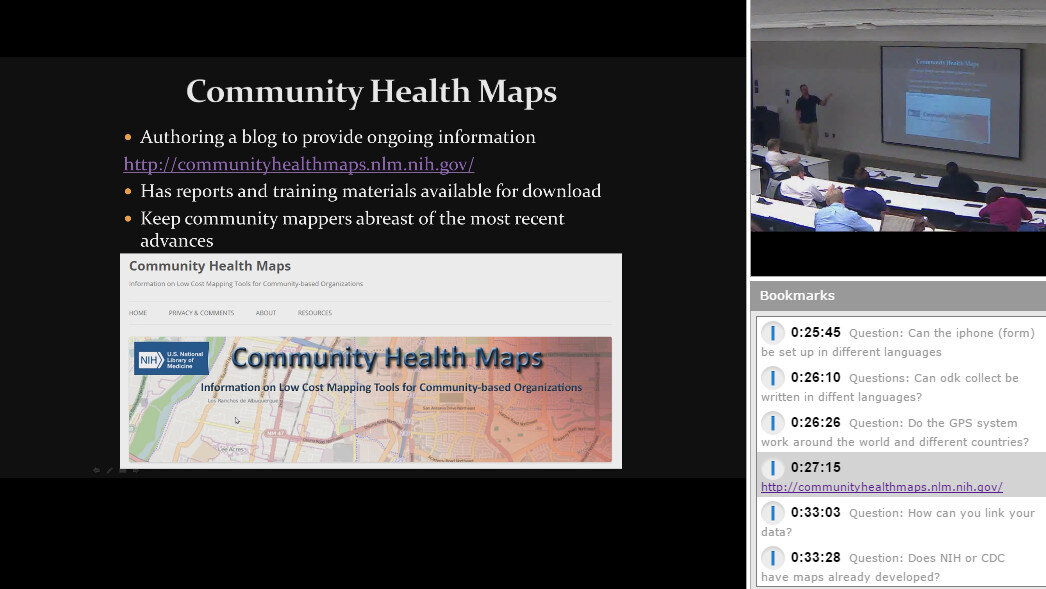
In May Kurt Menke presented the Community Health Maps project, and conducted a training at the Medical University of South Carolina College of Nursing. The presentation was recorded and is now available online. The presentation was about 45 minutes and includes the powerpoint slides, audio and visual. This is a great way for you to learn more about the project from the comfort of your own office!Community Health Map Presentation at MUSC

Community Health Maps Survey

If you've followed this blog, you know that  the goal of the Community Health Maps initiative is to help community organizations identify and apply low-cost and easy-to-use online mapping tools (GIS). If you are a first time visitor to this site we encourage you to peruse the blog entries.The purpose of these tools is to improve understanding and visualization of health conditions in the community so that attention might be best directed to reduce health disparities. This site is a collaborative effort between the National Library of Medicine, the Center for Public Service Communications, and Bird’s Eye View.To help advance this mission we have developed a survey.  The goal of this survey is to assess community health organizations’ satisfaction with GIS / mapping resources currently available to them.  The information will be used to improve NLM’s Community Health Maps site and tailor it to specific user requirements.You are encouraged to click the link below and take this brief survey.https://www.surveymonkey.com/s/NLM_GISsurvey